
The new European legislation requires the ESAs (European Supervisor Authorities, among which EIOPA), the ESRB (European Systematic Risk Board) and the ECB (European Central Bank) to develop a common set of qualitative and quantitative indicators (i.e. a Risk DashBoard – RDB) to identify and measure systematic risk. To accomplish this task, the institutions have determined a set of general rules for the RDB. They must be:
- built on the same list of risk categories, to which each institution can add further ones, specific of the sector (e.g. underwriting risk for the insurances)
- constructed on a flexible basis
- consistent in the underlying information when the same indicator is used.
EIOPA RDB is published on a quarterly basis and it is based on public market data and Solvency II data (Quarterly and Annual Financial Stability Reporting for Groups and Solo Prudential Reporting for Solo). It considers 57 indicators to each of which a score ranging from 1 (low risk) to 10 (high risk) is assigned. When assigning a score to each indicator, different sizes of the entities are considered through the use of weighting parameters that can vary (e.g. premiums, technical provisions, assets, SCR) according to the indicator under examination.
These 57 indicators are aggregated into 8 (=7+1) risk categories characterized by a colour code to represent the final level of the risk; its changes over time are represented by arrows. The indicators are in principle equally weighted, however it may be that some weights are increased / decreased when the indictor is particularly important / high correlated with others.
EIOPA published its RDB updated to the first-quarter 2017 data last 31 July 2017. The data cover a sample of 93 insurance groups and 3,076 solo insurance undertakings.
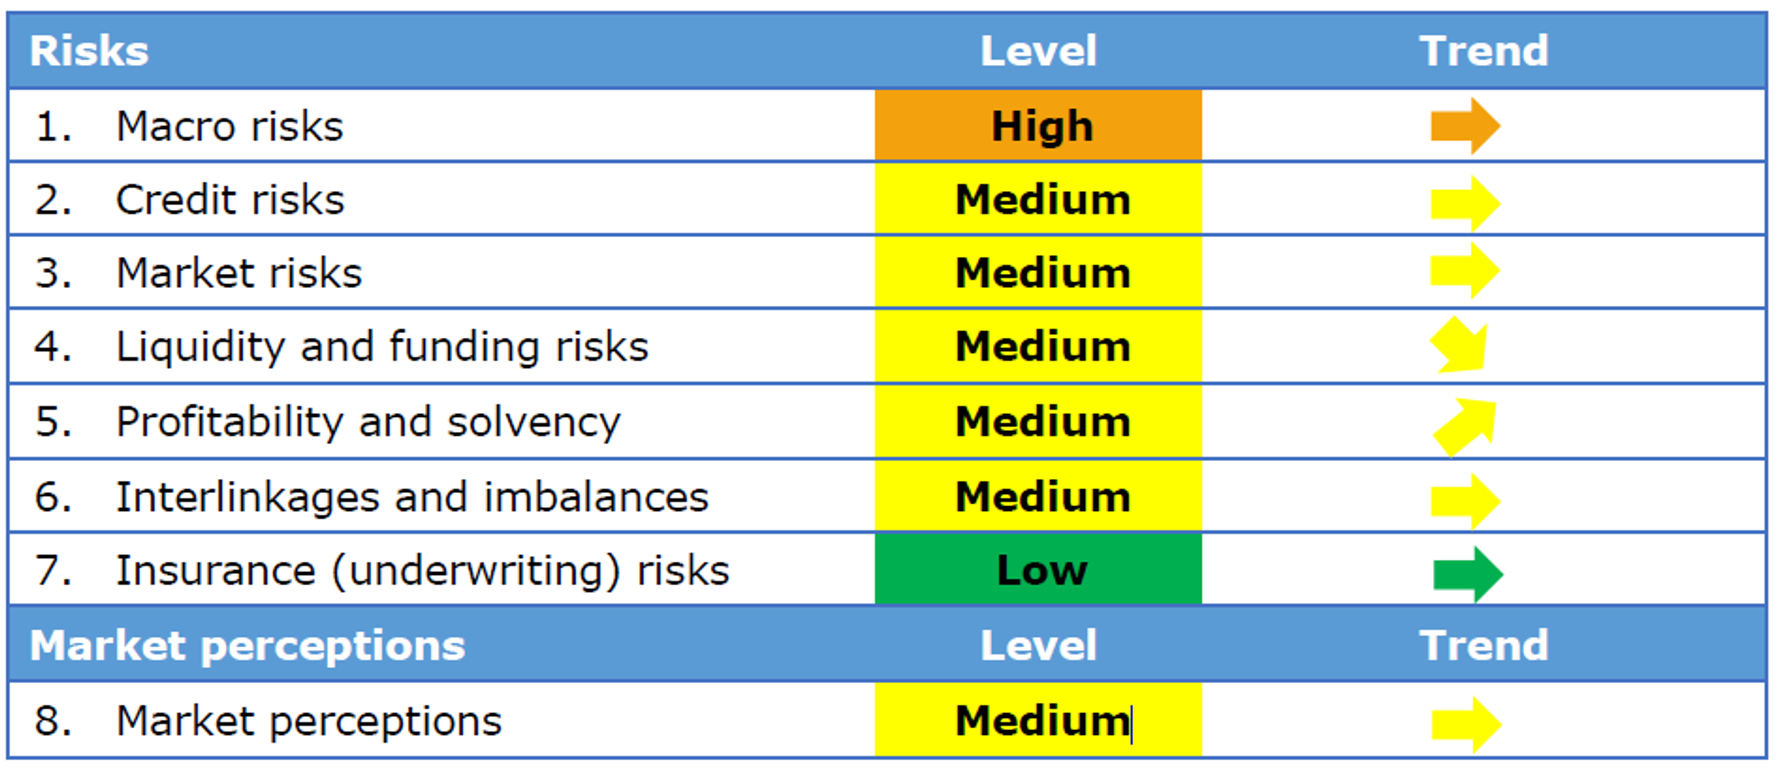
Some comments on the results split by risk category
1. Macro risks [high, stable]
This is an overarching category affecting the whole economy, which considers economic growth, monetary policies, consumer price indices and fiscal balances.
The data show an economic environment that remains fragile because of the enduring low-yields. The GDP forecast stays around 2% expected real growth; the policy rates of the Central Banks increase following the monetary policy changes in the US and the Central Banks balance sheets expand, reflecting the stepping up of liquidity provision and an increased intermediation role. The inflation rates move within the target range, the fiscal deficit is similar to the previous quarter and the unemployment rate decrease.
2. Credit risks [medium, stable]
This category measures the vulnerability to the credit risk by looking at the relevant credit asset classes exposures combined with the associated metrics (e.g. government securities and credit spread on sovereigns). The credit risk seems not to be properly reflected in the market prices, where the observed spreads keep on decreasing and are close to their historical minimum. The credit quality of the investments has slightly improved (average rating between A and A+); loans and mortgages counts for a small portion of the total assets; household indebtedness is elevated
3. Market risks [medium, stable]
This vulnerability of the insurance sector to adverse developments is evaluated based on the investment exposures, while the current level of riskiness is evaluated based on the volatility of the yields together with the difference between the investment returns and the guaranteed interest rates. The exposures to bonds, equity and property remain stable, while their volatilities decrease.
4. Liquidity and funding risk [medium, decreasing]
The vulnerability to liquidity shocked is monitored measuring the lapse rate, the holding in cash and the issuance of catastrophe bonds (low volumes or high spreads correspond to a reduction in the demand which could forma a risk). The share of cash holding and the average coupon divided by the maturity decrease slightly, while the proportion of more liquid assets in the portfolio remains stable; the announced volume of CAT bonds increase.
5. Profitability and solvency [medium, increasing]
The solvency level is measured via SCR and quality of OF, while the profitability via return on investments / combined ratio for the life / non-life sectors. The SCR ratio is stable at group level (198%), while it decreases in both life (160%, -5%) and non-life (220%, -9%) Solo. The net combined ratio has slightly deteriorated, while the profitability shows positive signs in the life business. The quality of OF is still high.
6. Interlinkages and imbalances [medium, stable]
Interlinkages are assessed between primary insurers and reinsurers, insurance and banking sector and among the derivative holdings. The exposure towards domestic sovereign debt is considered as well. Data show stable investment exposures to the different financial services and slight increase in the exposure towards reinsurers.
7. Insurance (underwriting) risk [low, stable]
Indicators for insurance risks are gross written premia, claims and losses due to natural catastrophes. Written premia show a 5% increase in both life and non-life sectors, cat losses are stable, while the loss ratio has increased for small undertakings.
8. Market perception [medium, stable]
The quantities assessed are relative stock market performances (insurance stock keeps on performing worse than the Stoxx 600), price to earnings ratio (slight improved), CDS spreads and external rating outlooks (unchanged).

