The Bank for International Settlement (BIS) published a snapshot of the outstanding OTC derivatives transactions statistics at the end of the first semester of this year. The main results are summarized as follows:
- The notional value of outstanding OTC derivatives increased from $532 trillion at end-2017 to $595 trillion at end-June 2018. This increase in activity was driven largely by US dollar interest rate contracts, especially short-term contracts.
- The gross market value of OTC derivatives continued to decline, nearing $10 trillion at end-June 2018 from $11 trillion at end-2017 – compared with the peak of $35 trillion observed in 2008. This decline reflected in part ongoing structural changes in OTC derivatives markets.
- The proportion of outstanding OTC derivatives that dealers cleared through central counterparties (CCPs) held steady, at around 76% for interest rate derivatives and 54% for credit default swaps (CDS).
Gross market values declined despite an increase in notional amounts
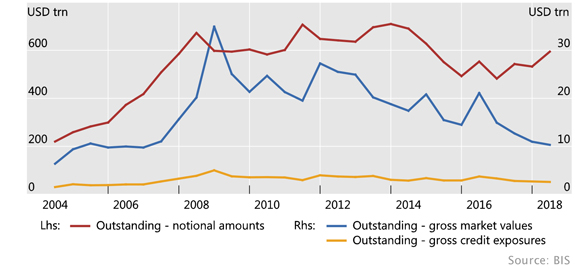
Graph 1: Outstanding OTC derivatives, USD trillions (interactive graph).
Source: BIS OTC derivatives statistics (Table D5.1).
Activity in OTC derivatives markets increased in the first half of 2018, driven mainly by short-term interest rate contracts. The notional amount of outstanding OTC derivatives contracts – which determines contractual payments – increased to $595 trillion at end-June 2018, its highest level since 2015 (Graph 1, red line). Nevertheless, the gross market value of outstanding derivatives contracts – which provides a more meaningful measure of amounts at risk – continued to decline, to $10 trillion, its lowest level since 2007 (blue line). Gross credit exposures, which adjust gross market values for legally enforceable bilateral netting agreements, remained stable at $2.6 trillion at end-June 2018 (yellow line).
US dollar contracts drove the increase in notionals
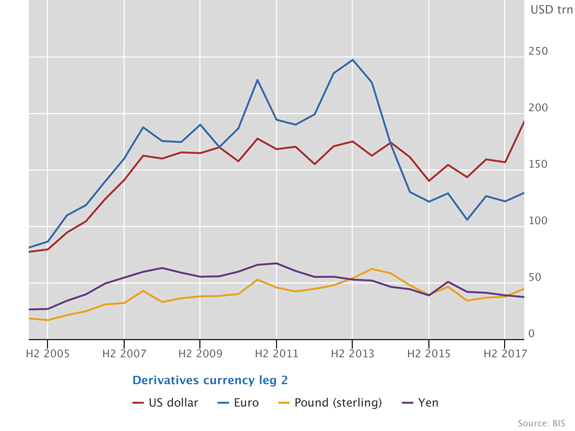
Graph 2: Outstanding notional amounts of OTC interest rate derivatives, USD trillions (interactive graph).
Source: BIS OTC derivatives statistics (Table D7)
The increase in notional amounts outstanding was driven mainly by OTC interest rate derivatives, in particular for US dollar-denominated contracts, which rose from $157 trillion at end-2017 to $193 trillion at end-June 2018 (Graph 2, red line). An increase in US dollar activity was also seen in exchange-traded derivatives markets, where the average daily turnover of futures and options on dollar interest rates climbed to a record high of $9.6 trillion in the month of February. This increased activity may reflect changing expectations about the path of future US dollar interest rates during the period. The notional amounts outstanding of euro-denominated interest rate derivatives also went up over this period, but more modestly, from $122 trillion to $129 trillion (blue line).
The increase in OTC interest rate derivatives activity was concentrated in the short-term segment. The notional amount of outstanding contracts with a remaining maturity up to and including one year rose from $191 trillion to $231 trillion between end-2017 and end-June 2018. The increase for contracts with a remaining maturity between one and five years was less pronounced, from $140 trillion to $155 trillion, and longer-term contracts (with a remaining maturity over five years) held roughly constant, at around $94 trillion.
Turning to OTC foreign exchange (FX) derivatives markets, notional amounts rose to a record high of $96 trillion at end-June 2018, up from $87 trillion at end-December 2017. This was also driven by activity in short-term instruments. In contrast to other OTC derivatives, most FX derivatives require counterparties to repay the notional amount at maturity and thus can be viewed as a form of collateralised borrowing, with the associated foreign currency repayment and liquidity risks.
Market value of interest rate and credit derivatives declined further
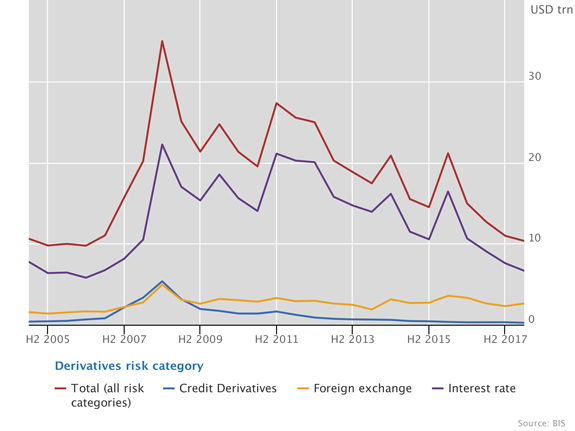
Graph 3: Outstanding gross market values, trillions USD (interactive graph).
Source: BIS OTC derivatives statistics (Table D5.1).
Despite the increase in notional amounts in the first half of 2018, the gross market values of outstanding OTC derivatives continued to decline. Gross market values for all OTC derivatives stood at $10.3 trillion at end-June 2018, down from $11.0 trillion at end-2017 (Graph 3, red line). Over that same period, the gross market value of interest rate derivatives declined by $1 trillion, ending at $6.6 trillion (purple line). Other segments of OTC derivatives markets saw smaller movements, with FX derivatives increasing from $2.3 trillion to $2.6 trillion (yellow line) and credit derivatives decreasing from $0.3 trillion to $0.2 trillion (blue line).
The continuing decline in gross market values reflected in part ongoing structural changes in OTC derivatives markets. These changes include central clearing and greater possibilities for trade compression – that is, the elimination of economically redundant derivatives positions. In addition, in recent periods an increasing number of banks have been recording variation margin on cleared derivatives as settlement payments rather than as transfers of collateral. The practice of so-called settled-to-market (STM) allows counterparties to take ownership of the collateral that they receive. Consequently, daily payments of variation margin are recorded as settlements of the derivatives transactions rather than as transfers of collateral and the market value of the derivatives is reset daily to zero. STM, which is increasingly adopted for cleared swaps in particular, thus results in lower market values for a given derivative.
Clearing in credit default swap markets was steady at 54%
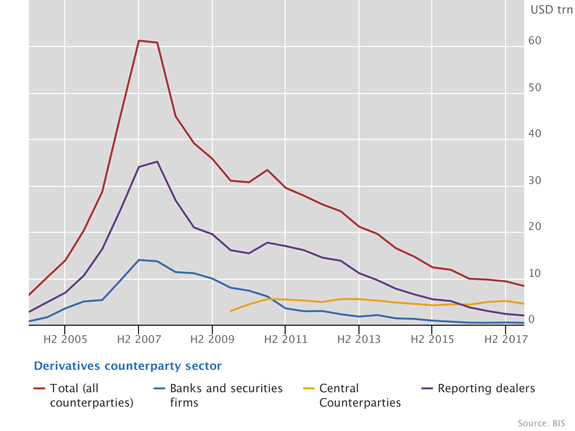
Graph 4: Outstanding notional amounts of CDS, USD trillions (interactive graph).
Source: BIS OTC derivatives statistics (Table D10.1).
Notional amounts of CDS continued to decline, owing to decreased activity between reporting dealers. From end-June 2016 to end-June 2018, total notional amounts dropped from $12 trillion to $8 trillion, amounts vis-à-vis reporting dealers declined from $5 trillion to $2 trillion, and amounts vis-à-vis CCPs remained steady around $4.5 trillion (Graph 4). In the first half of 2018, the share of notional amounts cleared with CCPs was stable at 54%, in contrast to the upward trend over the past few years.
In OTC interest rate derivatives markets, the proportion of contracts cleared was also steady in the first half of 2018, at around 76% overall. Across currencies, the proportion ranged from 73% for euro interest rate contracts to 77% for US dollar contracts and 89% for Canadian dollar contracts. In OTC FX derivatives markets, clearing accounted for only 3.0% of dealers’ outstanding contracts at end-June 2018. While low, this was up from 2.4% at end-December 2017.
Statistical release: OTC derivatives statistics at end-June 2018 (PDF)

