
On the 30th November 2014 the EIOPA published the results of its EU-wide Insurance Stress Test; the participation was sufficiently representative to draw inferences: the core module exercise (CA1 and CA2) was completed by 55% of gross premium income in EU market (60 groups and 107 companies) and the low yield module (LYA and LYB) was completed by 60% of technical provisions (225 individual companies) – EIOPA expectation was to have at least 50% of the insurance market of each country. Whereas the core module was conducted at group level (if participating groups and undertakings are part of a financial conglomerate, then only the insurance balance sheet is stressed), the low yield module was conducted at solo level.
Undertakings computed the results on a “best efforts” basis (participants could use approximations whenever these figures would not lead to fundamentally different results) and using the Standard Formula, without making use of the Undertaking Specific Parameters (USP). The latest specifications available (at the time the exercise was launched) were used, including the Long Term Guarantee (LTG) package. The application of the LTG measures was optional (undertakings had to provide their results without the use of LTG in any case) and participants only made limited use of them given the early preparation stage of the LTG implementation. Being the stress test based on preliminary Solvency II requirements, the results on the solvency situation of the market might not fully reflect the reality that we would observe if Solvency II was already in place: participants might have not yet fully prepared their balance sheets to fully comply with the latest Solvency II framework requirements (e.g. application of the so-called contract boundaries).
Since this stress test was focused on vulnerabilities of the participants’ balance sheets (impact on assets, liabilities, own funds,..) rather than on post-stressed solvency ratios, one of the simplifications adopted was not to reassess the SCR/MCR and Risk Margin post stress: it was expected that the use of pre-stress SCRs would have been conservative as the post-stress SCRs is likely to decline. This is an area of further investigation for EIOPA given that the reassessment performed by some participants mostly showed an increase of post-stress SCRs.
The Core Module of the exercise focuses on measuring resilience of insurance undertakings to adverse developments centered on the market, credit and insurance risk components. The Low Yield module measures the scope and scale of risks from a prolonged low interest rate environment and hence focuses on the potential impact of interest rate movements.
Before looking at the final figures, it’s worthy to give an outline of the pre-stress situation.
1. Pre-stress situation – Asset profile
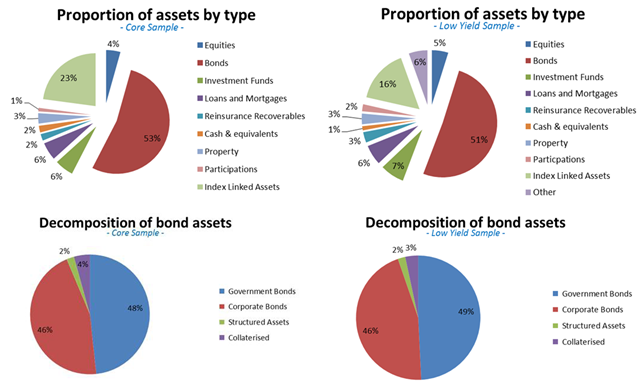
The analysis of the asset profile shows that the type and the level of stress parameters selected for the 2014 exercise were appropriate.
– As shown in the charts, large part of the assets of the companies belongs to the categories of fixed income assets:
- within the bond asset class, the majority of investments fall in the category of governments bonds and corporate bonds.
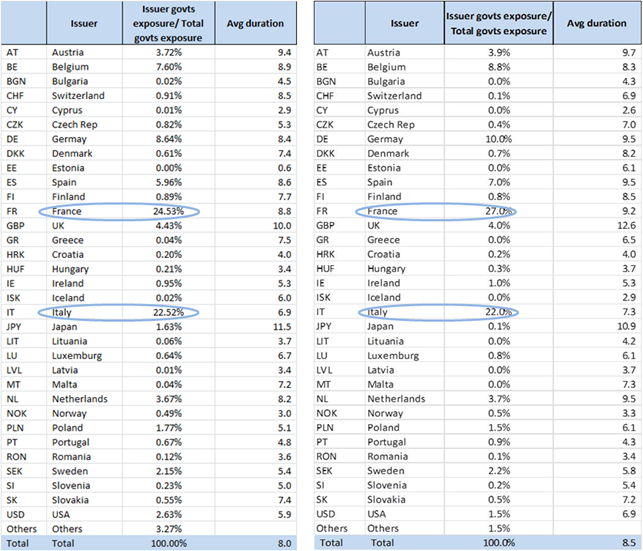
- The figures on the government bond exposure reported in the table below highlight a high concentration in Italian and French government bonds whose spreads could drive the final outcomes; the concentration of higher quality bonds is on average higher than that of lower quality bonds.
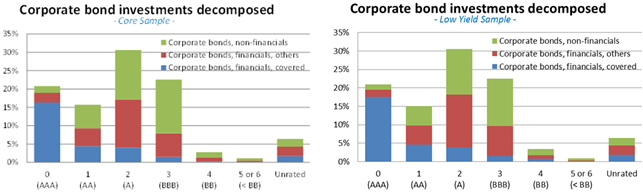
- Also for the corporate bonds, there is a higher concentration in higher quality assets (the steep drop after the third credit quality step is remarkable) however more than 6% of corporate bonds is unrated, which might be a warning sign of a “search for yield” that could have taken place during the recent period of low yields.
- Investments in governments bonds have a duration longer than the one of corporate bonds. Within the latter, duration in higher quality bonds is longer compared to lower quality bonds: this is positive result from a default risk perspective, but it can produce significant duration mismatches in case of long durations for the liabilities. Investments in corporate bonds have often a duration shorter than the one of government bonds.
To assess the vulnerabilities of this kind of framework, the core scenarios have been designed with a focus on interest and spread sensitive stresses; as far as the low yield module is concerned, it is expected that bonds, loans and mortgages are the asset classes most sensitive to the movements in the low yield scenario.
– As a limited exposure to equity and property was expected, the mild stress levels for these asset classes in the CA1 seems to be appropriate.
Pre-stress situation – Liability profile
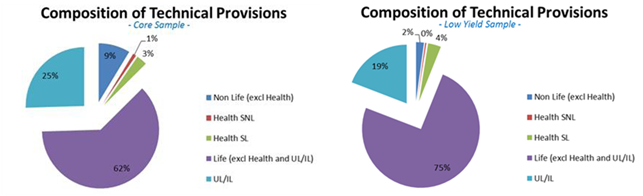
The larger part of technical provisions (TP) is represented by the Life TP, this evidence doesn’t come a surprise given the overall importance of life TP in the balance sheet compared to non life as well as the selection criteria of the participants.
To better understand the results obtained with the low yield module, it’s worthy to notice that:
– average guaranteed rates on life insurance business (excluding unit-linked and index linked business), taking into account options and guarantees and surrenders, are between 2% and 4%;
– over the last 5 years, a general decreasing trend in these average guaranteed rates offered can be observed.
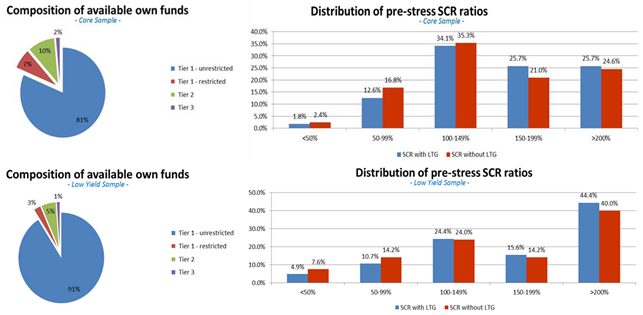
2. Pre-stress situation – Own funds (OF) and SCR profile
As shown in the charts below, the pre-stress situation is almost quiet:
– the capitalization is of high quality (large part of OF is made up of unrestricted tier 1 capital), yielding a good loss absorbing capacity of the companies,
– considering the application of LTG measures, more than 14% of the total core sample and about 16% of the total low yield sample do not meet the SCR requirements, however, as already pointed out, these figures should not be overestimated given the early preparatory phase of SII and the limited use of LTG measures. It’s worthy to notice how the LTG package helps to obtain better results.
As expected, the main driver of the SCR is the market risk, being the TP dominated by classical life insurance business; within it, the most material risks are equity and spread risk. These risks will therefore drive the results of asset stresses in the 2014 exercise. Interest rate risk is material due to the common duration mismatches between asset and liabilities and plays an important role especially in the low yield module: the more positive the duration mismatch (liabilities > asset), the more vulnerable insurance companies are to negative interest rate shocks (and low yield curve in general).

3. Post-stress situation – Final figures
As already mentioned, for the 2014 stress test the post stresses SCR was not reassessed being the exercise focused on the vulnerability of the participants’ balance sheets (impact on assets, liabilities, own funds,..) rather than on post-stressed solvency ratios. Some considerations:
– as shown in the charts below, the most severe scenario was the CA1, where the whole sample lost more than 40% of the total excess of asset over liabilities; compared to CA1, the changes for CA2, LYA and LYB are milder (about 20%, 10% and 6%, respectively); a similar result is observed for OF;
– an identifiable correlation between pre-stress SCR and resilience of undertakings was observed: the higher the coverage ratio, the more the participants resist the shocks. This correlation structure is clearer for CA2 than for CA1 being the scenario less severe and the indicator less capable to capture non linear effects.

The LTG pack was designed to mitigate procyclicality in the Solvency II framework and has an important impact on the calculation of the impact of stress scenarios. As expected, the LTG measures operate in the direction and the manner intended. As can be seen in the table below, Loss Absorbing Capacities (LAC) – Technical Provisions (TP) and Deferred Taxes (DF) – and LTG measures increase significantly the resilience of the companies. Among the LTG measures, the most commonly applied was the Volatility Adjustment. Due to the early stage, the LTG package was applied by a small sample of participants: larger and presumably more sophisticated entities made a greater use of LTG measures (79% of Top 30 entities) than smaller entities (36% of Non Top 30 entities).
|
Change in assets over liabilities |
CA1 |
CA2 |
LYA |
LYB |
|
| Before LAC (TP and DT) | without LTG |
97.40% |
50.70% |
25.20% |
17.10% |
| with LTG |
66.00% |
30.90% |
N.A. |
N.A. |
|
| After LAC (TP and DT) | without LTG |
67.60% |
31.20% |
16.90% |
10.80% |
| with LTG |
36.90% |
16.80% |
10.30% |
6.10% |
|
– “without LTG” figures contain only companies which reported changes;
– in CA1 and CA2 “Before LAC without LTG” is before LAC of TP only.
The following chart shows how the post-stress solvency ratios of the companies change depending on the starting capital position point with respect to the SCR with no reassessment for SCR and including the impact of LTG. The fraction of participants without enough own funds to cover their capital requirements changes as follows:
– CA1 increase from 14.2% to 44.4%, 30.2% absolute delta
– CA2 increase from 14.3% to 27.4%, 13.1% absolute delta
– LYA increase from 16.4% to 24.2%, 7.8% absolute delta
– LYB increase from 16.5% to 20.2%, 3.7% absolute delta

4. CA2 questionnaire – qualitative analysis
The CA2 scenario was complemented by a set of questions regarding insurers’ likely responses to the scenario with the purpose of identifying potential herd behavior that could induce a financial stability impact. The most interesting findings are:
– a need for immediate restructuring is claimed by 66% of the participants (even by some of the ones that were still healthy after the stresses); restructuring would be attained through an increase of capital (40%), a change of the investment portfolio (30%) and other measures (30%) ;
– a need for actions to preserve profitability: cost control (20%), change in asset composition (18%) and change in product mix (15%);
– participants indicated that they were not large enough to move the market in case of assets sales.
5.Summary
– A significant minority of undertakings do not meet the SCR threshold in the Baseline case, a rather small subset do not meet the MCR. After 1 January 2016, the Solvency II legislation would require direct supervisory action in both cases.
– The stress scenarios demonstrate that a severe reversal in markets would have a significant impact on the capitalization of the sector; the impact of the low yield scenarios is not as severe as the CA1 scenario, however duration mismatches and IRR mismatches were found across several jurisdictions and a cluster of them are vulnerable to a period of prolonged low interest rates (challenges posed by the low yield environment are immediate, although negative cash flows appear around 8-11 years).
– Small entities were not prepared to utilize LTG measures.
As said by Gabriel Bernardino (chairman of EIOPA), the stress test gave EU supervisors an updated picture of the undertakings preparedness to comply with the upcoming Solvency II capital requirements and indicated the areas where undertakings are most vulnerable. Having considered the results and in order to address in a coordinated way the identified vulnerabilities, the EIOPA Board of Supervisors agreed a two-step approach of follow-up actions: as a first step EIOPA has already issued a set of general overarching recommendations to National Supervisory Authorities (NSAs); the second step will be bilateral engagement with NSAs (this could extend to the issuance of specific recommendations).
The main overarching recommendations suggested by EIOPA to the NSAs are:
– to pay particular attention to the preparation of those undertakings whose capital resulted insufficient in the Baseline case and to assess the preparedness of insurance undertakings to implement Solvency II;
– to be ready to operate the transitional provisions related to non-compliance with either the MCR or the SCR and to assess the ability of the undertakings to make informed choice on the use of the LTG and of the Transitional measures;
– to assess the existence of a robust system of governance (with the capacity of implementing meaningful adjustment plans and of progressing reports) and to ensure that undertakings have a clear understanding of their risk exposures and are capable of taking recovery actions;
– to engage with those undertakings that are operating with considerable duration or internal rate of return mismatches in order to assess their ALM and risk management practices in terms of sustainability and the degree to which underlying risks are addressed, as well as ensure that undertakings properly assess the sustainability of the guaranteed rates that are offered;
– to deal with undertakings deemed to be operating unsustainable business models by taking the necessary action to protect policyholders.

