
Abstract
We applied the Johansen-Ledoit-Sornette (JLS) model to detect possible bubbles and crashes related to the Brexit/Bremain referendum scheduled for 23rd June 2016. Our implementation includes an enhanced model calibration using Genetic Algorithms. We selected a few historical financial series sensitive to the Brexit/Bremain scenario, representative of mutiple asset classes.
We found that equity and currency asset classes show no bubble signals, while rates, credit and real estate show super-exponential behaviour and instabilities typical of bubble regime. Out study suggests that, under the JLS model, equity and currency markets do not expect crashes or bursts following the referendum results, thus supporting a Bremain scenario. Instead, rates and credit markets consider the referendum a risky event, expecting either a Bremain scenario or a Brexit scenario edulcorated by central banks intervention. In the case of real estate, a crash is expected, but its relationship with the referendum results is questionable.
1. Brexit or Bremain ?
On Dec. 17, 2015 the Parliament of the United Kingdom approved the European Union Referendum Act 2015 to hold a referendum on whether the United Kingdom should remain a member of the European Union (EU).
The referendum will be held* on Jun. 23, 2016, with the following Q&A:
- Q: ”Should the United Kingdom remain a member of the European Union or leave the European Union?
- A1: “Remain a member of the European Union”
- A2: “Leave the European Union”
In case of Brexit decision, there is no immediate withdrawal. Instead, a negotiation period begins to establish the future relationship between UK and EU. The negotiation length is two years, extendible. For example, the agreements between EU and Switzerland took 10 years of negotiations.
Referendum campaigning has been suspended on 16th June 2016 following the shooting of Labour MP Jo Cox. This event has had a strong impact on the public opinion, rapidly changing the opinion polls and possibly the attitude of the country.
Forecasting the results of the 23rd June 2016 referendum is clearly a very challenging task. There exist at least three sources of forecast data:
- Opinion polls [5] [7]
- Bookmakers betting odds [6]
- Market data [7]
In this paper we recur to a different forecasting approach, described in the next section.
2. Methodology
We applied a forecasting methodology based on the Johansen-Ledoit-Sornette (JLS) model, developed since the 90s at ETHZ by D. Sornette and co-authors [1][2]. The JLS model is extensively applied to detect bubbles, crashes and crisis analysis in many fields. For applications in finance see e.g. the Financial Crisis Observatory [3].
The JLS model assumes that, during a bubble regime, the asset mean value follows a super-exponential path showing log-periodic instabilities, the so called Log-Periodic Power-Law function, up to a critical time tc, representing the most probable time for a possible crash event,
LPPL(t) = A + B (tc – t)m + C (tc – t)m cos(ω log(tc – t) + φ).
The seven JLS parameters (A, B, C, m, ω, φ, tc) must be calibrated to fit the asset’s historical series.
Our implementation of the JLS model is based on JLS papers [1][2], enhanced with robust global optimization methods, i.e. Genetic Algorithms for model calibration [4].
We applied the JLS model to a selection of historical financial series sensitive to the current Brexit/Bremain scenario. For each series, we have run multiple model calibrations with different calibration windows, to ensure the stability of the observed results.
3. Results
The results are reported in the following figures Figure 1Figure 8, and the comments are included in their corresponding captions.
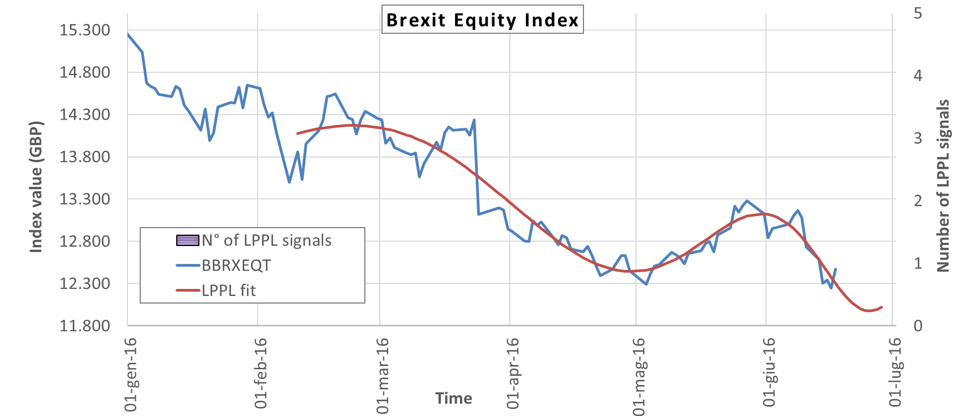
Figure 1
- Source: Brexit Equity Index (Bloomberg BBRXEQT Index), basket of 10 UK stocks designed to reflect British exposure to the EU across different sectors. Data up to Friday 17th June 2016.
- Comments: the historical series shows a decreasing trend, but no super-exponential behaviour and instabilities typical of bubble regime. In fact, the JLS model (LPPL fit) does not propose valid bubble and crash signals.
- Interpretation: market participants are currently suspicious about UK stock market, but do not actually fear either a crash following Brexit or a burst following Bremain.
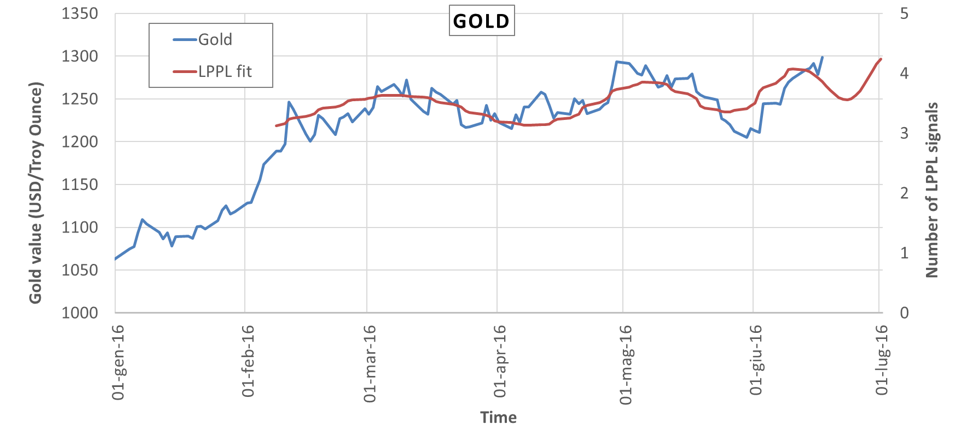
Figure 2
- Source: gold prices (Bloomberg XAU BGN Crncy). Data up to Friday 17th June 2016.
- Comments: the historical series shows an increasing trend, but no super-exponential behaviour and instabilities typical of bubble regime. In fact, the JLS model (LPPL fit) does not propose valid bubble and crash signals.
- Interpretation: market participants are currently refuging into gold, but do actually fear neither a burst following Brexit nor a crash following Bremain. This result is consistent with the BBRXEQT and GBPUSD FX rate observations.
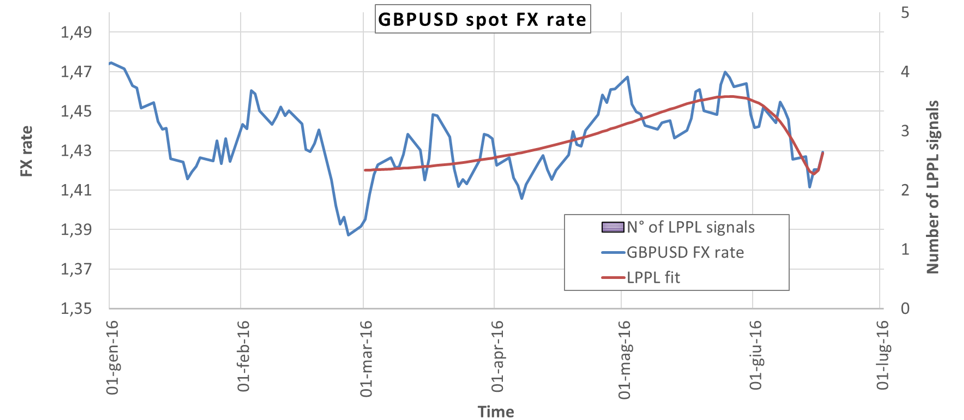
Figure 3
- Source: GBP/USD FX rate (Bloomberg GBPUSD BGN Crncy). Data up to Friday 17th June 2016.
- Comments: the historical series shows an erratic trend, no super-exponential behaviour and instabilities typical of bubble regime. In fact, the JLS model (LPPL fit) does not propose valid bubble and crash signals.
- Interpretation: market participants but do not actually fear either a crash following Brexit or a burst following Bremain. This result is consistent with the BBRXEQT and GBPUSD FX rate observations.

Figure 4
- Source: GBP/EUR FX rate (Bloomberg GBPEUR BGN Crncy). Data up to Friday 17th June 2016.
- Comments: as for GBP/USD
- Interpretation: as for GBP/USD.
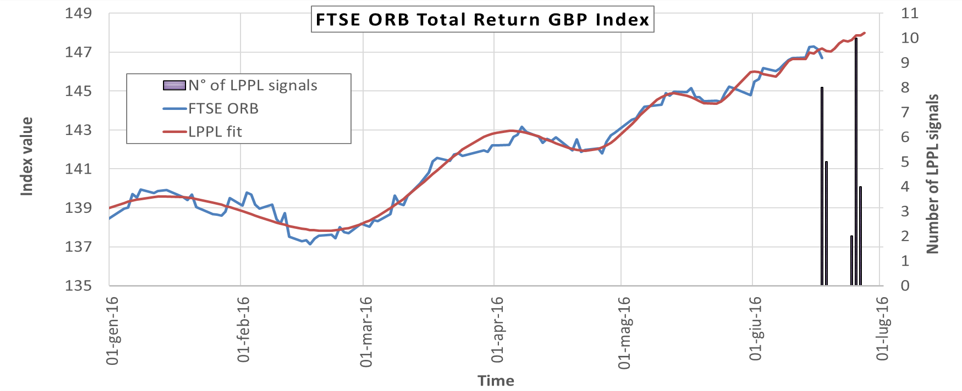
Figure 5
- Source: FTSE ORB Total Return GBP Index (Bloomberg TFTSEORB Index), includes GBP fixed coupon Corporate bonds trading on LSE across different industry sectors and maturity bands. Data up to Friday 17th June 2016.
- Comments: the historical series shows an upward trend (due to the overall lowering discount rates, driven by lowering GBPLibor w.r.t. increasing GBP credit spreads) and super-exponential growth and instabilities typical of bubble regime. In fact, the JLS model (LPPL fit) propose several valid crash signals around 23th June.
- Interpretation: market participants consider the referendum a risky event for corporate bonds, expecting either a Bremain scenario or the BoE intervention in case of Brexit.
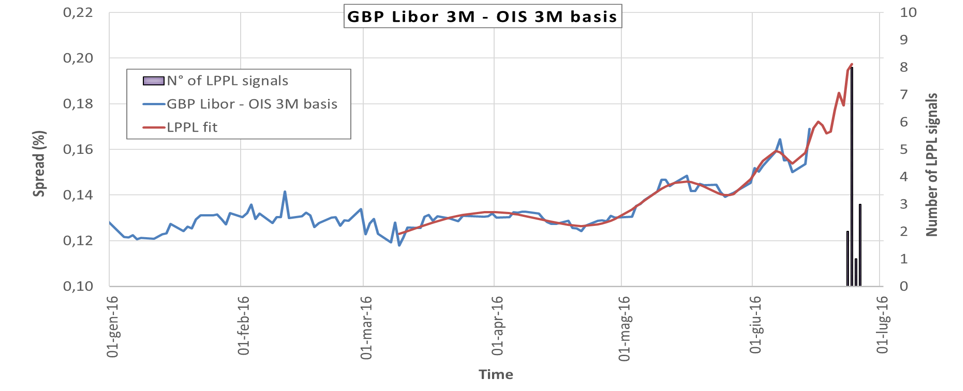
Figure 6
- Source: GBPLibor3M vs GBP OIS 3M (Bloomberg BP003M Index – BPSWSC Crncy). Measures the London interbank credit and liquidity risk on 3M time horizon relative to overnight horizon. Data up to Friday 17th June 2016.
- Comments: the historical series shows super-exponential behaviour and instabilities typical of bubble regime. In fact, the JLS model (LPPL fit) does propose valid bubble and crash signals around 24th June.
- Interpretation: market participants expect that the basis spread will crash back to lower values, corresponding to lower credit and liquidity risk in the London interbank market. This result is consistent with the FTSE ORB observations.

Figure 7
- Source: Euribor3M vs EUR OIS 3M (Bloomberg EUR003M Index – EUSWEC Crncy). Measures the EUR interbank credit and liquidity risk on 3M time horizon relative to overnight horizon. Data up to Thursday 16th June 2016.
- Comments: the historical series shows a decreasing trend but no super-exponential behaviour and instabilities typical of bubble regime. In fact, the JLS model (LPPL fit) does not propose valid bubble and crash signals.
- Interpretation: market participants but do not actually fear either a crash following Brexit, also because the expected ECB intervention, or a burst following Bremain.

Figure 8
- Source: UK house price index 8. Data up to April 2016 (this data is updated with delay).
- Comments: the historical series shows an increasing trend with super-exponential behaviour and instabilities typical of bubble regime. In fact, the JLS model (LPPL fit) does propose valid bubble and crash signals around June.
- Interpretation: the trend remembers those observed during the 2008 subprime crisis. Market participants expect a crash, but its relationship with the referendum is questionable, since the growth regime started before the current Brexit/Bremain context, and more recent UK HPI data would be needed to to establish a relationship.
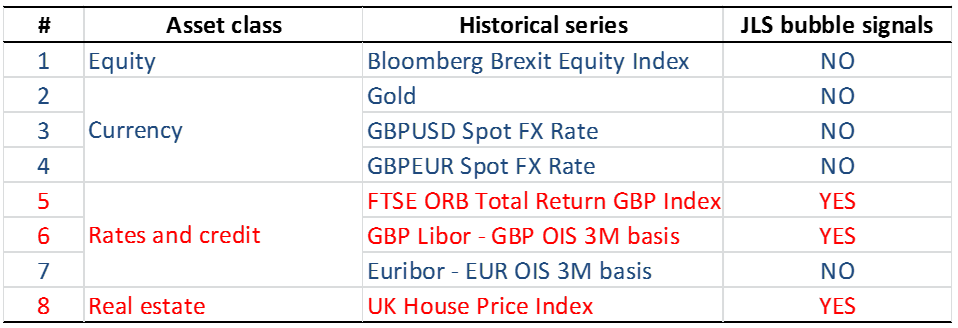
Table 1: summary of JLS bubble signals (col. 4) from figures Figure 1Figure 8.
4. Conclusions
We applied a forecasting methodology based on the Johansen-Ledoit-Sornette (JLS) model, developed since the 90s by D. Sornette at ETHZ and co-authors [1][2], and extensively applied to detect bubbles, crashes and crisis analysis in many fields [3]. Our implementation includes an enhanced model calibration using robust global optimization methods, i.e. Genetic Algorithms [4].
We applied the JLS model to a selection of historical financial series sensitive to the current Brexit/Bremain scenario, representative of equity (BBRXEQT), currency (Gold, GBPUSD and GBPEUR fx), rates and credit (FTSE ORB, GBP and EUR Libor – OIS basis), and real estate (UK HPI) asset classes.
We found the following evidence:
- equity and currency asset classes show no bubble signals,
- rates, credit and real estate show super-exponential behaviour and instabilities typical of bubble regime, with the exception of Euribor-EUR OIS basis.
Out study suggests that, under the JLS model, the following interpretations can be drawn:
- equity and currency: market participants coherently do not expect crashes or bursts following the referendum results, thus supporting a Bremain scenario.
- Rates and credit: market participants coherently consider the referendum a risky event for the London market, expecting either a Bremain scenario or a Brexit scenario edulcorated by central banks intervention.
- In the case of real estate, market participants expect a crash, but its relationship with the referendum results is questionable.
* We stress that this paper was delivered on 21st June 2016, before the referendum scheduled for 23rd June 2016.
[1] D. Sornette, “Dragon-kings, black swans and the prediction of crises”, Swiss Finance Institute Research Paper, no. 09-36, 2009.
[2] A. Johansen, O. Ledoit, and D. Sornette, “Crashes as critical points”, International Journal of Theoretical and Applied Finance, vol. 3, no. 02, pp. 219-255, 2000.
[3] ETHZ Financial Crisis Observatory
[4] A. Salvatori, “Stochastic Models for Self-Organized Criticality in Financial Markets“, Msci Physics Thesis, Università degli Studi di Milano, Mar. 2016.
[5] Opinion polls: see e.g. Wikipedia
[6] Bookmakers betting odds: see e.g. Oddschecker
[7] Bloomberg, Brexit watch indicators
6. Disclaimer and acknowledgments
Disclaimer
The views and the opinions expressed in this document are those of the authors and do not represent the opinions of their employers. They are not responsible for any use that may be made of these contents.
The opinions, forecasts or estimates included in this document strictly refer to the document date, and there is no guarantee that future results or events will be consistent with the present observations and considerations.
This document is written for informative purposes only, it is not intended to influence any investment decisions or promote any product or service.
Acknowledgments
The authors gratefully acknowledge Luca Lopez for fruitful discussion and analysis at the early stage of this project.

