
In the paper “A Machine Learning Model for Lapse Prediction in Life Insurance Contracts” [1], written together with Giancarlo Giuffra (Politecnico di Milano), we use a random forest to predict early lapse in life insurance contracts. Estimating the probability of lapse is estimating the probability that a policy-holder leaves a contract before expiry. We apply explainability techniques to understand which (economic and non-economic) variables drive the policy-holders’ lapse decision.
We confirm that a random performs better than the classical logistic model to predict the lapse decision, even if the interactions between features are taken into account. The ML methodology allowed us to discern the relevance of a wide set of exogenous variables to explain the lapse decision. The main result of our analysis is that the important drivers of the lapse decision are the time passed from the incipit of the contract and the time to expiry, as well as the insurance company, the contract size, and premium.
The dataset considered in our analysis comes from one of the Italian largest insurance companies: it covers the 2008-2016 time interval with over one million life insurance contracts. The contracts refer to three different companies belonging to the same insurance group. As the companies refer to different distributors, either bank assurance relationships or financial advisors. The lapse phenomenon is company-specific because the lapse decision may be driven by the commercial policies of distributors.
The dataset contains many interesting pieces of information about each policy-holder, such as age, region, or gender, and about the specific contract, such as size or product type (unit-linked or standard). Moreover, we consider macro-economic variables relevant for the lapse decision such as GDP, disposable income, or risk-free interest rate.
We compare the ability of two classification models for the lapse decision: a logistic regression (considering regularization and interaction among features) and a RF model (see e.g., [3]). The empirical literature on lapses of insurance contracts exploiting classical techniques (in general regressive models) is quite large but often inconclusive. It is difficult to find a unified framework for the non-stationary lapse phenomenon in different markets and times.
In this perspective, ML tools (such as the Random Forest methodology employed in the paper) provide an interesting approach. The appealing feature is that they are model-free, they allow to consider a large set of variables (and their non-linear interactions) and therefore let the data speak for themselves.
To understand whether this guess is correct we compare the ability of two classification models for the lapse decision: a logistic regression (considering regularization and interaction among features) and a random forest model (RF) model. We use a classical RF classifier based on a combination of simple classification trees.
The random forest significantly outperforms the logistic regression. We compare the two models in terms of the area under the precision-recall curve (AUPR). This curve is obtained by plotting the Precision (the percentage of observations classified as positive that are indeed positive) against the Recall (the percentage of positive observations classified as positive).
The AUPR of the random classifier is equal to the percentage of positive observations, i.e., observations belonging to class 1 in the dataset (in our case 17%) while for the perfect classifier the AUPR yields 1.
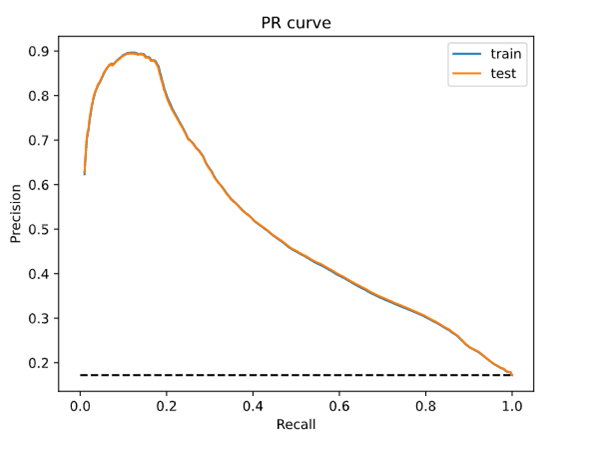
In figure 1, we plot the AUPR for the logistic regression on the train and test sets. Notice that the two curves overlap showing again that there is no evidence of overfitting: the performance of the model on the training set is similar to that obtained on the test set. For recall levels greater than 50% (the percentage of positive observations classified as positive), we observe that the precision of the logistic classifier (the percentage of observations classified as positive that are indeed positive) is always lower than 45%. These results are quite unsatisfactory.
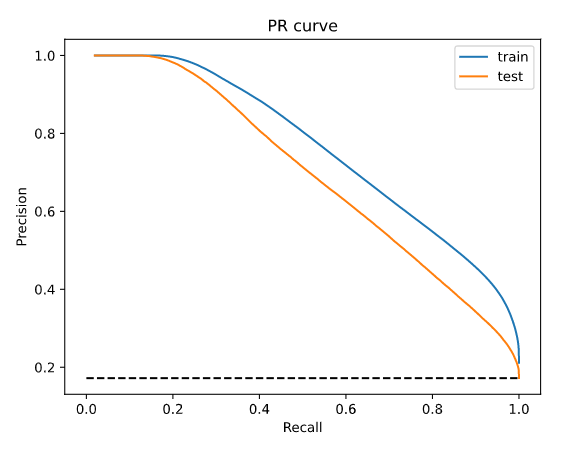
In figure 2, we plot the AUPR of the random forest on train and test sets. Notice that the performances on the two datasets are similar but, as expected, the performance on the training set is slightly better than the performance on the test set. In both cases, the model outperforms considerably the random classifier (that has a precision of 17%) and the logistic regression, see Figure 1. Considering the test set, for recall values equal to 50%, precision is nearly 75%, i.e., to correctly classify 50% of the observed lapses, nearly 75% of the observations classified as lapse are true positive (for logistic regression it was nearly 45%).
The random forest performance significantly beat the linear model. However, the main limit of ML tools is that they appear as black boxes” that are difficult to be interpreted in terms of causal relationships between input and output variables. Several methodologies have been proposed in the literature to cope with the explainability/interpretability of the ML. In the paper, we have used a simple “global” approach.
We build the regression tree that better fits the random forest, i.e., standard features as input and the random forest predictions as output in the training set. We would like to stress that we are approximating a RF made up of fifty trees, each one with (maximum) depth 50, with a single regression tree with a much smaller depth.
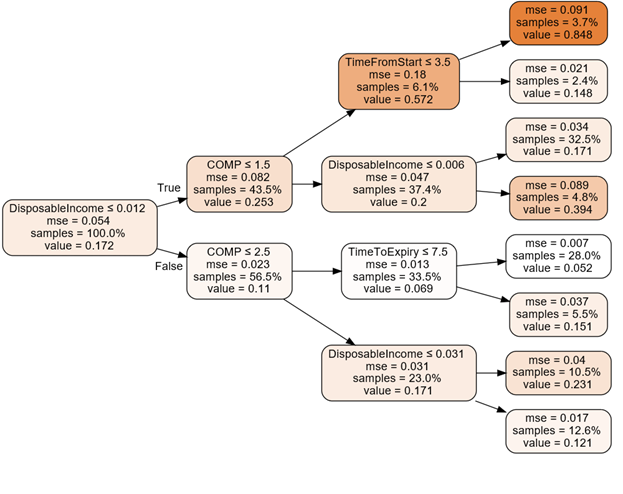
In figure 3, we plot the regression tree fitted on the random forest output.
Each node of the tree contains the following pieces of information:
- The variable used to split the tree.
- The mse that measures the pureness of the tree (a mse of 0 means that the leaf correctly classifies each observation).
- The percentage of observation contained in the node.
- The estimated lapse probability of the node.
The variables that appear in this reduced tree are the insurance company of the group (COMP) the Italian disposable income (DisposableIncome) the time from the beginning of the contract (TimeFromStart) and the time left before the expiry of the contract (TimeToExpiry).
We observe that this regression tree only uses four of the variables of the RF model. We notice that observations with disposable income growth rate smaller than 0.012 are more likely to lapse.
We also notice the relevance of the Company (COMP) which acts at the second level of the tree. For example, if the disposable income growth rate is low and the policy is stipulated with Company A (COMP=1), then the probability to lapse increases considerably, reaching a 57% probability. We can conclude that, according to the selected RF model, these are the main drivers of the lapse decision.
According to our analysis, the leaf with the highest lapse probability (84.8%) is obtained with a disposable income growth rate lower (or equal) than 0.012, a policy stipulated with Company A and with time from start smaller (or equal) than 3.5 years. On the other hand, the leaf with the smallest lapse probability (5.2%) is obtained with a disposable income growth rate higher than 0.012, a policy stipulated with Company A or B, and with time to expiry smaller (or equal) than 7.5 years.
These results are interesting because all the above variables turned out to be statistically significant [2], where the same dataset is analyzed considering classical linear models, with the purpose to analyze the lapse rates with respect to major factors of lapses.
[1] Azzone, M., Barucci, E., Moncayo, G. G., & Marazzina, D. (2022). A machine learning model for lapse prediction in life insurance contracts. Expert Systems with Applications, 191, 116261. https://doi.org/10.1016/j.eswa.2021.116261
[2] Barucci, E., Colozza, T., Marazzina, D., & Rroji, E. (2020). The determinants of lapse rates in the Italian life insurance market. European Actuarial Journal, 10(1), 149-178. https://doi.org/10.1007/s13385-020-00227-0
[3] Liaw, A., & Wiener, M. (2002). Classification and regression by random Forest. R news, 2(3), 18-22. https://cogns.northwestern.edu/cbmg/LiawAndWiener2002.pdf

