
Executive Summary
Due to the Basel III new capital rules (see [5]) and also to the EBA stress test processes, the capital issue is still a very relevant topic for most of the European banks regardless of their size. To increase the capital ratios, e.g. the CET1 ratio, the banks can theoretically exploit 3 high level strategies: to gain more profits, to issue new equity instruments or to optimize their risk structure. The first two are not easy to perform because they depend from many external random factors and market conditions. The RWA optimization relies on numerous components, sometimes highly demanding, which can however be tested and implemented based on an efficient organization of internal tools and monitoring processes. In this firs part of the work we give a review of the problem, along with some empirical data end examples.
1 A short review of Basel III and EBA capital constraints
The rationale under the Basel regulation architecture is that banks must have enough capital to face risks. Hence, with a high-level definition, banks must satisfy the condition OWNFUNDS > RISKS. (The term Own Funds in the Basel III framework has replaced the previous “Regulatory Capital”)
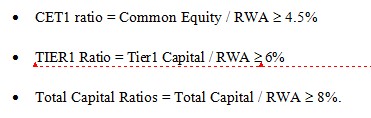
This condition is more often replaced in the regulatory architecture and in the practice by a set of conditions like
![]()
RWA is the traditional Risk Weighted Assets metric, i.e. a “transformation” of the Bank (assets) size in a combined size-risk measure.
To be more precise, the Basel III own funds requirements can be stated as follows:
Detailed rules and implementation timeliness are available in [2] and [3].
The dichotomy (RWA, RISKS) is not so clear to non-specialists. It comes from the native Basel I 1988 implementation, where by some coarse tables the credit and market exposures where converted from their accounting (asset) value to the RWA, and the well famous principle CAPITAL/RWA > 8% was stated.
Due to the 1996 Market Risk amendment and to the Basel II reform (see [4]), the internal (statistical models) models came into force, hence the risk figures for the capital adequacy are strictly derived from the quantitative models.
Nevertheless, the RWA measure unit is so useful that it has been maintained, and it is sometimes defined in the regulation starting from the substantial risk metric. Namely, RWA = RISKMEASURE × 12.5. From now on, we will use the term capital requirement (or own funds requirement) instead of risk measure.
The 12.5 coefficient is in fact the inverse of the classical 8% Basel 1 term.
The Basel III regulation also introduced new constraints, such as the liquidity indicators LCR/NSFR (Liquidity Coverage Ratio/ Net Stable Funding Ratio) and the leverage threshold.
To summarize, the new strict capital requirements, the new building blocks (such as CVA -Credit Valuation Adjustment- risk), new rules for the own funds definition implied a general capital shortfall for the banks, depicted in the figure.
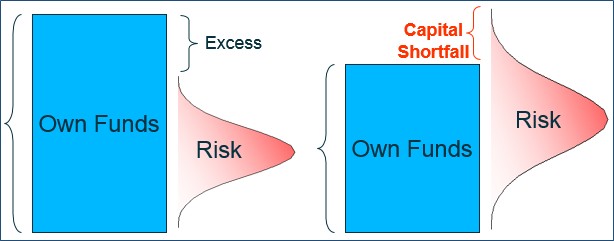
In other words, with the Basel III regulation the banks moved from a general excess capital situation to a capital shortfall.
Because of this issue the RWA optimization term is having a wide success, as the banks are trying to satisfy the regulation with any possible tool.
In this market framework, the EBA 2014 Stress Test required banks even more robust capital resilience. To perform in positively in the stress test, banks were obliged to exhibit an 8% CET1 ratio in baseline scenario, and 5.5% in the adverse one.
For the forthcoming 2016 EBA stress test, similar rules are being defined.
2 The Risk Map. General structure and empirical composition for Italian banks
We come back to the general condition OWNFUNDS > RISKS and to its more important specification, i.e. CET1 ratio = Common Equity / RWA ≥ 4.5%.
To understand the optimization challenge, some details are needed.
With respect to the optimization tools, the denominator is largely the most important term.
Here with “risks” we mean the Pillar I risks, namely credit, market and operational risk. Some other risks, such as the banking book interest rate risk, are relevant but contribute only to the Pillar II Economic Capital.
To decline the problem in a practical perspective, we show in the below table the risk map for the top 5 five Italian banks, as of 2015, June 30th (for the data preparation, the authors thank Eva Pianalto).
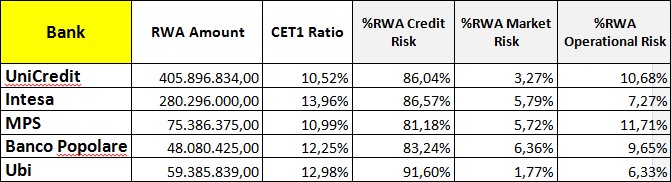
It is worth to note that credit risk is the main contributor to the total risk. Only in two banks (OpRisk + MarketRisk) exceed the 15% of the whole RWA.
This first data suggest that the optimization project must focus on the credit risk building block.
We want to point out that the different risk figures depend from the combination of three different drivers:
- The relative amount of the bank exposure to each risk. Ceteris paribus, of the bank has a bigger trading portfolio, it will show a higher RWA% for that risk
- The average risk intensity per € of exposure. Example: given the same exposure and contractual features (e.g. real estate mortgages), a portfolio with high quality rating debtors will imply a lower capital absorption.
- The risk measurement methodology. This is probably the most important but strangely the most misquoted driver. Example: the approval of the internal IRB model for the credit generally allows a bank to calculate the capital requirement K( ) with a formula that gives a significant capital relief with respect to the standard external rating based model
Coming back to the table, the different relative weight does not depend only on the size of the trading book, nor the net open risky positions, but also on the methodology used for the measurement. We recall that not all banks use internal models for the different risk classes.
We now focus further on the credit risk capital requirement, and we briefly review the internal IRB models and the formula for the requirement. In the following, RW stands for the risk weight, hence
Capital Requirement = EAD × RW
RWA = Capital Requirement × 12.5
A) Exposures to governments, financial institutions, corporates
![]()
B) Exposures to SME – small enterprises
![]()
C) Retail exposures
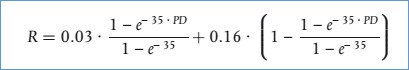
In the above formula, M represents the maturity, b and adjustment coefficient. R is the loading factor that links the single counterparty to the single risk factor of the Basel model, finally N( ) represents the normal distribution and G( ) its inverse. For details about this model see [7]. Some different rules for R, according to the counterparty sector and size, are given.
2 Which Paths for the Optimization? What Banks (should) optimize?
The RWA optimization issue is a hot problem for most of the European bankers. Many celebrated advisory companies have devoted a huge amount of research and commercial actions to it. See as clear examples [1] and [6].
Nevertheless, the problem has not been stated in a systematic form.
In the present first part of the work we avoid excessive technical details, but we recall that any optimization problem must be defined by some standard components.
- The objective function f( ) to be optimized. In this context, we can select:
- min RWA
- MAX (CET1 ratio) = MAX (OwnFunds / RWA). We observe that some “filters” for the numerator depend from some of the same inputs of the RWA quantity, hence the two formulations are not always equivalent.
- Any other strategic quantity for the bank
- The decision variables X = (x1,…, xN), i.e. the variables from which the objective function depend. These are the variables that the bank can actually move to a more convenient level. The variables in this case can be stated in numerous different ways. Examples
- X = the weight of the different exposures in the bank strategic asset allocation
- X = the amount of the collaterals for the credit risk mitigation
- X = the average maturity of the mortgages
- A set of constraints in the very general form g(X) ≤ K. Usually the optimal theoretical point is not feasible due to budget constraints, regulatory constraints, market conditions, and so on.
In this general set-up, the optimizing strategies can be categorized in the following approaches:
- Strategic asset allocation. This is a high level point. How much of the bank total assets to put in the trading book? Which leverage level for the bank? Equity trading or carry and grade with the ECB funding? Large loans with the large corporate high rating sector or diversification in the retail consumer loans?
- Credit Process efficiency and Data Quality improvement. While for market risk the RWA calculation is mainly an algorithmic task, subject to strict backtesting thresholds, in credit risk a large set of details are involved in the many calculation rules, due to product and counterparty fragmentation. Banks should therefore be rigorous in the global end-to-end calculation. Example: In Basel III a credit support factor (CSF) is prescribed for exposures to small enterprises where the annual sales are less than 1.5mln €. This CSF allows to reduce dramatically the RWA, i.e. RWA (CSF) = RWA × 0.7619. To take advantage of this rule, a bank must insert and update this variable in their database. If not, they cannot apply the CSF. Missing data is one of the key reasons of the RWA deterioration.
- Mathematical optimization. For a part of the credit exposures, we can have a (M,N) relationships between the M debtors and the N collaterals (real or personal). We can look at it as a graph. Each collateral has a fair value, with some hair-cuts rules. Each exposure has its own EAD. The allocation process is the step where each collateral is assigned for a given amount to each exposure. Among the many feasible choices, one (or some) of them can minimize the RWA.
Many people like to think that strategy (1) is the most important. But the time to implement strategic policies is very often too long with respect to some urgent capital problems.
Moreover, strategies (2) and (3) are less constrained by exogenous market events, and when eligible they can determine an improvement of the CET1 ratio of some dozens of basis points.
In the second part of this work we will develop some practical applications to highlight these points.
References
[1] Accenture (2014), “Basel III RWA Optimization: Going beyond Compliance”, Working paper.
[2] Basel Committee on Banking Supervision (2014), “Basel III summary Table”,
[3] Basel Committee on Banking Supervision (2014), “Basel III Phase-In Arrangements”,
[4] Basel Committee on Banking Supervision (2006), “Basel II: International Convergence of Capital Measurement and Capital Standards: A Revised Framework – Comprehensive Version”, BCBS paper 128,
[5] EU (2013), “Regulation (EU) No 575/2013 on prudential requirements for credit institutions and investment firms”.
[6] McKinsey (2012), “Capital Management: Banking’s new imperative”, McKinsey Working papers on Risk, n.38.
[7] Gordy M.B. (2002), “A Risk-Factor Model Foundation for Ratings-Based Bank Capital Rules”.

