The European Securities and Markets Authority (ESMA), the EU’s securities markets regulator, has submitted a response to the European Commission’s (EC) consultation on a new digital finance strategy for the European Union…
Lug
02
2020
The European Securities and Markets Authority (ESMA), the EU’s securities markets regulator, has submitted a response to the European Commission’s (EC) consultation on a new digital finance strategy for the European Union…
The Basel Committee on Banking Supervision today issued the updated version of its guidelines on Sound management of risks related to money laundering and financing of terrorism…
Corporate funding markets partially resumed after seizing up in mid-March 2020 – but at much higher spreads and with sharper sectoral differentiation…

L’indicatore di Mahalanobis permette di evidenziare periodi di stress nei mercati finanziari. Si tratta di un indicatore che dipende dalle volatilità e dalle correlazioni di un particolare universo investimenti preso ad esame. Nello specifico ci siamo occupati dei mercati azionari europei e dei settori azionari globali.
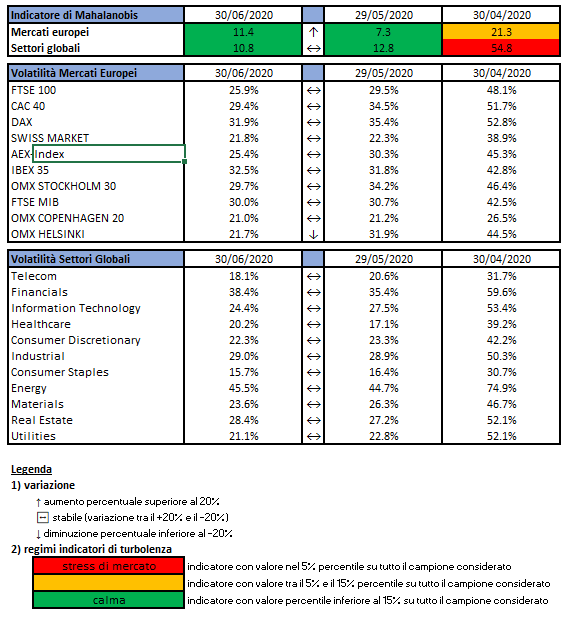
Gli indici utilizzati sono:

Le volatilità riportate sono storiche e calcolate sugli ultimi 30 trading days disponibili. Per ogni asset-class dunque sono prima calcolati i rendimenti logaritmici dei prezzi degli indici di riferimento, successivamente si procede col calcolo della deviazione standard dei rendimenti, ed infine si procede a moltiplicare la deviazione standard per il fattore di annualizzazione.
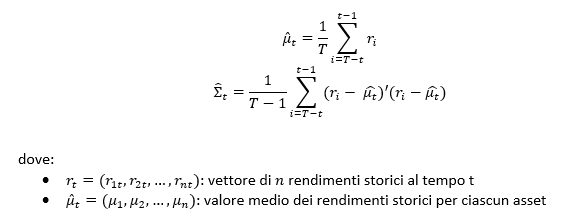
Per il calcolo della distanza di Mahalnobis si procede dapprima con la stima della matrice di covarianza tra le asset-class. Si considera l’approccio delle finestre mobili. Come con la volatilità, si procede prima con il calcolo dei rendimenti logaritmici e poi con la stima storica della matrice di covarianza, come riportato di seguito.
Supponendo una finestra mobile di T periodi, viene calcolato il valore medio e la matrice varianza covarianza al tempo t come segue:
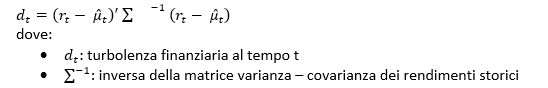
La distanza di Mahalanobis è definita formalmente come:
Le parametrizzazioni che sono state scelte sono:
Le statistiche percentili sono state calcolate a partire dalla distribuzione dell’indicatore di Mahalanobis dal Dicembre 1997 al Dicembre 2019 su rilevazioni mensili.
Ulteriori dettagli sono riportati in questo articolo.
Disclaimer: Le informazioni contenute in questa pagina sono esclusivamente a scopo informativo e per uso personale. Le informazioni possono essere modificate da finriskalert.it in qualsiasi momento e senza preavviso. Finriskalert.it non può fornire alcuna garanzia in merito all’affidabilità, completezza, esattezza ed attualità dei dati riportati e, pertanto, non assume alcuna responsabilità per qualsiasi danno legato all’uso, proprio o improprio delle informazioni contenute in questa pagina. I contenuti presenti in questa pagina non devono in alcun modo essere intesi come consigli finanziari, economici, giuridici, fiscali o di altra natura e nessuna decisione d’investimento o qualsiasi altra decisione deve essere presa unicamente sulla base di questi dati.

L’iniziativa di Finriskalert.it “Il termometro dei mercati finanziari” vuole presentare un indicatore settimanale sul grado di turbolenza/tensione dei mercati finanziari, con particolare attenzione all’Italia.
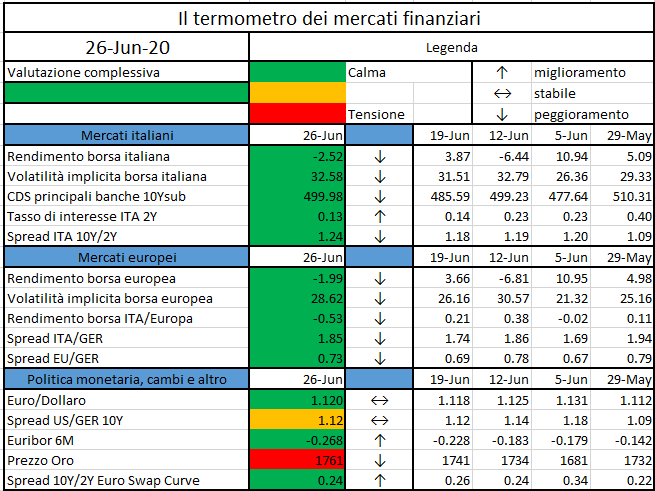
Significato degli indicatori
I colori sono assegnati in un’ottica VaR: se il valore riportato è superiore (inferiore) al quantile al 15%, il colore utilizzato è l’arancione. Se il valore riportato è superiore (inferiore) al quantile al 5% il colore utilizzato è il rosso. La banda (verso l’alto o verso il basso) viene selezionata, a seconda dell’indicatore, nella direzione dell’instabilità del mercato. I quantili vengono ricostruiti prendendo la serie storica di un anno di osservazioni: ad esempio, un valore in una casella rossa significa che appartiene al 5% dei valori meno positivi riscontrati nell’ultimo anno. Per le prime tre voci della sezione “Politica Monetaria”, le bande per definire il colore sono simmetriche (valori in positivo e in negativo). I dati riportati provengono dal database Thomson Reuters. Infine, la tendenza mostra la dinamica in atto e viene rappresentata dalle frecce: ↑,↓, ↔ indicano rispettivamente miglioramento, peggioramento, stabilità rispetto alla rilevazione precedente.
Disclaimer: Le informazioni contenute in questa pagina sono esclusivamente a scopo informativo e per uso personale. Le informazioni possono essere modificate da finriskalert.it in qualsiasi momento e senza preavviso. Finriskalert.it non può fornire alcuna garanzia in merito all’affidabilità, completezza, esattezza ed attualità dei dati riportati e, pertanto, non assume alcuna responsabilità per qualsiasi danno legato all’uso, proprio o improprio delle informazioni contenute in questa pagina. I contenuti presenti in questa pagina non devono in alcun modo essere intesi come consigli finanziari, economici, giuridici, fiscali o di altra natura e nessuna decisione d’investimento o qualsiasi altra decisione deve essere presa unicamente sulla base di questi dati.
Mutual fund giant Vanguard has completed another blockchain pilot that aims to change the risk profile of foreign exchange (FX) transactions…
Il coefficiente della riserva di capitale anticiclica (countercyclical capital buffer, CCyB) per il terzo trimestre del 2020 è fissato allo zero per cento…
https://www.bancaditalia.it/media/comunicati/documenti/2020-01/cs_26062020_CCyB-2020Q3.pdf
On 5 June 2020 the ECB announced that the Governing Council had approved the setting-up of a repo line arrangement to provide euro liquidity…
https://www.ecb.europa.eu/press/govcdec/otherdec/2020/html/ecb.gc200626~01f8790541.en.html
Amid the human tragedy and economic recession caused by the COVID-19 pandemic…

The last few years have seen significant growth in “sustainable” financial products and instruments. These products and instruments have been able to capture a growing share of saving flows globally, and particularly in Europe. The focus on the environment and social responsibility has prompted many Asset and Wealth Managers globally to accelerate the integration of ESG factors (Environmental, Social, Governance) in investment processes and operating models. The Covid-19 pandemic draw attention on “sustainability” and is an additional boost factor. Corporate decisions on human capital, social and environmental aspects will play an even greater role in the assessment of investments.
The new regulatory wave connected to the European Commission’s Sustainable Finance Action Plan is part of this context and represents the next big regulatory challenge for the financial and banking system, and in particular for the investment services industry.
One of the objectives set by the Commission in the Sustainable Finance Action Plan is, indeed, to convey private investments towards a sustainable real economy, in order to achieve the goals set out in the Paris Climate Agreement, through a series of specific regulatory interventions, that integrate each other, such as:
The compliance with the new rules currently being drawn up is expected to be challenging, with important impacts on both the business and operational model. The areas on which intermediaries will have to intervene more proactively to exploit the opportunities are, for the Asset Managers, the management of new data and, for distributors, the revision of the service model.
Data management will become an enabling factor in integrating ESG practices for Asset Managers, as well as for distributors. One of the crucial aspects is the treatment of a large non-financial dataset and the need for new tools to support both decision-making processes, risk management and monitoring processes.
Global leading Asset Managers identify the inconsistency of data between different economic sectors/assets as the main obstacle to the integration of the ESG into investment processes. ESG disclosure is essentially provided by larger companies with greater resources, with the consequence that asymmetrical disclosure can lead to conveying ESG investment flows to larger companies, even if smaller companies have a similar or better impact on society and the environment.
Advanced data analysis will become an essential component. Asset managers can leverage artificial intelligence, such as machine learning and alternative data analytics, to develop ESG metrics that are functional to investment analysis, decision making and informing investors. By aligning advanced analytics tools with sustainability metrics, Asset Managers may be able to go beyond simple screening methods and actively leverage the benefits of investing in sustainable assets.
ESG rating companies, for example, already use alternative data in their rating processes. MSCI Inc. estimates that only 35% of the data used to define a company’s ESG rating comes from a voluntary disclosures. As a result, strong growth is expected in the use of alternative data and emerging technologies to introduce quality ESG data into investment processes and identify the risks and opportunities of such investments.
For players offering Investment Advisory services, it will be essential to integrate ESG aspects into personal financial planning by introducing tools and capabilities in order to understand investor preferences, select ESG products and measure the contribution of investments to risk management, sustainability goals and how much these are capable of creating a premium in terms of overall performance.
The integration of ESG into Financial Advisory is an opportunity for distributors to seize, especially considering the following three aspects: (i) the efficiency of ESG products in terms of return, (ii) the economic environment of the coming years, which will be increasingly oriented to environmental and social issues and iii) the growing attitude of investors for sustainable investments.
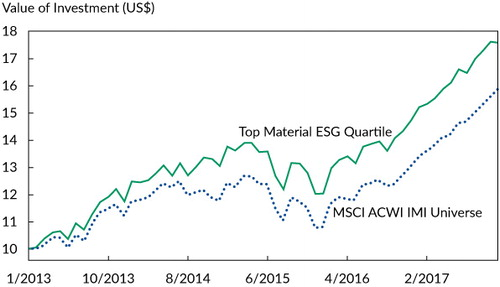
The growth of ESG, in fact, also depends on the expected return. Analysis shows that ESG metrics can actually help the search for “Alpha” (specific risk). A recent analysis tested ESG metrics and showed that a strategy that based its investment decisions solely on these metrics outperformed the performance of a global set of equities, strengthening the thesis of an active ESG investment strategy. As a result, ESG can provide real opportunities to meet customer demand and improve returns.
In the most recent period, ESG funds have shown a greater capacity to respond to volatility. Based on a comparison of returns in Q1 2020 of 206 ESG funds and ETFs and those not ESG of their respective categories, sustainable funds performed better on a relative basis.
In addition, public policies will play a role in promoting sustainable sectors and initiatives in the coming years through significant investments (e.g. the European Green Deal presented by the European Commission envisages investments in the order of EUR 1 trillion over the next 10 years).
Finally, investors show appreciation for sustainability and, as a recent Deloitte survey has shown, they are inclined to invest in these products and they expect adequate support from intermediaries.
Intermediaries will have to adopt a strategic approach to the new incoming regulatory package, in order to respond in a structured way to a growing customer demand, defining a value proposition dedicated to impact investing that goes beyond the topics, although essential, of the product and the Branding.
To seize this opportunity, intermediaries will need to work on several areas:
Products
Governance
Proposition
Several intermediaries are anticipating the trend and have initiated a review of the value proposition incorporating sustainability. In this new context, success will not only depend on offering customers the right product, but above all from communicating appropriately by providing information describing the positive impacts on environmental and social factors and the contribution of investment choices to the performance.
Authors:
– Alessandra Ceriani, Partner and DCM FSI Consulting Leader at Deloitte Consulting
– Alessandro Mastrantuono, Partner at Deloitte Consulting
– Emanuele Meo, Senior Manager at Deloitte Consulting
