The European Securities and Markets Authority (ESMA), the EU’s securities markets regulator, is launching a Common Supervisory Action (CSA)…
Il presente lavoro si propone di analizzare i profili giuridici e regolamentari di maggior rilievo con riguardo al fenomeno delle cripto-attività…
Could stablecoins be undone by a Federal Reserve that takes consumer deposits? Would retail banks be hobbled?
https://cointelegraph.com/news/does-a-fed-digital-dollar-leave-any-room-for-crypto-stablecoins

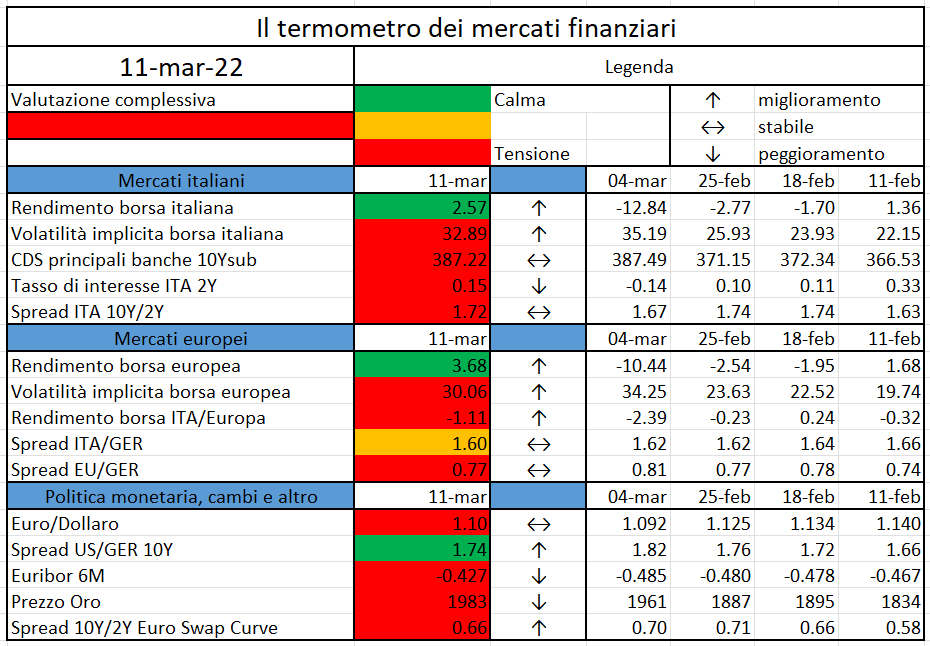
L’iniziativa di Finriskalert.it “Il termometro dei mercati finanziari” vuole presentare un indicatore settimanale sul grado di turbolenza/tensione dei mercati finanziari, con particolare attenzione all’Italia.

Significato degli indicatori
- Rendimento borsa italiana: rendimento settimanale dell’indice della borsa italiana FTSEMIB;
- Volatilità implicita borsa italiana: volatilità implicita calcolata considerando le opzioni at-the-money sul FTSEMIB a 3 mesi;
- Future borsa italiana: valore del future sul FTSEMIB;
- CDS principali banche 10Ysub: CDS medio delle obbligazioni subordinate a 10 anni delle principali banche italiane (Unicredit, Intesa San Paolo, MPS, Banco BPM);
- Tasso di interesse ITA 2Y: tasso di interesse costruito sulla curva dei BTP con scadenza a due anni;
- Spread ITA 10Y/2Y : differenza del tasso di interesse dei BTP a 10 anni e a 2 anni;
- Rendimento borsa europea: rendimento settimanale dell’indice delle borse europee Eurostoxx;
- Volatilità implicita borsa europea: volatilità implicita calcolata sulle opzioni at-the-money sull’indice Eurostoxx a scadenza 3 mesi;
- Rendimento borsa ITA/Europa: differenza tra il rendimento settimanale della borsa italiana e quello delle borse europee, calcolato sugli indici FTSEMIB e Eurostoxx;
- Spread ITA/GER: differenza tra i tassi di interesse italiani e tedeschi a 10 anni;
- Spread EU/GER: differenza media tra i tassi di interesse dei principali paesi europei (Francia, Belgio, Spagna, Italia, Olanda) e quelli tedeschi a 10 anni;
- Euro/dollaro: tasso di cambio euro/dollaro;
- Spread US/GER 10Y: spread tra i tassi di interesse degli Stati Uniti e quelli tedeschi con scadenza 10 anni;
- Prezzo Oro: quotazione dell’oro (in USD)
- Spread 10Y/2Y Euro Swap Curve: differenza del tasso della curva EURO ZONE IRS 3M a 10Y e 2Y;
- Euribor 6M: tasso euribor a 6 mesi.
I colori sono assegnati in un’ottica VaR: se il valore riportato è superiore (inferiore) al quantile al 15%, il colore utilizzato è l’arancione. Se il valore riportato è superiore (inferiore) al quantile al 5% il colore utilizzato è il rosso. La banda (verso l’alto o verso il basso) viene selezionata, a seconda dell’indicatore, nella direzione dell’instabilità del mercato. I quantili vengono ricostruiti prendendo la serie storica di un anno di osservazioni: ad esempio, un valore in una casella rossa significa che appartiene al 5% dei valori meno positivi riscontrati nell’ultimo anno. Per le prime tre voci della sezione “Politica Monetaria”, le bande per definire il colore sono simmetriche (valori in positivo e in negativo). I dati riportati provengono dal database Thomson Reuters. Infine, la tendenza mostra la dinamica in atto e viene rappresentata dalle frecce: ↑,↓, ↔ indicano rispettivamente miglioramento, peggioramento, stabilità rispetto alla rilevazione precedente.
Disclaimer: Le informazioni contenute in questa pagina sono esclusivamente a scopo informativo e per uso personale. Le informazioni possono essere modificate da finriskalert.it in qualsiasi momento e senza preavviso. Finriskalert.it non può fornire alcuna garanzia in merito all’affidabilità, completezza, esattezza ed attualità dei dati riportati e, pertanto, non assume alcuna responsabilità per qualsiasi danno legato all’uso, proprio o improprio delle informazioni contenute in questa pagina. I contenuti presenti in questa pagina non devono in alcun modo essere intesi come consigli finanziari, economici, giuridici, fiscali o di altra natura e nessuna decisione d’investimento o qualsiasi altra decisione deve essere presa unicamente sulla base di questi dati.
The review of the PRIIPs Regulation is part of the European Commission’s upcoming strategy for retail investments in Europe, which aims to ensure that retail investors can take full advantage of capital markets and that rules are coherent across legal instruments…
https://www.esma.europa.eu/press-news/hearings/esa-public-hearing-review-priips-regulation
Lo IOSCO ha pubblicato un rapporto sul settore dei fondi di investimento e sui potenziali rischi sistemici di questo settore per il sistema finanziario internazionale…
https://www.dirittobancario.it/art/fondi-dinvestimento-pubblicato-il-rapporto-iosco/
The decentralized finance (DeFi) sector is easily one the most potent and promising parts of the world’s growing finance industry…
https://www.newsbtc.com/news/company/defi-3-0-a-pathway-forward/
The latest “death cross” on the Bitcoin daily chart is swept aside in favor of buy-in signals and an “eventual” surge towards $50,000…

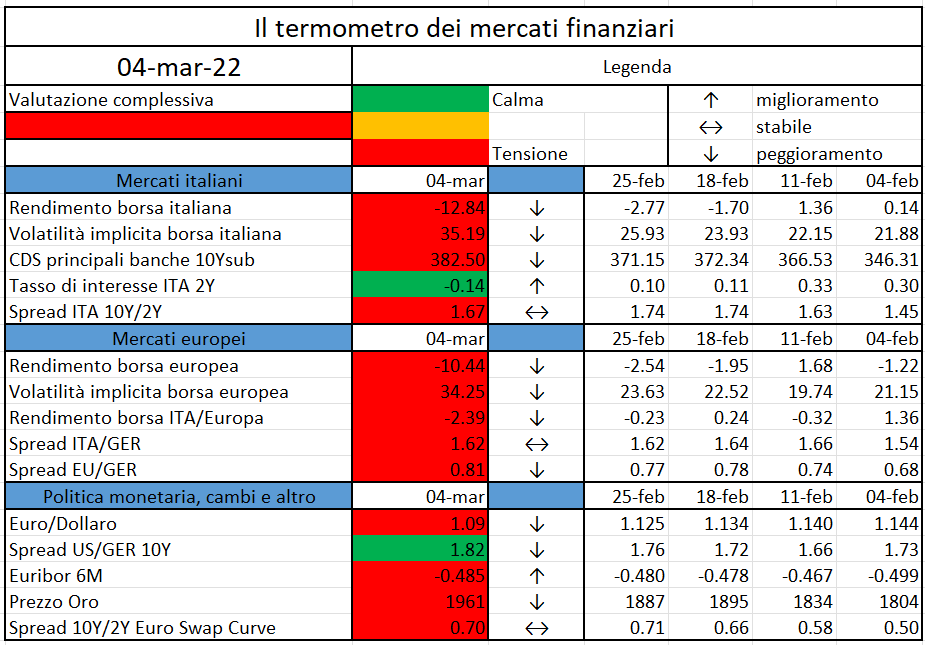
L’iniziativa di Finriskalert.it “Il termometro dei mercati finanziari” vuole presentare un indicatore settimanale sul grado di turbolenza/tensione dei mercati finanziari, con particolare attenzione all’Italia.

Significato degli indicatori
- Rendimento borsa italiana: rendimento settimanale dell’indice della borsa italiana FTSEMIB;
- Volatilità implicita borsa italiana: volatilità implicita calcolata considerando le opzioni at-the-money sul FTSEMIB a 3 mesi;
- Future borsa italiana: valore del future sul FTSEMIB;
- CDS principali banche 10Ysub: CDS medio delle obbligazioni subordinate a 10 anni delle principali banche italiane (Unicredit, Intesa San Paolo, MPS, Banco BPM);
- Tasso di interesse ITA 2Y: tasso di interesse costruito sulla curva dei BTP con scadenza a due anni;
- Spread ITA 10Y/2Y : differenza del tasso di interesse dei BTP a 10 anni e a 2 anni;
- Rendimento borsa europea: rendimento settimanale dell’indice delle borse europee Eurostoxx;
- Volatilità implicita borsa europea: volatilità implicita calcolata sulle opzioni at-the-money sull’indice Eurostoxx a scadenza 3 mesi;
- Rendimento borsa ITA/Europa: differenza tra il rendimento settimanale della borsa italiana e quello delle borse europee, calcolato sugli indici FTSEMIB e Eurostoxx;
- Spread ITA/GER: differenza tra i tassi di interesse italiani e tedeschi a 10 anni;
- Spread EU/GER: differenza media tra i tassi di interesse dei principali paesi europei (Francia, Belgio, Spagna, Italia, Olanda) e quelli tedeschi a 10 anni;
- Euro/dollaro: tasso di cambio euro/dollaro;
- Spread US/GER 10Y: spread tra i tassi di interesse degli Stati Uniti e quelli tedeschi con scadenza 10 anni;
- Prezzo Oro: quotazione dell’oro (in USD)
- Spread 10Y/2Y Euro Swap Curve: differenza del tasso della curva EURO ZONE IRS 3M a 10Y e 2Y;
- Euribor 6M: tasso euribor a 6 mesi.
I colori sono assegnati in un’ottica VaR: se il valore riportato è superiore (inferiore) al quantile al 15%, il colore utilizzato è l’arancione. Se il valore riportato è superiore (inferiore) al quantile al 5% il colore utilizzato è il rosso. La banda (verso l’alto o verso il basso) viene selezionata, a seconda dell’indicatore, nella direzione dell’instabilità del mercato. I quantili vengono ricostruiti prendendo la serie storica di un anno di osservazioni: ad esempio, un valore in una casella rossa significa che appartiene al 5% dei valori meno positivi riscontrati nell’ultimo anno. Per le prime tre voci della sezione “Politica Monetaria”, le bande per definire il colore sono simmetriche (valori in positivo e in negativo). I dati riportati provengono dal database Thomson Reuters. Infine, la tendenza mostra la dinamica in atto e viene rappresentata dalle frecce: ↑,↓, ↔ indicano rispettivamente miglioramento, peggioramento, stabilità rispetto alla rilevazione precedente.
Disclaimer: Le informazioni contenute in questa pagina sono esclusivamente a scopo informativo e per uso personale. Le informazioni possono essere modificate da finriskalert.it in qualsiasi momento e senza preavviso. Finriskalert.it non può fornire alcuna garanzia in merito all’affidabilità, completezza, esattezza ed attualità dei dati riportati e, pertanto, non assume alcuna responsabilità per qualsiasi danno legato all’uso, proprio o improprio delle informazioni contenute in questa pagina. I contenuti presenti in questa pagina non devono in alcun modo essere intesi come consigli finanziari, economici, giuridici, fiscali o di altra natura e nessuna decisione d’investimento o qualsiasi altra decisione deve essere presa unicamente sulla base di questi dati.

Constant Weight Strategy (CWS) and POrtfolio Insurance Strategy (POIS) represent the two most popular trading strategies in financial markets. In recent years, many institutional investors started to adopt POIS. The rationale goes to the features of financial products managed for customers, i.e. with profit/traditional insurance policies, or to the need of introducing protection on asset under management with a stop-loss approach. The effects of these strategies on the market have been investigated but no result exists on their capability to outperform traditional CWS and therefore to populate the market in the long run.
In a recent work with Emilio Barucci and Pietro Dindo [1] we have analyzed the evolution of a financial market populated by traders adopting a CWS and POIS, considering an endogenous price as the result of the equilibrium in the market populated by the two classes of agents.
A CWS is such that the trader at any time splits her wealth in the assets (risky and risk free) according to time and wealth invariant weights. This strategy shows very nice properties: it is the solution of the intertemporal optimal investment/consumption problem assuming a power utility function and that the assets evolve according to geometric Brownian motions in continuous time (Merton problem [2]); moreover, considering an exogenous asset price dynamics (e.g. Black & Scholes or binomial model), this trading strategy turns out to be contrarian: the trader should sell the risky asset as the price goes up and should buy it as the risk asset price declines. Lastly, when the investment fractions are provided by the expected dividends/coupons of the assets, such a strategy coincides with the so-called Generalized Kelly Strategy (see [3] for a survey on the properties of this rule).
We specify the POIS as a Constant Proportion Portfolio Insurance (CPPI) strategy. According to this strategy, a floor (time varying threshold) is identified: if the wealth touches the threshold from above, then the investment in the risky asset is set to zero, otherwise it is provided by a constant proportion of the cushion (difference between the wealth and the floor). Notice that this strategy can be rationalized assuming that the agent solves the classical Merton problem with a lower bound on consumption [4]. Notice that, assuming an exogenous asset price dynamics, a CPPI strategy is a momentum or trend follower strategy (buy when the asset increases and sell when the asset price decreases).
In the papers we have shown that the long run outcome depends both on which strategy invests the most in the risky asset and on the risky asset dividend growth rate. In the most plausible case, that is, when the POIS invests more in the risky asset than the CWS conditional on the wealth being above the floor, we have shown that path dependency (i.e., dominance of one of the two classes of agents on different paths of realized states of the world) arises when the expected return of the risky asset is high enough (strong fundamentals). This outcome is due to the fact that the POIS invests or not in the risky asset depending on past performance. If dividends realizations are such that past performance is weak, then the POIS exits from investing in the risky asset and the CWS dominates in the long run. The opposite occurs in case dividend realizations are such that past performance is strong. In case of intermediate dividend growth rates the POIS may vanish (and the CWS dominates) on almost all paths while for low dividend growth rates both strategies may survive.
We have also shown that the relationship between market homogeneity/heterogeneity and volatility depends on the type of homogeneous agent dominating the market. If agents adopt a CWS, then the market volatility is higher than in case of a market with heterogeneous traders. If agents adopt a POIS, then the market volatility is lower than in case of a market with heterogeneous traders. This result confirms that portfolio insurers play a stabilizing role in the market.
Bibliography
[1] Barucci, E., Dindo, P. and Grassetti, F., Portfolio insurers and constant weight traders: who will survive?, Quantitative Finance, 2021, 21(12).
[2] Merton, R., Optimum consumption and portfolio rules in a continuous time model. Journal of Economic Theory, 1971, 3.
[3] Evstigneev, I., Hens, T. and Schenk-Hoppé, K., Evolutionary finance. In Handbook of Financial Markets: Dynamics and Evolution, Handbooks in Economics Series, edited by T. Hens and K. Schenk-Hoppé, 2009 (North-Holland: Amsterdam).
[4] Dybvig, P., Dusenberry’s ratcheting of consumption: Optimal dynamic consumption and investment given intolerance for any decline in standard of living. Review of Economic Studies, 1995, 62.