The European Insurance and Occupational Pensions Authority (EIOPA) published today its December Financial Stability Report that sheds light on the financial stability risks in the European insurance and pension sector…
Gen
02
2021
The European Insurance and Occupational Pensions Authority (EIOPA) published today its December Financial Stability Report that sheds light on the financial stability risks in the European insurance and pension sector…

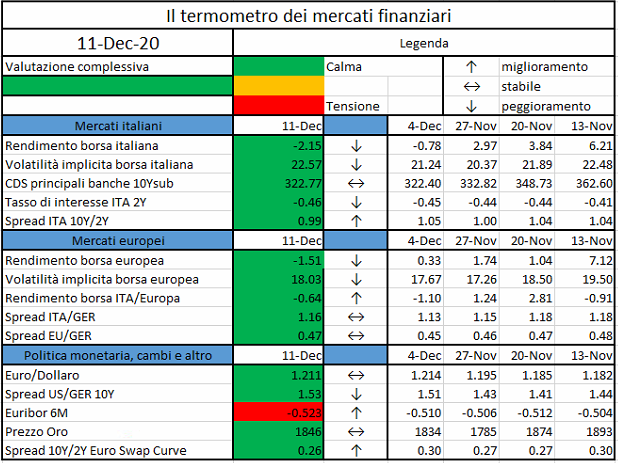
L’iniziativa di Finriskalert.it “Il termometro dei mercati finanziari” vuole presentare un indicatore settimanale sul grado di turbolenza/tensione dei mercati finanziari, con particolare attenzione all’Italia.
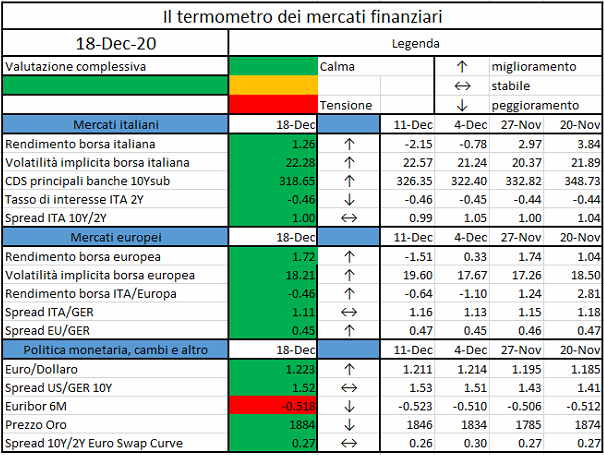
Significato degli indicatori
I colori sono assegnati in un’ottica VaR: se il valore riportato è superiore (inferiore) al quantile al 15%, il colore utilizzato è l’arancione. Se il valore riportato è superiore (inferiore) al quantile al 5% il colore utilizzato è il rosso. La banda (verso l’alto o verso il basso) viene selezionata, a seconda dell’indicatore, nella direzione dell’instabilità del mercato. I quantili vengono ricostruiti prendendo la serie storica di un anno di osservazioni: ad esempio, un valore in una casella rossa significa che appartiene al 5% dei valori meno positivi riscontrati nell’ultimo anno. Per le prime tre voci della sezione “Politica Monetaria”, le bande per definire il colore sono simmetriche (valori in positivo e in negativo). I dati riportati provengono dal database Thomson Reuters. Infine, la tendenza mostra la dinamica in atto e viene rappresentata dalle frecce: ↑,↓, ↔ indicano rispettivamente miglioramento, peggioramento, stabilità rispetto alla rilevazione precedente.
Disclaimer: Le informazioni contenute in questa pagina sono esclusivamente a scopo informativo e per uso personale. Le informazioni possono essere modificate da finriskalert.it in qualsiasi momento e senza preavviso. Finriskalert.it non può fornire alcuna garanzia in merito all’affidabilità, completezza, esattezza ed attualità dei dati riportati e, pertanto, non assume alcuna responsabilità per qualsiasi danno legato all’uso, proprio o improprio delle informazioni contenute in questa pagina. I contenuti presenti in questa pagina non devono in alcun modo essere intesi come consigli finanziari, economici, giuridici, fiscali o di altra natura e nessuna decisione d’investimento o qualsiasi altra decisione deve essere presa unicamente sulla base di questi dati.

Digital banking can no more be considered a new topic, or a disruptive innovation adopted by some first movers. It is something already in place and well developed since 2008/2010. Its presence in everyday life has become more and more commonplace and today is unconceivable to consider a financial offer complete without an ancillary online service.
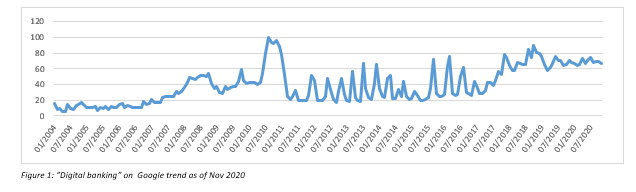
Global digital banking market is expected to raise up to $ 9 bln in 2026 with a growth CAGR of 16% (Research and Markets, 2020) during this forecasted period, also fostered by always new and efficient technologies and a more digitalized population. It is undoubted that this structural change brought more efficiency, less fixed costs, simpler access to banking services and a faster response to clients’ needs, only to mention main points. Digital banking is also spreading in other sectors such as telephony, smart-clock and assurance looking for a 360° service for always interconnected clients.
Europe follows this global trend showing a penetration of online banking generally quite high with an average of apx. 60% over total population, which is deemed to growth in future years, as well as an increase in cashless payments both through PCs and smartphones.
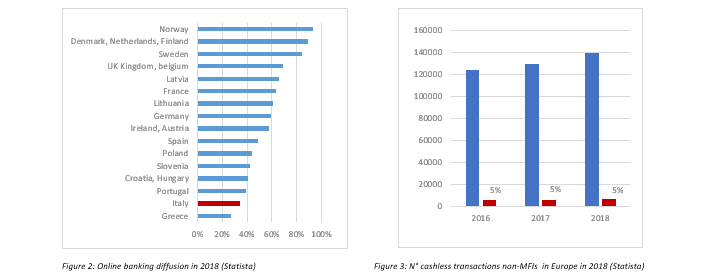
Within this evolving environment, Italy represents and unusual case being on one side one of the lowest-ranking country in terms of online banking utilization (34%) and cashless payment systems (apx. 6 thousand transactions pro-capite compared to the more than 20 thousand of UK and France) while on the other side a good incubator with Fineco (1999), CheBanca! (2008), Hellobank! and Widiba (2013), Hype (2015) and Illimity Bank (2018). All these institutes are successful bets with actual clients, in the case of Fineco fox example, accounting for more than 1,5 mln of deposits in 2019.
Digital innovation appears, therefore, to be well developed but sort of unable to complete the re-shaping of banking sector within the country. Barriers can be justified both by a population which is basically quite old (46 years old (Istituto nazionale di statistica, 2020)) and an expected fear of the change but also by some structural characteristics of the economic and social fabric which do not completely fit Italian system with a total digitalized solution.
More than in other European developed countries, the growth and evolution of Italy showed a different path among areas, with relevant discrepancies.
Italian economic environment is mainly composed by small-medium companies (SME) which accounts for apx. 80% of overall workers and apx. 90% of total companies (IlSole24Ore, 2019). Their contribution to GDP is far more relevant than in any other European country and by far more rooted with no short-term indication of change in act.
Strictly derived from past heritage, this configuration is still extremely actual and represents a significant part of Italian culture. SMEs’ role, particularly relevant above all in the Southern Regions, is also connected to the G.D.O. supply chain and big companies representing their fundamental and main contributor.
Different economies’ maturation among areas as well as country’s geographic configuration together with very differentiated level of services (first of all internet access) and richness level brought a coexistence of big and industrialized metropolis such as Milan, Turin and Rome and a constellation of small-medium cities based on a local and personalized economic fabric.
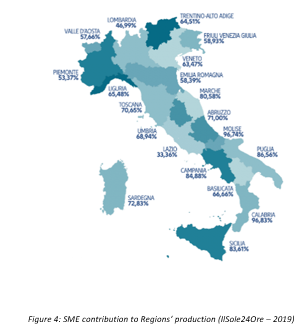
As represented in the chart above, in many Regions the economic environment is almost all composed by small merchants, companies with less than 20 employees or freelancers without any presence of big or international companies. This kind of environment tends to be less reactive to changes and above all greatly based on previous years habits. On the other side, international cities are directly in touch with new and disruptive shifts and, in a sort of way, aim to them.
As a direct consequence, level of internet connection and digitalization is greatly different within the country. According to the Digital Economy and Society Index (DESI) results for 2018:
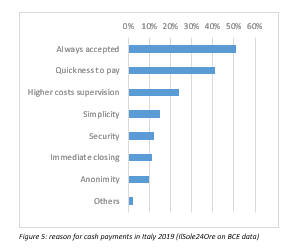
Another relevant and directly connected feature of this system is the excessive use of cash payments. Apx. 86% of population prefers to use cash for payments while for credit cards it remains only the residual 14% (Conte, 2019). If it is true that cash payments are far more related to small-medium value transactions, it has also to be noted that the annum pro-capite number of transactions with digital systems in Italy is 50.7 which differs a lot from the European average of 117.
Interesting to fully understand actual system are the reasons reported to sustain cash payments according to a panel of more than 5 thousand of Italian contributors.
Going through the different motivations here reported, it is possible to assess that some of them can be managed with recent technology innovations such as payments through smartphones which are becoming more and more easy and secure thanks to the facial recognition or the quickness to pay through an electronic devices without any signature needed.
Reasons addicted are clearly a further indication of a lack of financial digital education but also a clear reference on how current system is based on trust between contractors and simplicity.
Relatively small and self-consistent economic systems rely greatly on personalization and resilience. Digitalization and money dematerialization appear complex services for SME which mainly demand for:
Direct and strict relationship with local bank workers is considered a value added to the services even if the time to access them is a bit longer.
All these characteristics do not let digital banking be less innovative or less central to the future of the system but can partially explain its different propagation.
Digital banking is the future and this fact is well known, by all insiders and not. Technology infrastructures, economic systems maturity and level of financial education are potentially not completely ready to sustain and foster this change.
A flexible approach for the change’s introduction in some areas could be beneficial and could also allow banks to exploit some potentialities still running.
In terms of technology, instead of proposing a completely digitalized solution without any human contact, it is possible to introduce a hybrid solution where digital can be an enhancement of physical offices. Automations useful to offer basic services like ATM withdrawals/deposits, basic loan requests or modifications to bank account information open 24/7.
Regarding physical bank offices, which represents a relevant fixed cost and can produce a limited marginality, some new solutions already in place abroad are banking hubs: cohabitation of multiple banks in the same building where co-investments can be done.
Rejuvenation of the population surely assure digital services providers a continuous growth of future customers but, above all in quite old countries such as Italy, the other portion of the population, which is also the high-income one, must be considered. At least now and in the short-term.
Considering all these points, it cannot be assumed that Italy is on delay on the digitalization process. It probably is at the correct status respect the actual environment on which the change process is taking place. To force it to speed-up or to blindly concentrate all effort in this direction disregarding potential source of profits could not be economical.
Adriana Capasso, “Nel 2020, la diffusione delle banche digitali raggiunge nuove vette in Italia”, Mobile Transaction, 2020
Jalpa Shah, “How Should Banks Approach Their Digital Banking Journey?”, Finextra – Blog, 2019
Statista, “Online banking penetration in selected European markets in 2018”, 2019
Statista, “Number of payment transactions involving non-MFIs per country in Europe in 2018”, 2019
Infodata, “Pmi, quanto conta in Italia il 92% delle aziende attive sul territorio?”, IlSole24Ore, 2019
Alessandro Graziani, “Il digitale cambia il modo di fare banca, ma le filiali resteranno ancora al centro”, IlSole24Ore, 2020
Roberto Ferrari, “Banche digitali 2020, molti clienti ma pochi ricavi. Ecco che cosa le aspetta”, Digital360, 2020
Alessandra Puato, “Banche, 5 miliardi per correre sul digitale”, ABI Lab, 2020
Global Digital Banking Platform Market By Component (Solution and Services), By Deployment Type (On-premise and Cloud), By Type (Retail Banking and Corporate Banking), By Banking Mode (Online Banking and Mobile Banking), By Region, Industry Analysis and Forecast, 2020 – 2026, Research and markets, 2020
Francesco Olivanti, “DESI regionale 2019: l’Italia digitale è divisa in due e lontana dalla Ue”, Digital 360, 2020
Marco Lo Conte, “Il contante piace ancora a sei italiani su 7. Ecco la mossa che può stravolgere i comportamenti”, IlSole24ore, 2019
The Financial Crimes Enforcement Network (FinCEN), the top financial crimes watchdog within the U.S. Treasury Department, is hiring two policy officers to help draft regulations for the cryptocurrency space…
At the UBS European Conference today Governor Knot spoke about the economic outlook as we have entered the second wave of the pandemic. Next, he drew lessons for the policy response based on crisis experiences…
DTCC Data Repository (Ireland) PLC is based in Ireland and this registration is part of the DTCC Group strategy to ensure it continues to offer services to EU clients after the end of the transition period…
The financial industry is undergoing rapid technological change…
L’iniziativa di Finriskalert.it “Il termometro dei mercati finanziari” vuole presentare un indicatore settimanale sul grado di turbolenza/tensione dei mercati finanziari, con particolare attenzione all’Italia.
Significato degli indicatori
I colori sono assegnati in un’ottica VaR: se il valore riportato è superiore (inferiore) al quantile al 15%, il colore utilizzato è l’arancione. Se il valore riportato è superiore (inferiore) al quantile al 5% il colore utilizzato è il rosso. La banda (verso l’alto o verso il basso) viene selezionata, a seconda dell’indicatore, nella direzione dell’instabilità del mercato. I quantili vengono ricostruiti prendendo la serie storica di un anno di osservazioni: ad esempio, un valore in una casella rossa significa che appartiene al 5% dei valori meno positivi riscontrati nell’ultimo anno. Per le prime tre voci della sezione “Politica Monetaria”, le bande per definire il colore sono simmetriche (valori in positivo e in negativo). I dati riportati provengono dal database Thomson Reuters. Infine, la tendenza mostra la dinamica in atto e viene rappresentata dalle frecce: ↑,↓, ↔ indicano rispettivamente miglioramento, peggioramento, stabilità rispetto alla rilevazione precedente.
Disclaimer: Le informazioni contenute in questa pagina sono esclusivamente a scopo informativo e per uso personale. Le informazioni possono essere modificate da finriskalert.it in qualsiasi momento e senza preavviso. Finriskalert.it non può fornire alcuna garanzia in merito all’affidabilità, completezza, esattezza ed attualità dei dati riportati e, pertanto, non assume alcuna responsabilità per qualsiasi danno legato all’uso, proprio o improprio delle informazioni contenute in questa pagina. I contenuti presenti in questa pagina non devono in alcun modo essere intesi come consigli finanziari, economici, giuridici, fiscali o di altra natura e nessuna decisione d’investimento o qualsiasi altra decisione deve essere presa unicamente sulla base di questi dati.

EIOPA has recently (05.11.2020) published the risk dashboard (RDB) update as of October 2020.
The RDB is published on a quarterly basis, showing the level of risk for 8 (=7+1) risk categories. The latest outcome is reported in the table below, compared to the previous one (July 2020):
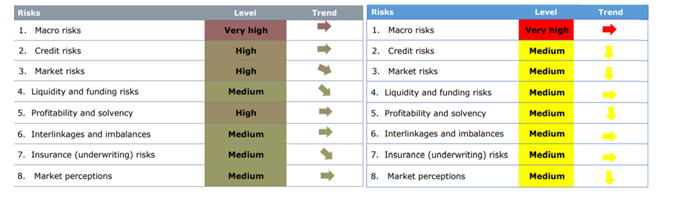
Some comments
This is an overarching category affecting the whole economy, which considers economic growth, monetary policies, consumer price indices and fiscal balances. The ongoing pandemic of COVID-19 is affecting the macroeconomic outlook, which remains at a very high level of risk. The occurrence of a second wave of the pandemic in the EU is expected to take a toll on the economic growth forecast for 20Q4, which remains negative at -4.3% (cross-country weighted average). The EU GDP is expected to recover in 21Q2, even if with less growth than the global average.
The consumer price index inflation remains well under the ECB target; an upward movement in 20Q3 is expected to be offset by a downward correction in 20Q4. Overall, the forecast for the average inflation on the next four quarters stands at 0.48%. The 10-year swap rates decline further, with all currencies experiencing a flattening on the long end. The indicator considered by EIOPA, defined as a weighted average of rates for EUR, GBP, CHF and USD sets a new low record of -0.06%. The pandemic forced governments to introduce fiscal measures to support the economy; this is expected to worsen the fiscal balance across all countries and particularly for UK and US. The central banks’ balance sheet expanded significantly (+43% w.r.t previous quarter) due to their accommodative monetary policies. After rising significantly last April 2020, the unemployment rate stabilized at the end of the second quarter.
This category measures the vulnerability to the credit risk by looking at the relevant credit asset classes exposures combined with the associated metrics (e.g. government securities and credit spreads on sovereigns).
After skyrocketing in March 2020, the CDS spreads decreased significantly in June and this trend has continued in September, albeit with less vigour; the CDS spread level is still above the pre-pandemic situation. The average credit quality step of investments remains stable (1.83; +0.08), still corresponding to an S&P rating between A and AA.
The exposures of the Insurers in different asset classes remain quite stable and around
This vulnerability of the insurance sector to adverse developments is evaluated based on the investment exposures, while the current level of riskiness is evaluated based on the volatility of the yields together with the difference between the investment returns and the guaranteed interest rates. The financial markets has stabilized after the high level of volatility of March, and hence the market risk has decreased to a medium level, even though the economic outlook remains uncertain. The volatility of bonds, the largest asset class (61% of exposure), continues decreasing, reaching levels below the pre-pandemic situation; the equity market (5.3%) volatility has declined too, even though it has not yet reached the pre-pandemic levels. The volatility in property investments (3% exposure) remains stable.
The vulnerability to liquidity shock is monitored measuring the lapse rate, the holding in cash and the issuance of catastrophe bonds (low volumes or high spreads correspond to a reduction in the demand which could form a risk). The median liquid assets ratio is stable at 66.7%; the issued bond volumes has increased sharply (9bln euro, +5bln), and the average ratio of coupons to maturity has increased as well. Lapse rates in life business are based on annual data, and hence do not yet incorporate the effects of the pandemic; the 19Q4 value shows an increase in the median lapse rate to 3%; a further increase is expected due to the impact of the outbreak of COVID-19.
The solvency level is measured via SCR and quality of OF, while the profitability via return on investments and combined ratio for the life and non-life sectors. Solvency positions improved slightly in 20Q2, while remaining below 19Q4 levels. In particular, SCR ratios for groups increased, while for non-life undertakings it remained almost unchanged; for life companies, the median of SCR ratio declined by 6.6 p.p. to 222%; it is also worth noticing that the distribution has widened, showing a more heterogeneous situation with respect to the pre-pandemic state. Profitability indicators show a deterioration in the first half of 2020.
Interlinkages are assessed between primary insurers and reinsurers, insurance and banking sector and among the derivative holdings. The exposure towards domestic sovereign debt is considered as well. The risk remains at medium level: the median of premiums ceded to reinsurers has slightly increased, while investments in banks, insurances and other financial institutions remain almost unchanged, as did the investments in domestic sovereign debt.
Indicators for insurance risks are gross written premia, claims and losses due to natural catastrophes. The life premium growth rate has plunged to negative values due to the severe impact of the pandemic. Non-life premium growth has reported a slight decrease as well, despite remaining positive. The median exposure of the loss ratio decreases by 1.6 p.p. to 62.6%, likely due to a reduced number of claims incurred during the lockdowns imposed by several EU countries. The catastrophe loss ratio (10.7%) remains at the same level of the previous quarter.
The market perception’s risk settles at medium level, with a decreasing trend. The quantities assessed are relative stock market performances (insurance stocks has outperformed the Stoxx 600 both in life and non-life segments), price to earnings ratio (increased from the previous assessment: median 11.4%), CDS spreads (median value stable 51%) and external rating outlooks (where negative changes in rating has exceeded the number of positive changes).
DBS Bank of Singapore has officially announced the arrival of its digital assets exchange, with trading to start next week…
https://www.coindesk.com/dbs-banks-digital-exchange-to-begin-trading-crypto-next-week
