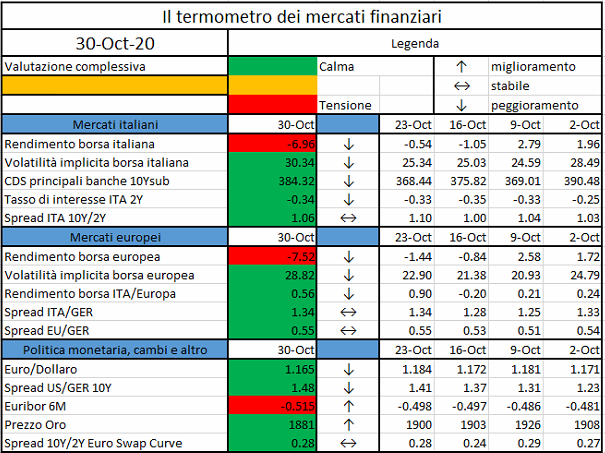
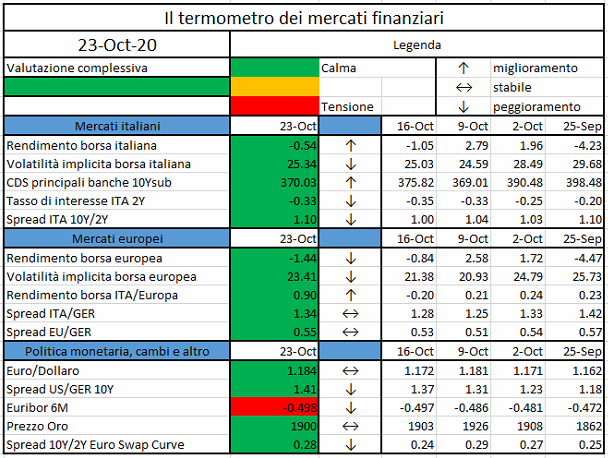
L’iniziativa di Finriskalert.it “Il termometro dei mercati finanziari” vuole presentare un indicatore settimanale sul grado di turbolenza/tensione dei mercati finanziari, con particolare attenzione all’Italia.
Significato degli indicatori
Rendimento borsa italiana: rendimento settimanale dell’indice della borsa italiana FTSEMIB;
Volatilità implicita borsa italiana: volatilità implicita calcolata considerando le opzioni at-the-money sul FTSEMIB a 3 mesi;
Future borsa italiana: valore del future sul FTSEMIB;
CDS principali banche 10Ysub: CDS medio delle obbligazioni subordinate a 10 anni delle principali banche italiane (Unicredit, Intesa San Paolo, MPS, Banco BPM);
Tasso di interesse ITA 2Y: tasso di interesse costruito sulla curva dei BTP con scadenza a due anni;
Spread ITA 10Y/2Y : differenza del tasso di interesse dei BTP a 10 anni e a 2 anni;
Rendimento borsa europea: rendimento settimanale dell’indice delle borse europee Eurostoxx;
Volatilità implicita borsa europea: volatilità implicita calcolata sulle opzioni at-the-money sull’indice Eurostoxx a scadenza 3 mesi;
Rendimento borsa ITA/Europa: differenza tra il rendimento settimanale della borsa italiana e quello delle borse europee, calcolato sugli indici FTSEMIB e Eurostoxx;
Spread ITA/GER: differenza tra i tassi di interesse italiani e tedeschi a 10 anni;
Spread EU/GER: differenza media tra i tassi di interesse dei principali paesi europei (Francia, Belgio, Spagna, Italia, Olanda) e quelli tedeschi a 10 anni;
Euro/dollaro: tasso di cambio euro/dollaro;
Spread US/GER 10Y: spread tra i tassi di interesse degli Stati Uniti e quelli tedeschi con scadenza 10 anni;
Prezzo Oro: quotazione dell’oro (in USD)
Spread 10Y/2Y Euro Swap Curve: differenza del tasso della curva EURO ZONE IRS 3M a 10Y e 2Y;
Euribor 6M: tasso euribor a 6 mesi.
I colori sono assegnati in un’ottica VaR: se il valore riportato è superiore (inferiore) al quantile al 15%, il colore utilizzato è l’arancione. Se il valore riportato è superiore (inferiore) al quantile al 5% il colore utilizzato è il rosso. La banda (verso l’alto o verso il basso) viene selezionata, a seconda dell’indicatore, nella direzione dell’instabilità del mercato. I quantili vengono ricostruiti prendendo la serie storica di un anno di osservazioni: ad esempio, un valore in una casella rossa significa che appartiene al 5% dei valori meno positivi riscontrati nell’ultimo anno. Per le prime tre voci della sezione “Politica Monetaria”, le bande per definire il colore sono simmetriche (valori in positivo e in negativo). I dati riportati provengono dal database Thomson Reuters. Infine, la tendenza mostra la dinamica in atto e viene rappresentata dalle frecce: ↑,↓, ↔ indicano rispettivamente miglioramento, peggioramento, stabilità rispetto alla rilevazione precedente.
Disclaimer: Le informazioni contenute in questa pagina sono esclusivamente a scopo informativo e per uso personale. Le informazioni possono essere modificate da finriskalert.it in qualsiasi momento e senza preavviso. Finriskalert.it non può fornire alcuna garanzia in merito all’affidabilità, completezza, esattezza ed attualità dei dati riportati e, pertanto, non assume alcuna responsabilità per qualsiasi danno legato all’uso, proprio o improprio delle informazioni contenute in questa pagina. I contenuti presenti in questa pagina non devono in alcun modo essere intesi come consigli finanziari, economici, giuridici, fiscali o di altra natura e nessuna decisione d’investimento o qualsiasi altra decisione deve essere presa unicamente sulla base di questi dati.
Switching-on TVs, radios, websites and reading newspapers worldwide in the last month the first news has been the COVID-19.
According to the World Health Organization the Coronavirus disease (COVID-19 the abbreviation) is an infectious disease caused by a newly discovered coronavirus.
The best way to prevent and slow down transmission is be well informed about the COVID-19 virus, the disease it causes and how it spreads. Protect ourselves and others from infection by washing your hands or using an alcohol based rub frequently and not touching your face…
Prevent and slow down transmission are the key elements to stop the pandemic that in this moment, according to the Center for Systems Science and Engineering (CSSE) at Johns Hopkins University, has more than 5 million of confirmed cases and nearly 400 thousand victims in the world.
Beside the human tragedy the greatest implications of this virus are the financial ones: since Wuhan lockdown (23th of January 2020) the MSCI World Index[1] of global stocks lost more than the 15% while the US Treasury bond yield lost more than 1 point. Financial shortage for all size firms and workers, rather than the uncertainty for the so called Phase 2 (the lockdown end) and the recovery phase are characterizing this period and are in the middle of the economic and political debate with a focus on the central banks strategies and provisions.
In Europe, in particular, there is a huge debate – sometimes fed for political purpose – on the instrument to avoid the economic shortage of the member countries and organize a sort of Marshall Plan to recover from the financial and economic consequences of the pandemic.
One of the instrument that could bring together the different positions is the Repurchase Agreement. The open repo (a repo without a specified end-date) can provide immediately liquidity to the European Countries posting as collateral bonds issued by themselves, leaving the reverse exchange of liquidity vs collateral (the end of the contract) in a second phase that will be agreed in accordance at the evolution of the pandemic situation.
Repo Market is the short term for Repurchase Agreement Market. A borrower of cash sells securities (the collateral) to the lender and agrees to buy them back later at a pre-specified price. Typical borrowers of cash are asset managers, pension funds, banks and insurance companies. Typical lenders of cash are money market funds and corporate treasurers. A repurchase agreement is a form of short-term borrowing for dealers in government securities. In the case of a repo, a dealer sells government securities to investors, usually on an overnight basis, and buys them back the following day at a slightly higher price. That small difference in price is the implicit overnight interest rate. Repos are typically used to raise short-term capital and they are intermediated by large broker-dealers, who are also significant repo users in their own right, to finance market-making inventory, source short-term funding or invest cash.
Repo are generally considered safe investments because the security in question functions as collateral. Classified as an instrument, a repurchase agreement functions in effect as a short-term, collateral-backed, interest-bearing loan. The buyer acts as a short-term lender, while the seller acts as a short-term borrower. The securities being sold are the collateral. Thus the objects of both parties, secured funding and liquidity, are met.
Repo markets key functions:
Facilitate the borrowing and lending of cash (Market segments: general collateral GC repo). Repos are an attractive option for lenders seeking to place cash, because the collateral they receive (including haircuts and margin calls) mitigates credit risk.
Improve the circulation of collateral or the exchange (swap) of collateral (Market segments: specific collateral SC repo). Lenders of cash can obtain specific securities (for speculation, to cover short positions…) for the repo’s duration, while lenders of the securities improve their portfolio liquidity without an outright sale.
Enabling investors to monetize liquid assets, banks and other financial institutions use repos in liquidity management to cover temporary shortfalls in cash flows
Providing a low-risk option for cash investment, Reverse repos are a very flexible liquid investment that can be structured as one-day transactions that can be rolled over.
Transformation of Collateral
Supporting cash market efficiency and liquidity
Facilitating hedging of risk
Central Banks’ instrument in the conduct of monetary policy operation
In order to determine the true costs and benefits of a repurchase agreement, a buyer or seller interested in participating in the transaction must consider three different calculations:
1)Cash paid in the initial security sale
2) Cash to be paid in the repurchase of the security
3) Implied interest rate
The cash paid in the initial security sale and the cash paid in the repurchase will be dependent upon the value and type of security involved in the repo. In the case of a bond, for instance, both of these values will need to take into consideration the clean price and the value of the accrued interest for the bond.
There are three main types of repurchase agreements:
Third-party repo(The most common type, also known as a tri-party repo). In this arrangement, a clearing agent or bank conducts the transactions between the buyer and seller and protects the interests of each. It holds the securities and ensures that the seller receives cash at the agreement offset, and that the buyer transfers funds for the benefit of the seller and delivers the securities at maturation. In addition to taking custody of the securities involved in the transaction, these clearing agents also value the securities and ensure that a specified margin is applied. They settle the transaction on their books and assist dealers in optimizing collateral. What clearing banks do not do, however, is act as matchmakers; these agents do not find dealers for cash investors or vice versa, and they do not act as a broker.
Specialized delivery repo. The transaction requires a at the beginning of the agreement and upon maturity. This type of agreement is not very common.
Held-in-custody repo. The seller receives cash for the sale of the security, but holds it in a for the buyer. This type of agreement is even less common because there is a risk the seller may become and the borrower may not have access to the collateral.
Essential terms to be affirmed in a Repo, are:
Transaction date
Purchase Date
Repurchase Date or whether the repo is open
Collateral (ISIN)
Nominal value of collateral
Market value of collateral
Purchase Price
Repo rate or (for open and floating-rate repos) interest rate index and spread
Currency of Purchase Price
Repurchase transactions are quoted in terms of the repo rate, that is, the percentage per annum rate of return on the Purchase Price to be paid by the Buyer to the Seller on the Repurchase Date (or, in the case of some open repos and floating-rate repos, on interim payment dates). The repo rate should be quoted on the basis of the day count and annual basis convention (also called the day count fraction convention) prevailing in the wholesale money market in the currency of the Purchase Price (notably, in the deposit and forward foreign exchange markets). This is almost always the actual day count and 365-day annual basis (A/365F) or the actual day count and 360-day annual basis (A/360). Parties to a repurchase transaction conventionally agree the Purchase Price of fixed-income securities in terms of the dirty or gross price of the collateral (that is, including the accrued interest since the last coupon date). The Purchase Price of a repurchase transaction also incorporates any initial margin or Haircut.
Bond repo markets developed in the G10 countries at different times– in the 1920s in the United States, the 1970s in continental Europe and the 1990s in the United Kingdom.
Monetary authorities used them as a monetary policy tool to increase the depth, liquidity and price efficiency of markets. Data reported by 19 primary dealers (banks and broker-dealers that may trade in US government securities directly with the FED) and around 1,000 bank holding companies suggest that by mid-2008 the gross market capitalization of the US repo market exceeded $10 trillion (including double-counting of repos and reverse repos). The primary dealers are the most active participants, and use repos to finance much of the growth of their balance sheets, creating procyclical leverage and an exposure to refinancing risk (Adrian and Shin (2008)). The top US investment banks funded roughly half of their assets using repo markets, with additional exposure due to off-balance sheet financing of their customers. While the US repo market is dominated by trading in US Treasuries, there are also active markets in bonds issued by US government-sponsored agencies, agency mortgage-backed securities (MBS) and corporate bonds. Prior to the crisis, non-government collateral contributed significantly to the rapid growth of the US repo market.
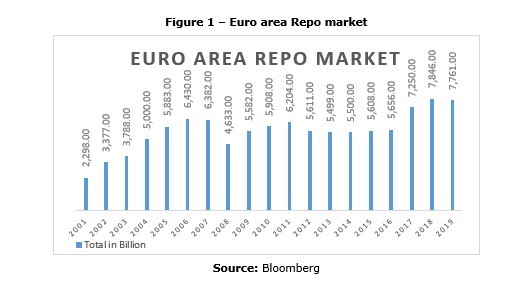
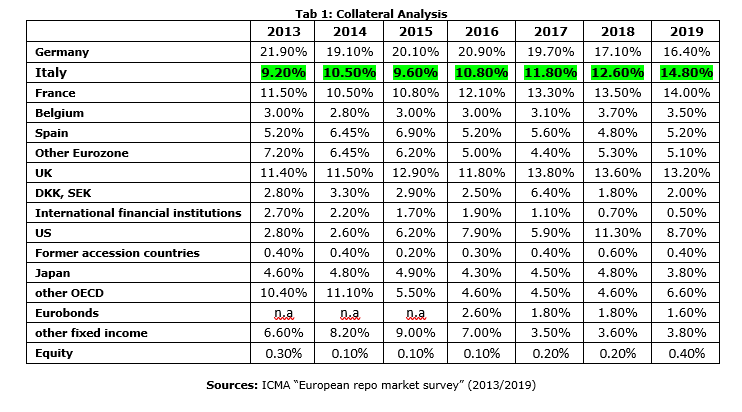
The euro area repo market (Figure 1) has also grown sharply, more than doubling in size (2002-2007) to reach more than €6 trillion outstanding (or around 65% of euro area GDP). Two thirds of the collateral is central government bonds from euro area countries, 16% from other euro area entities and 12% from other OECD countries. In terms of country of issuance, German collateral makes up one quarter of the market, followed by Italian at 13%, French at 11% and other euro area at 15%. Whereas there are more than 7,500 banking participants, activity is highly concentrated, with the top 20 banks accounting for 80% of activity.
Two thirds of repos have a maturity of one month or shorter, with the rest up to one year. Around half of euro repos are transacted directly between counterparties, while the remainder are brokered using either voice brokers or an electronic trading platform.
After years of fluctuations due to financial regulations strengthen and market seasonality in 2019 the “European repo market survey”, suggests the recovery of the market – that started in 2016 – has paused, albeit close to its record level. The slowdown in the repo market may have reflected the impact on financial markets of increased uncertainty in the global economy and the effect of inverting yield curves on fixed-income trading.
One exception to this was Italian government bonds, which continued to recover share in the repo market and performed very strongly in the first-half of 2019. Italian securities have been favored by investors in their search for yield, German securities on the other hand look to have suffered from increasingly negative yields.
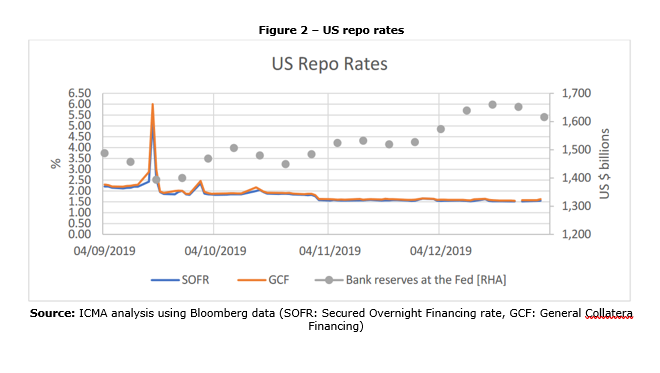
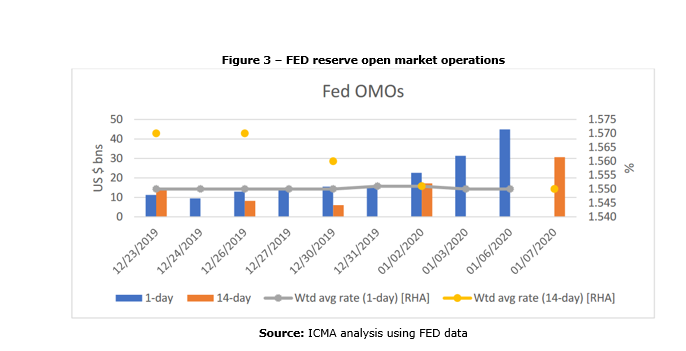
In US, following the much publicized spike in repo rates in September, there was understandably a lot of focus on how the market would behave over year-end. The extent of market nervousness was reflected in the return being priced around 4% up until a month before the date. However, the Federal Reserve’s attempts to keep bank reserves comfortably above the $1.5tn mark (Figure 5), through its open market operations and bill purchases, has proved successful in stabilizing money rates, and was further bolstered by an injection of increased liquidity over year-end (Figure 6). This also seems to have prompted a transfer of balance sheet by US banks from their European business to the US, providing for improved intermediation capacity.
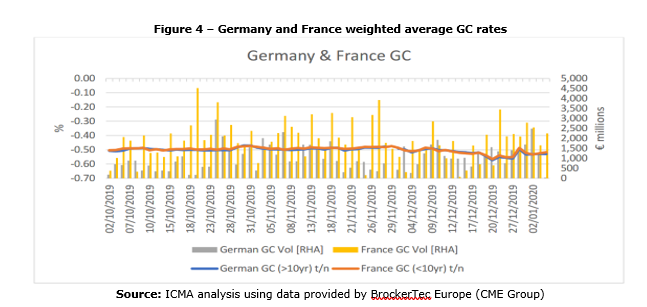
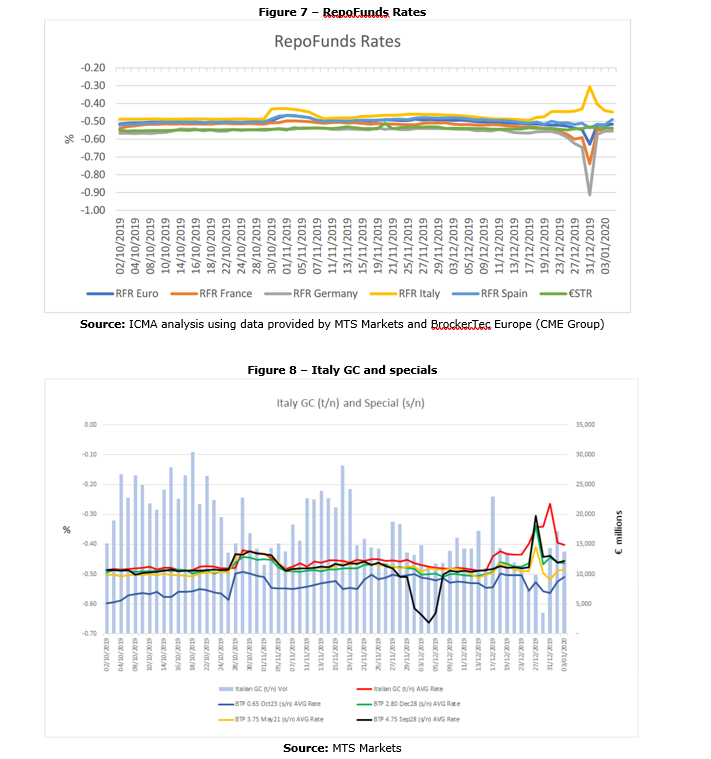
In Europe the market is more fragmented than the US one: in the end of 2019, German GC for the turn (essentially the benchmark rate for year-end funding costs) was being priced in a -1.25/-1.75 range; more expensive than the -0.50 level where it has been trading normally, but notably cheaper than in advance of previous year-ends. As the year-end date rolled into spot-next (S/N), this began to cheapen through-1.00, and it soon became apparent that unlike previous year-ends, there was not the usual abundance of cash and shortage of collateral, and that banks’ balance sheets were relatively long collateral. As the date rolled into tom-next (T/N), which is the most active date for euro GC, rates cheapened further to average around-0.50, in line with the ECB Deposit Rate (Figure 7). French GC (which has very much become the substitute European ‘safe asset’) followed this pattern closely, only printing at slightly cheaper levels.
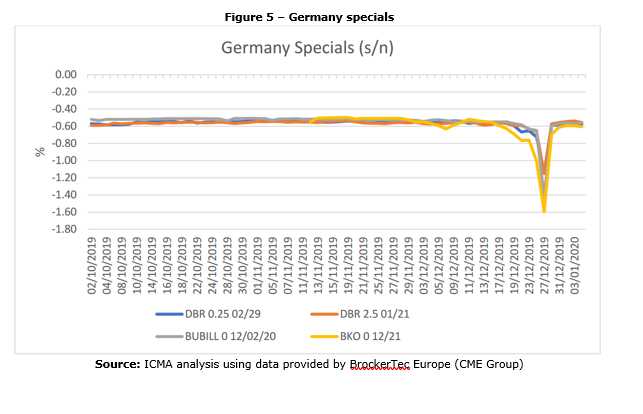
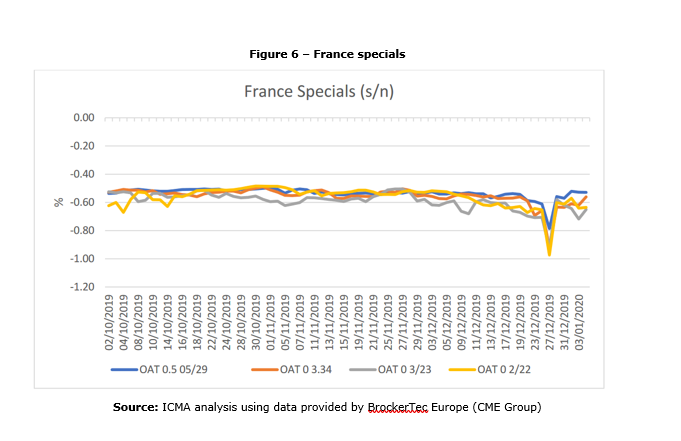
German and French specifics tracked the cheapening in GC, with the S/N levels averaging around 1% (which is reflected in the RepoFunds Rates – Figure 10). Accordingly, specials premium was much lower than previous year-ends. There was some short interest in the futures contracts’cheapest to deliver (CTD) bonds, in particular the 2yr (Schatz 0% 12/21) and 10yr (Bund 0.25% 2/29), although dealers report that the implied CTD repo rates remained relatively stable at around -0.702 which was not expensive enough to prompt significant selling. The most expensive specials levels are illustrated in Figure 8. Meanwhile the most expensive French specials (Figure 9) traded between -0.90 and -1.00.
Periphery GC rates tend to cheapen over year-end, in particular Italy, and 2019 was no exception although the moves were relatively range bound. Italy GC averaged -0.30, around 17bp cheaper than usual levels (Figure 10), with specifics around 5to 10bp more expensive (Figure 11). This relatively modest cheapening of Italian collateral was slightly surprising in light of the reserve tiering provisions, that were expected to drive more excess cash held by Italian banks out of Europe’s biggest domestic repo market and into higher yielding bank reserves, putting further upward pressure on Italian repo rates. Italian GC rates, however, have otherwise remained stubbornly close to the ECB Deposit Rate. Meanwhile, Spain GC traded around the -0.50 level (unchanged), with Spanish specifics averaging around -0.60.
As shown in the table below since 2013 the usage of Italian collateral has increased surpassing France and reducing the gap with Germany; this positive trend has been possible thanks to the stable outlook given by the rating agencies during the last years, the higher premium paid on Italian instrument than the other paid by the other European countries and the quantitative easing program undertaken by the ECB to sustain the European economy.
At the end of 2019 the Covid-19, in a completely unexpected way, has manifested itself affecting our life in all its aspects. The global lockdown of people and countries, the global disruption of working activities, the cessation of production and consumption, in combination with other factors, are leading us towards the COVID-19 financial crisis. As seen in the last 10 years, once again the Central Banks are in the middle of the pandemic economic and financial implications management.
FED and ECB have seen the liquidity as the most crucial factor to be managed. As shown by the analyses in the previous paragraphs, the Repurchase Agreement and the Repo Market have a key function in contrasting the cyclic nature of the economy.
The Fed and ECB have already take in place some actions to face this situation.
In particular, the Federal Reserve announced various strategies, among them:
the establishment of a temporary repurchase agreement facility for foreign and international monetary authorities (FIMA Repo Facility) to help support the smooth functioning of financial markets, including the U.S. Treasury market, and thus maintain the supply of credit to U.S. households and businesses. The FIMA Repo Facility will allow FIMA account holders, which consist of central banks and other international monetary authorities with accounts at the Federal Reserve Bank of New York, to enter into repurchase agreements with the Federal Reserve.
easing of conditions for Term Securities Lending Facility
The European Central Bank itself already undertook some actions:
conduction of purchases under the pandemic emergency purchase programme (PEPP)
conduction of the asset purchase programme (APP)
easing of conditions for long term refinancing operations (LTRO)
All the strategies mentioned share a flexibility driver and on the Repo market the instrument that represents the highest expression of flexibility is the Open Repo. The Central Banks could employ the Open Repo in an efficient way to implement the planned strategies by leveraging on the following factors:
Interest Rate equal to or less than the average rate on the deposit facility
Temporary envelope of additional net asset purchases
Interest rate on the main refinancing operations and the interest rates on the marginal lending facility and the deposit facility remaining unchanged at 0.00%, 0.25% and -0.50% respectively
Increasing flexibility of payment deadlines accordingly to favorable liquidity conditions
Borrowing allowance raised to 50% of eligible loans
Removing the limit of 10% of the stock of eligible loans for the amount of funds that can be borrowed in each operation, on all future operations
The creation of facilities to exchange illiquid collateral for liquid government bonds
We could continue mentioning plenty of other factors to leverage, but it is clear that these are the same factors used from 2008 financial crisis until today. The most important thing is to combine them together efficiently.
It is too early to perform detailed analysis on the benefits obtained by using these instruments and strategies, it is also early to conduct quantitative analysis about the results of these operations, but the historical evidence allows us to affirm that this could be the right way to follow, to guarantee short term liquidity and to avoid most of the problems related to the shortage of liquidity in the economic system.
Covid-19 is the invisible enemy that is affecting our life worldwide.
In this article we tried to highlight some key aspects that could help the economic system to avoid a deep recession using the Repo Market.
We analyzed the key technical aspects of the Repurchase Agreement and the logical flow behind its market functions; we also have seen which are the risks affecting the repo markets, and how the central banks and the primary dealers used this financial instrument for macroeconomic objects.
What has been highlighted with particular focus is the unquestionable strong linkage between repo market and financial system’s performance and health.
Another crucial aspect analyzed in the paper is the Repo Market primary role in the financial sector gained during the years till becoming a key instrument in particular for interbank exchanges; especially during crisis period it’s been affected by directives to prevent the collapse of the real economy thanks to stimulus by Central Banks.
Repo Market, although considered smoother and clearer than other type of financial instrument market (i.e. derivatives), plays a fundamental role especially considered the increasing importance of the Central Banks in nowadays economic and financial playground.
All the aspects highlighted converge into the possibility to use this market, and in particular the open repo, a specific product within itself, to tackle the financial implications due to Covid-19, considering also the inevitable consequences of the macroeconomic actions – taken by the Central banks – in terms of collateral segregation and market factors changes that are specific of the Repo Market.
[1] MSCI World Index: The MSCI World Index is a broad global equity index that represents large and mid-cap equity performance across all 23 developed markets countries. It covers approximately 85% of the free float-adjusted market capitalization in each country.
This paper covers the banking crisis in Ireland that started in 2008, which stemmed from a combination of macroeconomic developments, risky bank practices and unsustainable fiscal policies. In line with the scope of this series, the paper focuses on the policy response…
The results reported in the October 2020 bank lending survey (BLS) relate to changes observed during the third quarter of 2020 and expectations for the fourth quarter of 2020…
L’iniziativa di Finriskalert.it “Il termometro dei mercati finanziari” vuole presentare un indicatore settimanale sul grado di turbolenza/tensione dei mercati finanziari, con particolare attenzione all’Italia.
Significato degli indicatori
Rendimento borsa italiana: rendimento settimanale dell’indice della borsa italiana FTSEMIB;
Volatilità implicita borsa italiana: volatilità implicita calcolata considerando le opzioni at-the-money sul FTSEMIB a 3 mesi;
Future borsa italiana: valore del future sul FTSEMIB;
CDS principali banche 10Ysub: CDS medio delle obbligazioni subordinate a 10 anni delle principali banche italiane (Unicredit, Intesa San Paolo, MPS, Banco BPM);
Tasso di interesse ITA 2Y: tasso di interesse costruito sulla curva dei BTP con scadenza a due anni;
Spread ITA 10Y/2Y : differenza del tasso di interesse dei BTP a 10 anni e a 2 anni;
Rendimento borsa europea: rendimento settimanale dell’indice delle borse europee Eurostoxx;
Volatilità implicita borsa europea: volatilità implicita calcolata sulle opzioni at-the-money sull’indice Eurostoxx a scadenza 3 mesi;
Rendimento borsa ITA/Europa: differenza tra il rendimento settimanale della borsa italiana e quello delle borse europee, calcolato sugli indici FTSEMIB e Eurostoxx;
Spread ITA/GER: differenza tra i tassi di interesse italiani e tedeschi a 10 anni;
Spread EU/GER: differenza media tra i tassi di interesse dei principali paesi europei (Francia, Belgio, Spagna, Italia, Olanda) e quelli tedeschi a 10 anni;
Euro/dollaro: tasso di cambio euro/dollaro;
Spread US/GER 10Y: spread tra i tassi di interesse degli Stati Uniti e quelli tedeschi con scadenza 10 anni;
Prezzo Oro: quotazione dell’oro (in USD)
Spread 10Y/2Y Euro Swap Curve: differenza del tasso della curva EURO ZONE IRS 3M a 10Y e 2Y;
Euribor 6M: tasso euribor a 6 mesi.
I colori sono assegnati in un’ottica VaR: se il valore riportato è superiore (inferiore) al quantile al 15%, il colore utilizzato è l’arancione. Se il valore riportato è superiore (inferiore) al quantile al 5% il colore utilizzato è il rosso. La banda (verso l’alto o verso il basso) viene selezionata, a seconda dell’indicatore, nella direzione dell’instabilità del mercato. I quantili vengono ricostruiti prendendo la serie storica di un anno di osservazioni: ad esempio, un valore in una casella rossa significa che appartiene al 5% dei valori meno positivi riscontrati nell’ultimo anno. Per le prime tre voci della sezione “Politica Monetaria”, le bande per definire il colore sono simmetriche (valori in positivo e in negativo). I dati riportati provengono dal database Thomson Reuters. Infine, la tendenza mostra la dinamica in atto e viene rappresentata dalle frecce: ↑,↓, ↔ indicano rispettivamente miglioramento, peggioramento, stabilità rispetto alla rilevazione precedente.
Disclaimer: Le informazioni contenute in questa pagina sono esclusivamente a scopo informativo e per uso personale. Le informazioni possono essere modificate da finriskalert.it in qualsiasi momento e senza preavviso. Finriskalert.it non può fornire alcuna garanzia in merito all’affidabilità, completezza, esattezza ed attualità dei dati riportati e, pertanto, non assume alcuna responsabilità per qualsiasi danno legato all’uso, proprio o improprio delle informazioni contenute in questa pagina. I contenuti presenti in questa pagina non devono in alcun modo essere intesi come consigli finanziari, economici, giuridici, fiscali o di altra natura e nessuna decisione d’investimento o qualsiasi altra decisione deve essere presa unicamente sulla base di questi dati.
Disclaimer: Le informazioni, e dichiarazioni e le opinioni espresse nell’articolo sono da attribuirsi all’autore solamente e non sono in alcun modo riconducibili al ruolo aziendale svolto all’interno del Gruppo UniCredit né ad UniCredit stessa.
Una buona gestione dell’asset-liability management (ALM) prevede la modellizzazione di almeno due principali poste commerciali del bilancio bancario, in funzione del comportamento dei clienti: nell’attivo il prepagamento dei mutui / finanziamenti e nel passivo i depositi a vista. La necessità di tale Behaviouralmodelling è essenziale per comprendere il rischio di liquidità, il rischio tasso di interesse e per ottimizzare il match tra le poste attive e passive del bilancio, così da stabilizzare, e anche migliorare, la redditività (il Net Interest Income). Quest’ultima si genera essenzialmente dal mismatch temporale tra attivi/passivi ed è garantita fintanto che la curva dei tassi di interesse remunera un investimento a lungo termine più di un investimento a breve termine. Per esempio, usando le poste di bilancio, quando il tasso di interesse di riferimento di un mutuo a 20 anni (IRS) – l’attivo della banca – risulti superiore al tasso di interesse di riferimento (Euribor 3m) dei depositi – il passivo del bilancio bancario. Questa condizione si è sempre verificata sebbene, dal 2014, il tasso Euribor 3m sia diventato negativo e le banche, non potendo offrire tassi negativi alla clientela, hanno posto a zero il tasso sui depositi. Per l’ALM questo evento ha causato le seguenti ripercussioni: dal punto di vista del rischio tasso di interesse è stata venduta un’opzione floor al cliente ed una conseguente diminuzione della probabilità di repricing (c.d. pass-through), mentre il rischio liquidità è in proporzione aumentato, dato che i depositi sono aumentati a causa dell’assenza di investimenti alternativi, quali poteva essere un depositi a 3 mesi, che siano superiori allo zero[1]. In breve, in caso il tasso Euribor 3m ritornasse positivo vedremmo più velocemente defluire i depositi verso investimenti alternativi che remunerano più di zero (il tasso offerto oggi dalla banca). Ed è per questo motivo che occorre conoscere il tasso di repricing (c.d. pass-through) ed avere modelli capaci di suddividere la natura del deposito in tre componenti: transazionale, risparmio e speculativa.
L’insieme di questi eventi, lo scenario di interessi negativi e il cambiamento di comportamento nella clientela attenta alla componente di risparmio e speculativa, ribadisce la necessità di generare valore dalla gestione del mismatch di asset e liability e comporta la necessità di avere una buona gestione del ALM ed un’efficiente modellizzazione dei comportamenti dei clienti. Vediamo con esempi concreti quale è stato l’impatto del Covid-19, sebbene la crisi economica non sia ancora completata (ahimè) ed il comportamento dei clienti non si sia ancora stabilizzato, sui Behaviouralmodels.
Dobbiamo innanzitutto affermare che i comportamenti dei clienti dall’inizio della crisi Covid-19 sono cambiati: sia l’atteggiamento dei clienti nei confronti del prepagamento dei mutui/prestiti sia la dinamica dei depositi. Questi comportamenti sono esogeni al modello, mentre aggiunge un ulteriore effetto sulla redditività della banca l’ulteriore appiattimento, oltre che abbassamento, della curva dei tassi di interessi, a seguito delle iniziative messe in campo dalla Banca Centrale Europea.
Il mix di questi eventi ha avuto un impatto sulla gestione del ALM e, inevitabilmente, ha comportato la necessità di disporre di modelli comportamentali che siano più raffinati possibile, dal punto di vista quantitativo, nell’elaborazione dei dati, ma anche più abili nel cogliere le novità presentate dal mercato. Più semplicemente, i Behaviouralmodels hanno bisogno, più di altri modelli presenti in Banca – tipo quelli usati per stimare il capitale -, di essere più reattivi alle novità del contesto economico e, se necessario, meno basati sull’evidenza storica. Un esempio fra tutti, durante il lockdown i clienti avevano difficoltà a raggiungere la filiale per poter estinguere il mutuo (oggi sempre meno grazie alle novità messe in atto dalle banche nella relazione con il cliente on-line) e, nel frattempo, osservando maggiori incertezze nel futuro e, non potendo spendere il proprio stipendio, hanno aumentato in media i depositi sul conto corrente. Per i modelli comportamentali questo è stato uno shock. Imprevisto e imprevedibile. E che pone la domanda più difficile per chi fa Behavioural modelling: è corretto includere tale periodo nei processi di calibrazione?
Nel libro “A Guide to Behavioural Modelling” (Risk.Net, 2019) abbiamo definito alcuni Princìpi che possono supportare chi fa Behavioural modelling e nel contempo chi fruisce le conseguenze dell’output di tali modelli comportamentali (la tesoreria per le coperture dei rischi, la pianificazione per la comprensione della redditività) al fine di affrontare questi eventi inattesi nel modo più appropriato in funzione degli obiettivi prima descritti: ottimizzazione del bilancio e minimizzazione dei rischi di liquidità e tasso. Per affrontare questi eventi i Princìpi più rilevanti sono:
Il modello dovrebbe tenere conto delle attuali condizioni di mercato, ambiente competitivo, fattori macroeconomici e dei loro possibili sviluppi
Il modello deve tenere conto del trade-off tra complessità e qualità dei dati utilizzati
Il modello deve essere stimato in uno scenario di normalità, detto anche On-Going basis, avendo coerenza tra il periodo di calibrazione effettuato e quello di applicazione.
Sulla base di questi tre Princìpi è possibili supportare l’esclusione degli ultimi dati, che pure abbiamo osservato, nella calibrazione del modello ma solo quando lo andremo ad applicare ad un periodo di normalità. Altresì, dovremmo ricomprendere quest’ultimi dati in caso di un nuovo lock-down. In caso si disponga di modelli più avanzati, o sofisticati dal punto di vista della capacità di elaborare i dati, si potrebbe pensare di pesare i dati osservati in funzione della loro probabilità di futuro realizzo.
Un secondo esempio è dettato dal comportamento dei depositi dei clienti durante il periodo del lock-down. Quest’ultimi sono cresciuti a seguito di due fattori, uno esogeno ed uno endogeno ai clienti: le restrizioni imposte dai decreti nazionali hanno impedito di spendere la componente transazionale (l’ammontare dei depositi dedicato alla spesa quotidiana, l’affitto o il mutuo, l’acquisto dei vestiti o anche le uscite serali) mentre l’incertezza sul futuro ha diminuito la componente dedicata al risparmio e alla componente speculativa (vendendo il portafoglio dedicato agli investimenti azionari o obbligazioni durante il crash di mercato osservato a marzo). Il mix degli eventi ha comportato un aumento dei depositi e, inevitabilmente, un effetto diretto sull’output dei modelli che considerano i dati passati e sulla loro capacità predittiva nel momento in cui tra le variabili predittive del modello non sono presenti la propensione al rischio (o al risparmio) del cliente e/o l’investimento alternativo.
Ancora una volta occorre appellarsi ad un Principio che guida le scelte di chi fa Behavioural modelling. Il Principio 4 pone una relazione diretta tra l’output del modello, la ricerca della componente stabile dei depositi che può essere considerata come funding strutturale e la componente core che può essere investita in un asset a tasso fisso, e la qualità del dato di input con la sua modellizzazione:
La componente stabile e core deve essere proporzionale alla qualità del modello e la sua complessità
Ad esempio, se un modello dispone di dati granulari sull’esposizione dei clienti al portafoglio di investimento, sia under-asset-custody o asset under-management, sarà possibile stimare, tramite un modello complesso dal punto di vista matematico/econometrico, come storicamente si è comportato il cliente in un periodo di forte oscillazione dei mercati. E quindi stimare la sua avversione al rischio ed usare tale periodo per stabilire se la liquidità osservata nell’ultimo periodo sia davvero stabile o transitoria. D’altra parte, in assenza dei dati storici che possano dimostrare come i clienti reagiscono quando non possono spendere la componente transazionale (il lock-down per molti paesi è stato un unicum storico) dobbiamo inevitabilmente integrare il modello comportamentale con un’opinione che, un po’ presuntuosamente, chiamiamo “opinione di esperti”. Ad avallare tale opinione ci sarà il management delegato alla gestione del ALM che, in modo coerente con il business model e risk-appetite della banca, considererà questo approccio come parte integrante del Behavioural model.
In conclusione, la redditività ed il rischio di liquidità e tasso di interesse sono profondamente influenzati dal comportamento dei clienti, dal contesto economico e dai modelli interni utilizzati per gestire prospetticamente i rischi e la redditività futura. Una volta ottenuto l’output dei Behavioural models, sia da un modello semplice o uno complesso, occorre sempre valutare se questo sia coerente con le osservazioni passate ma anche con il contesto economico attuale e prospettivo.
[1] Quando si fa il Behavioural Modelling dei depositi occorre sempre suddividere la natura del deposito in tre componenti: transazionale, risparmio e speculativa
In sign of increased institutional participation in cryptocurrency, the Chicago Mercantile Exchange (CME) has surpassed prominent cryptocurrency exchanges…
Who wants a central bank digital currency (CBDC)? Plenty of people, apparently; industry groups are advocating digital cash, millions of people have reportedly…
Questo sito utilizza cookie tecnici e di profilazione, propri e di terze parti, per garantire la corretta navigazione, analizzare il traffico e misurare l'efficacia delle attività di comunicazione.
Questo sito Web utilizza i cookie per migliorarne l'esperienza di navigazione. I cookie classificati come necessari, sono essenziali alle funzioni di base sito e vengono sempre memorizzati nel tuo browser. I cookie di terze parti, che ci aiutano ad analizzare e capire come utilizzi questo sito, vengono memorizzati nel tuo browser solo con il tuo consenso. Di seguito hai la possibilità di disattivare questi cookie. Tieni in conto che la disattivazione di alcuni di questi cookie potrebbe influire sulla tua esperienza di navigazione.
Necessary cookies are absolutely essential for the website to function properly. These cookies ensure basic functionalities and security features of the website, anonymously.
Cookie
Durata
Descrizione
cookielawinfo-checkbox-analytics
1 year
Cookie tecnico impostato dal plugin GDPR Cookie Consent che viene utilizzato per registrare il consenso dell'utente per i cookie nella categoria "Analitici".
cookielawinfo-checkbox-necessary
1 year
Cookie tecnico impostato dal plugin GDPR Cookie Consent che viene utilizzato per registrare il consenso dell'utente ai cookie.
CookieLawInfoConsent
1 year
Cookie tecnico impostato dal plugin GDPR Cookie Consent per salvare le scelte si/no dell'utente per ciascuna categoria.
viewed_cookie_policy
1 year
Cookie tecnico impostato dal plugin GDPR Cookie Consent che registra lo stato del pulsante predefinito della categoria corrispondente.
Analytical cookies are used to understand how visitors interact with the website. These cookies help provide information on metrics the number of visitors, bounce rate, traffic source, etc.
Cookie
Durata
Descrizione
_pk_id.gV3j99y0AE.0928
1 year 27 days
Cookie analitico impostato da Matomo e utilizzato per memorizzare alcuni dettagli sull'utente come l'ID univoco del visitatore
_pk_ses.gV3j99y0AE.0928
30 minutes
Cookie analitico impostato da Matomo di breve durata e utilizzato per memorizzare temporaneamente i dati della visita