A careful assessment should be made of the proposal to reform the MiFID client categories. MiFID already provides for the possibility for the most experienced retail clients…
Ott
23
2020
A careful assessment should be made of the proposal to reform the MiFID client categories. MiFID already provides for the possibility for the most experienced retail clients…
EIOPA has launched a program of targeted training on insurance supervision for 17 national competent authorities…

L’iniziativa di Finriskalert.it “Il termometro dei mercati finanziari” vuole presentare un indicatore settimanale sul grado di turbolenza/tensione dei mercati finanziari, con particolare attenzione all’Italia.
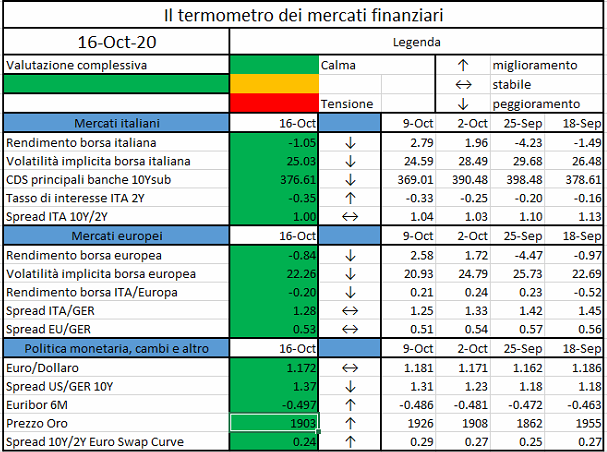
Significato degli indicatori
I colori sono assegnati in un’ottica VaR: se il valore riportato è superiore (inferiore) al quantile al 15%, il colore utilizzato è l’arancione. Se il valore riportato è superiore (inferiore) al quantile al 5% il colore utilizzato è il rosso. La banda (verso l’alto o verso il basso) viene selezionata, a seconda dell’indicatore, nella direzione dell’instabilità del mercato. I quantili vengono ricostruiti prendendo la serie storica di un anno di osservazioni: ad esempio, un valore in una casella rossa significa che appartiene al 5% dei valori meno positivi riscontrati nell’ultimo anno. Per le prime tre voci della sezione “Politica Monetaria”, le bande per definire il colore sono simmetriche (valori in positivo e in negativo). I dati riportati provengono dal database Thomson Reuters. Infine, la tendenza mostra la dinamica in atto e viene rappresentata dalle frecce: ↑,↓, ↔ indicano rispettivamente miglioramento, peggioramento, stabilità rispetto alla rilevazione precedente.
Disclaimer: Le informazioni contenute in questa pagina sono esclusivamente a scopo informativo e per uso personale. Le informazioni possono essere modificate da finriskalert.it in qualsiasi momento e senza preavviso. Finriskalert.it non può fornire alcuna garanzia in merito all’affidabilità, completezza, esattezza ed attualità dei dati riportati e, pertanto, non assume alcuna responsabilità per qualsiasi danno legato all’uso, proprio o improprio delle informazioni contenute in questa pagina. I contenuti presenti in questa pagina non devono in alcun modo essere intesi come consigli finanziari, economici, giuridici, fiscali o di altra natura e nessuna decisione d’investimento o qualsiasi altra decisione deve essere presa unicamente sulla base di questi dati.

Last 27th July 2020 EIOPA published a paper stressing the need of shared public and private insurance coverages to protect individuals and businesses from the financial consequences come from the business interruption caused by potential future pandemics.
COVID-19 has provoked the most serious global economic downturn since the Great Recession of the 1930’s, affecting an enormous part of the society, worldwide, at the same time. Insurance companies by themselves would not be able to offer coverages against the losses policyholders may incur because of a pandemic: the insurance business rely on risk pooling and geographic diversification, while a pandemic hits everybody, everywhere. The premiums needed to cover the claims originated by a business interruption would be just too high: it has been estimated that, given the current tariffs applied to these policies, an amount of premiums collected for a hundred years would have been enough to cover the claims occurred in just two months of pandemic. This ignores that COVID-19 has also affected other lines of business (such as life, health and travel) and, furthermore, that it has indirectly damaged the Asset side of insurers’ Balance Sheets as well, because of the economic downturn.
On one hand these facts seem to discourage insurance companies from covering pandemic risks, but, on the other, people need these type of coverages and, as reported by MARSH in their June 2020 Insight (“Pandemic Risk Protection”), the business community has already expressed a strong will to buy. A solution may be for the insurance companies not to “play alone”.
EIOPA has identified four principles to guide a “shared resilience solution” scheme to cover pandemic risks:
The key elements to manage the significant protection gap are:
Insurance companies can perform a suitable risk assessment by having access to all relevant data. Some of them (like type of virus, contagion development, lock-down figures) can be found from public sources, while others (like granular data of losses per company) cannot: a collective effort to make this type of data available would be crucial.
Another key element is to improve the pricing model: the usage of current catastrophe models appears to be insufficient when the effects of the application of a lock-down drive a relevant portion of the risk.
A simple and transparent wording is essential, as business interruption policies are not common in European markets. The coverage should target small and medium enterprises, being them those mostly affected by the downturn, without the financial capabilities to withstand any sustained shut down of their activity. The coverage should be parametric, defined over an objective insurance “trigger”, such as an earthquake magnitude. In the case of a pandemic, the trigger may be the contagion growth in the area where the business operates, or a measure of the reduction in the economic activity. A parametric coverage would offer the clients the advantage of a prompt settlement (as the amount would be quickly determined), but would expose them to the risk that the payment is not a good proxy of the losses they have actually incurred.
An insurance cover for business interruption caused by a pandemic needs a shared solution comprising public and private sector participation, to enable a risk transfer among different actors: private companies, insurance undertakings, reinsurance industry, national governments and, finally, the European Union. The risk transfer from one level to the next needs to follow a clear mechanism, not necessarily static over time: private insurance companies may start with a limited risk appetite (and a relevant public support) and may increase it over time, while their risk assessment improves and the public intervention can decrease. A co-insurance agreement can be set between private and public to share the losses at a given percentage.
Having acknowledged that a public intervention is needed, it is important to avoid public subsidy to pose a risk of moral hazard by reducing incentives for the clients to invest in risk prevention. This can be avoided by defining premiums that reflect the preventive measure put in place by the clients (e.g. lower premiums for those who have settled better measures) and by leaving them with some risk, for instance by capping the benefits to a given amount.
Superano i 2,7 milioni le domande di adesione alle moratorie su prestiti per un valore in aumento a 302 miliardi…
https://www.bancaditalia.it/media/comunicati/documenti/2020-02/cs-taskforce-20201014.pdf
Litecoin (LTC), a nine-year-old cryptocurrency whose price returns have chronically underperformed…
Today, the European Insurance and Occupational Pensions Authority (EIOPA) finalised the Guidelines on Information and Communication Technology (ICT) Security and Governance…
Economic growth and forward-looking indicators of default risk inferred from equity markets, two variables that together predict business bankruptcies…
L’iniziativa di Finriskalert.it “Il termometro dei mercati finanziari” vuole presentare un indicatore settimanale sul grado di turbolenza/tensione dei mercati finanziari, con particolare attenzione all’Italia.
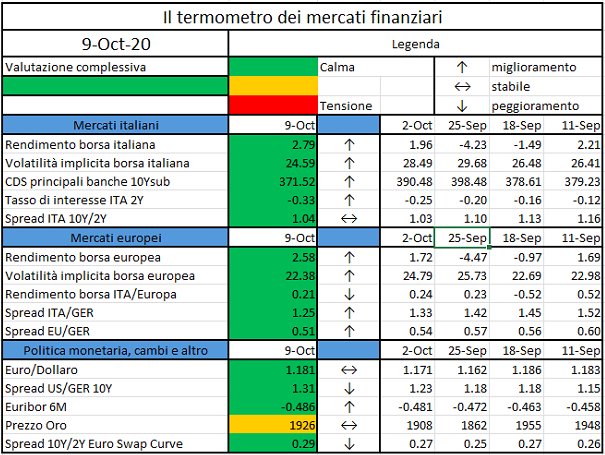
Significato degli indicatori
I colori sono assegnati in un’ottica VaR: se il valore riportato è superiore (inferiore) al quantile al 15%, il colore utilizzato è l’arancione. Se il valore riportato è superiore (inferiore) al quantile al 5% il colore utilizzato è il rosso. La banda (verso l’alto o verso il basso) viene selezionata, a seconda dell’indicatore, nella direzione dell’instabilità del mercato. I quantili vengono ricostruiti prendendo la serie storica di un anno di osservazioni: ad esempio, un valore in una casella rossa significa che appartiene al 5% dei valori meno positivi riscontrati nell’ultimo anno. Per le prime tre voci della sezione “Politica Monetaria”, le bande per definire il colore sono simmetriche (valori in positivo e in negativo). I dati riportati provengono dal database Thomson Reuters. Infine, la tendenza mostra la dinamica in atto e viene rappresentata dalle frecce: ↑,↓, ↔ indicano rispettivamente miglioramento, peggioramento, stabilità rispetto alla rilevazione precedente.
Disclaimer: Le informazioni contenute in questa pagina sono esclusivamente a scopo informativo e per uso personale. Le informazioni possono essere modificate da finriskalert.it in qualsiasi momento e senza preavviso. Finriskalert.it non può fornire alcuna garanzia in merito all’affidabilità, completezza, esattezza ed attualità dei dati riportati e, pertanto, non assume alcuna responsabilità per qualsiasi danno legato all’uso, proprio o improprio delle informazioni contenute in questa pagina. I contenuti presenti in questa pagina non devono in alcun modo essere intesi come consigli finanziari, economici, giuridici, fiscali o di altra natura e nessuna decisione d’investimento o qualsiasi altra decisione deve essere presa unicamente sulla base di questi dati.

In the paper “On the design of Sovereign Bond-Backed Securities”, [1] written together with Damiano Brigo and Marco Francischello (Imperial College), we analyze the design of Sovereign Bond-Backed Securities (SBBS) in the Euro area, concentrating our attention on the return of the different tranches and on their riskiness.
The analysis is performed considering the market on January 31st, 2019, and then is extended to the whole period 2005-2019. The role of the structure of the tranches, the role of the recovery rate, and the correlation among States have been analyzed. More precisely, we deal with:
Given the unrealistic assumption of null recovery rate and uniform correlation among States, as made in ESRB High-level task force on safe assets (2018) Sovereign bond-backed securities: a feasibility study, Volume I: main findings, we consider also block correlation structures, i.e.
and
In the first case, we observe that a uniform block structure for the correlation impacts the yield rates of the tranches, with a decrease of the yield of the junior tranche, an increase of the yield of senior and, in particular, of mezzanine tranches. Moving from a uniform to a block correlation structure, we show that the yield rate of the senior tranche remains pretty stable, the yield rate of the mezzanine increases, while the yield rate of the junior tranche significantly decreases going from a uniform to a block correlation structure.
Comparing the effect of correlation and non-zero recovery rate, we prove that it is the second one which impacts the most on the yields of SBBS tranches, with high yields for junior tranches.
We also compare SBBS with national tranching followed by pooling: States issue senior and junior tranches, then senior tranches are pooled together to build an asset backed security. The analysis shows that, as for SBBS, pooling government bonds of different States to build a safe asset renders junior bonds extremely risky.
In summary, the main issue in constructing a safe asset is not the safety of senior tranches but the risk of the junior ones.
[1] Available at SSRN: https://ssrn.com/abstract=3496155
