Japan’s interminable winter for cryptocurrency exchanges seems to have thawed…
Fed Chairman Jerome Powell believes that bitcoin’s primary use case is as a store of value, not payments. That could be about to change…

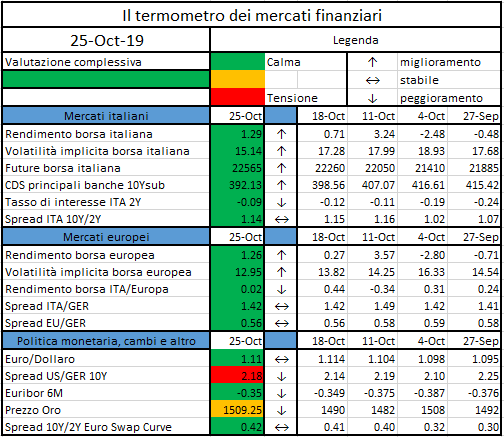
L’iniziativa di Finriskalert.it “Il termometro dei mercati finanziari” vuole presentare un indicatore settimanale sul grado di turbolenza/tensione dei mercati finanziari, con particolare attenzione all’Italia.

Significato degli indicatori
- Rendimento borsa italiana: rendimento settimanale dell’indice della borsa italiana FTSEMIB;
- Volatilità implicita borsa italiana: volatilità implicita calcolata considerando le opzioni at-the-money sul FTSEMIB a 3 mesi;
- Future borsa italiana: valore del future sul FTSEMIB;
- CDS principali banche 10Ysub: CDS medio delle obbligazioni subordinate a 10 anni delle principali banche italiane (Unicredit, Intesa San Paolo, MPS, Banco BPM);
- Tasso di interesse ITA 2Y: tasso di interesse costruito sulla curva dei BTP con scadenza a due anni;
- Spread ITA 10Y/2Y : differenza del tasso di interesse dei BTP a 10 anni e a 2 anni;
- Rendimento borsa europea: rendimento settimanale dell’indice delle borse europee Eurostoxx;
- Volatilità implicita borsa europea: volatilità implicita calcolata sulle opzioni at-the-money sull’indice Eurostoxx a scadenza 3 mesi;
- Rendimento borsa ITA/Europa: differenza tra il rendimento settimanale della borsa italiana e quello delle borse europee, calcolato sugli indici FTSEMIB e Eurostoxx;
- Spread ITA/GER: differenza tra i tassi di interesse italiani e tedeschi a 10 anni;
- Spread EU/GER: differenza media tra i tassi di interesse dei principali paesi europei (Francia, Belgio, Spagna, Italia, Olanda) e quelli tedeschi a 10 anni;
- Euro/dollaro: tasso di cambio euro/dollaro;
- Spread US/GER 10Y: spread tra i tassi di interesse degli Stati Uniti e quelli tedeschi con scadenza 10 anni;
- Prezzo Oro: quotazione dell’oro (in USD)
- Spread 10Y/2Y Euro Swap Curve: differenza del tasso della curva EURO ZONE IRS 3M a 10Y e 2Y;
- Euribor 6M: tasso euribor a 6 mesi.

The regulatory context is constantly changing: since 2012, over 50,000 regulations have been published throughout the G20.
In this regulatory landscape, compliance functions are facing some key challenges:
- Managing Regulators: Respond to regulatory requirements with timeliness, protecting both the brand and reputation;
- Compliance Strategy: Lead the strategic decision-making process from a regulatory compliance standpoint;
- Compliance Operations: Reduce compliance costs by promoting transparency and managing inefficiencies in paper-driven processes;
- Consumer Protection: Implement new solutions to enhance customers’ protection.
Current compliance tools used by financial institutions are gradually reducing the capability to meet regulatory demands. Therefore, in order to gather, analyze and compute all the required data, financial institutions are using a variety of IT systems and are increasing manual processes and the related operational risks.
A key issue is clearly arising: “how can a financial institution address compliance in a more efficient and less resource-consuming manner while improving the quality of data reported to regulatory supervisory authorities?” Within FinTech ecosystem there are a group of companies focused on meeting regulatory demands through innovative technologies: the RegTech Universe.
RegTech Universe
“RegTech (Regulatory Technology) is a subset of FinTech that focuses on technologies that may facilitate the delivery of regulatory requirements more efficiently and effectively than existing capabilities”.

Deloitte is constantly mapping the FinTech ecosystem and has created the RegTech Universe where we are compiling a list of RegTech companies along with the technologies and solutions they are offering: https://www2.deloitte.com/lu/en/pages/technology/articles/regtech-companies-compliance.html
Deloitte research on the RegTech Universe is an ongoing exercise where we classify the regTech solutions in 5 key areas:
- Regulatory Reporting: Enable automated data distribution and regulatory reporting through big data analysis, real time and cloud reports.
- Risk Management: Detect regulatory and compliance risks, assess exposure to risk and anticipate future threats.
- Identity Management & Control: Facilitate counterparty due diligence and Know Your Customer (KYC) procedures. AML and anti-fraud screening and detection. .
- Compliance: Real time monitoring and tracking of current state of compliance and upcoming regulations
- Transaction Monitoring: Solutions for real time transaction monitoring and auditing.

Considering the 5 key areas of RegTech Universe, Deloitte has developed a RegTech platform, exploiting the knowledge and expertise on technological enablers, gained through the EMEA Deloitte’s Centers of Excellence:
- RPA: Application of programmed software to perform repetitive and rule-based tasks;
- Artificial Intelligence: Technology that reproduces logical thinking normally requiring human intelligence;
- Blockchain: Technologies used to track and speed up the transaction lifecycle;
- Big data & analytics: Tools and real time techniques that improve decision-making processes, starting from heterogeneous data;
- IoT: Technologies that allow the internet connection of different types of devices in order to monitor, control and transfer information, and then perform subsequent actions.
Through the abovementioned enablers, RegTech introduces for the first time the following elements:
- Agility: Cluttered and intertwined data sets can be de-coupled and organized through ETL (Extract, Transfer, Load) technologies;
- Speed: Reports can be configured and generated quickly;
- Integration: Short timeframes to get solution up and running;
- Analytics: RegTech uses analytic tools to intelligently mine existing “big data” data sets and unlock their true potential e.g. using the same data for multiple purposes.

Regtech: Niche solution
Regtech companies are therefore trying to exploit technological innovation to meet regulatory demands whilst complexity Financial Institutions have to manage is increasing:
Digitalization
- Complex IT Architecture
- High integration costs
- Long and uncertain maintenance times
Regulatory Pressures
- Increasingly frequent inspections by Supervisory Authority
- More sophisticated control techniques
- Analytical tools capable of identifying compliance risks (including RegTech tools)
Confusing Vendor Landscape
- Too many vendors cause confusion
- Financial institutions struggle to identify suitable partners
Data and Analytics
- Inappropriate data management
- Interpretation of increasingly complex data
Reporting
- Localized reports, unsuccessful handling of centrally-managed reports
Manual Processes
- Complicated manual procedures increase the possibility of error
- People are encouraged to ignore controls
The ability to cope with these issues is mandatory and RegTech companies may help Financial Institutions: the key success factor of RegTech versus “traditional solutions” is agility. The activities and processes covered by RegTech solutions go beyond regulatory reporting and is constantly increasing (e.g. see 5 RegTech Universe areas) and they all have one feature in common: the targeting of a very specific niche.
Digital onboarding for financial services
“Identity Management and control” is one of the categories in the “RegTech Universe” which horizontally contains all the issues considered.
Digital onboarding enables a new and personalized customer experience by simplifying the access to financial services while reducing processing time and cost for financial institutions due to optimized procedures:
- Improved Customer Experience
- Create faster and more flexible access to banking services
- Be perceived as innovative and reinforce brand image
- Reduce document loss
- Reduce paper usage
- Reduced Cost/Income Ratio
- Reduce cost-to-serve
- Improve sales effectiveness
- Reduce failed client acquisitions
- Automate and accelerate processes to enhance operational efficiency and to reduce operational costs
Three key reasons for Financial Institutions to invest on digital customer onboarding:
- Customer expectations in a mobile-first era. Consumers are increasingly mobile-first and have already set the bar high in terms of their expectations as regards speed, convenience, and security. To win in this competitive landscape Financial Institutions must offer top class UX combined with robust evidence that security and privacy are paramount.
- Meeting regulatory requirements. As fraud becomes more and more sophisticated Financial Institutions may leverage RegTech solutions such as Digital ID to meet D verification regulation.
- Benefits in ROI and Operational Cost Savings. Digitisation of KYC capabilities may generate tangible cost savings for financial institutions, due to a significant reduction in manual verification processes.
Curently there are several “niche solutions” in RegTech ecosystem that offer both complete solutions (covering the customer’s entire onboarding process) and partial solutions (specific to a part of the process, i.e. Mifid).
Key findings
RegTech providers/solutions may help Financial Institution in meeting compliance adherence in an “agile way”. These tech – enabled solutions will deliver transformation of Regulatory Operations but in order to reach the full potential Financial Institutions must have the capabilities:
- to scan the ecosystem and choose the solution that best fits with their specific needs;
- to fully integrate the solution into the their organization (processes and IT systems).
Autori:
Piovan Diego– Partner Deloitte Risk Advisory
Pirondini David – Partner Deloitte Risk Advisory
Vidussi Alessandro – Partner Deloitte Consulting
Since the financial crisis, the euro area’s institutional architecture has evolved significantly…
https://www.ecb.europa.eu//press/key/date/2019/html/ecb.sp190704_1~c105b24fd6.en.html
They propose a simple framework to explain low global real risk-free interest rates…
Today’s updates include DVC data and calculations for the period 1 June 2018 to 31 May 2019 …
The deputy governor of the Bank of Japan, Masayoshi Amamiya, has warned that the creation of crypto by central banks…

L’iniziativa di Finriskalert.it “Il termometro dei mercati finanziari” vuole presentare un indicatore settimanale sul grado di turbolenza/tensione dei mercati finanziari, con particolare attenzione all’Italia.

Significato degli indicatori
- Rendimento borsa italiana: rendimento settimanale dell’indice della borsa italiana FTSEMIB;
- Volatilità implicita borsa italiana: volatilità implicita calcolata considerando le opzioni at-the-money sul FTSEMIB a 3 mesi;
- Future borsa italiana: valore del future sul FTSEMIB;
- CDS principali banche 10Ysub: CDS medio delle obbligazioni subordinate a 10 anni delle principali banche italiane (Unicredit, Intesa San Paolo, MPS, Banco BPM);
- Tasso di interesse ITA 2Y: tasso di interesse costruito sulla curva dei BTP con scadenza a due anni;
- Spread ITA 10Y/2Y : differenza del tasso di interesse dei BTP a 10 anni e a 2 anni;
- Rendimento borsa europea: rendimento settimanale dell’indice delle borse europee Eurostoxx;
- Volatilità implicita borsa europea: volatilità implicita calcolata sulle opzioni at-the-money sull’indice Eurostoxx a scadenza 3 mesi;
- Rendimento borsa ITA/Europa: differenza tra il rendimento settimanale della borsa italiana e quello delle borse europee, calcolato sugli indici FTSEMIB e Eurostoxx;
- Spread ITA/GER: differenza tra i tassi di interesse italiani e tedeschi a 10 anni;
- Spread EU/GER: differenza media tra i tassi di interesse dei principali paesi europei (Francia, Belgio, Spagna, Italia, Olanda) e quelli tedeschi a 10 anni;
- Euro/dollaro: tasso di cambio euro/dollaro;
- Spread US/GER 10Y: spread tra i tassi di interesse degli Stati Uniti e quelli tedeschi con scadenza 10 anni;
- Prezzo Oro: quotazione dell’oro (in USD)
- Spread 10Y/2Y Euro Swap Curve: differenza del tasso della curva EURO ZONE IRS 3M a 10Y e 2Y;
- Euribor 6M: tasso euribor a 6 mesi.
I colori sono assegnati in un’ottica VaR: se il valore riportato è superiore (inferiore) al quantile al 15%, il colore utilizzato è l’arancione. Se il valore riportato è superiore (inferiore) al quantile al 5% il colore utilizzato è il rosso. La banda (verso l’alto o verso il basso) viene selezionata, a seconda dell’indicatore, nella direzione dell’instabilità del mercato. I quantili vengono ricostruiti prendendo la serie storica di un anno di osservazioni: ad esempio, un valore in una casella rossa significa che appartiene al 5% dei valori meno positivi riscontrati nell’ultimo anno. Per le prime tre voci della sezione “Politica Monetaria”, le bande per definire il colore sono simmetriche (valori in positivo e in negativo). I dati riportati provengono dal database Thomson Reuters. Infine, la tendenza mostra la dinamica in atto e viene rappresentata dalle frecce: ↑,↓, ↔ indicano rispettivamente miglioramento, peggioramento, stabilità rispetto alla rilevazione precedente.
Disclaimer: Le informazioni contenute in questa pagina sono esclusivamente a scopo informativo e per uso personale. Le informazioni possono essere modificate da finriskalert.it in qualsiasi momento e senza preavviso. Finriskalert.it non può fornire alcuna garanzia in merito all’affidabilità, completezza, esattezza ed attualità dei dati riportati e, pertanto, non assume alcuna responsabilità per qualsiasi danno legato all’uso, proprio o improprio delle informazioni contenute in questa pagina. I contenuti presenti in questa pagina non devono in alcun modo essere intesi come consigli finanziari, economici, giuridici, fiscali o di altra natura e nessuna decisione d’investimento o qualsiasi altra decisione deve essere presa unicamente sulla base di questi dati.

Last 13.06.2019 EIOPA (European Insurance and Occupational Pensions Authority) and ECB (European Central Bank) published the Common Minimum Standards for Data Revisions agreed between themselves, the NSAs (National Supervisory Authorities) and the NCBs (National Central Banks).
Because of the integrated reported approach, Data Quality (DQ) is crucial in any data management process: data reported by the insurance undertakings are used by both NSAs in the review process, whose outcome is then submitted to EIOPA, and by most NCBs to fill in the insurance corporation statistics, delivered to the ECB. This leads to a need of a common understanding of the minimum level of DQ required.
By agreeing on common minimum standards, all authorities have aligned their expectations for the minimum acceptable level of DQ for the purposes of the different uses of data. The common minimum standards specify:
- The request of revision
- The synchronization
- The timeliness
- The explanatory notes and notices
- The need for historical revision
[1] The common minimum standards should not prevent stricter practices from being applied at national level: the NSAs/NCBs still have the responsibility and the power to request that financial institutions revise data when necessary. As the XBRL validations cannot cover all DQ issues, it may happen that, after deeper controls carried out by the insurance undertakings themselves, data may be occasionally submitted a second time. Resubmissions are divided into (a) “revisions” (if data points have changed) and (b) “duplications” (if there are no changes in the data points, but duplications have been fixed).
[2] The synchronisation states that the same data have to be available at all levels (i.e. financial institutions, NSAs/NCBs, EIOPA, ECB) at all times: it is important to keep consistency between EIOPA’s Central Repository, the ECB’s statistical databases and NSA/NCB databases. Any revision of data should be carried out at all levels of the transmission chain so that all parties involved have the same data. Data should not be unilaterally modified at the NCB or NCA level, unless in exceptional cases (identification of wrong data and impossibility to fix them by the financial institution due to time restrictions).
[3] NSAs and NCBs shall send the revisions respectively to EIOPA and the ECB in a timely manner, reducing time pressure for business users who need high-quality and stable data on specific dates. Specifically:
- NSAs shall send the data to EIOPA within 1 week from the receiving or according to established schedules, but at least once per month.
- NCBs shall send the data to ECB as quickly as possible and at maximum before the closing of the next production period
[4] NSAs and NCBs shall send a note explaining what trigger the revision of aggregated data in case of all non-routine revisions and significant routine revisions. In case of DQ issues reported by individual entities, the NSAs shall either use the erroneous flag available in the XML metadata file of the EIOPA Central Repository Specification or email EIOPA to informing of the need for revision.
[5] Back data should be revised at least as far back as technically possible, given the operational limitations of the data collection infrastructure, where an issue is identified and supposed to lead to significant revisions, which could also affect the past. Ә%