![Insights on debt sustainability analysis from an optimizing framework a cura di M. Athanasopoulou, A. Consiglio, A. Erce, A. Gavilan, E. Moshammer, and S.A. Zenios[1] ](https://www.finriskalert.it/wp-content/uploads/images-150x150.jpeg)
Introduction
Effective official sector surveillance and crisis lending depend upon an accurate assessment of debt sustainability. Debt sustainability analysis (DSA), aims precisely to detect and quantify any latent public debt risks (IMF 2013b), and, also, to determine the combination of official financing and adjustment measures that will bring a country’s debt to a sustainable level. The IMF’s exceptional access policy stipulates a debt restructuring delivering sufficient relief before the IMF can provide financing, if debt is not deemed sustainable with high probability.
The Greek debt crisis revealed two main concerns regarding the effectiveness of traditional DSA (Consiglio and Zenios 2015a, Zettelmeyer et al. 2016). First, around crisis episodes, uncertainty is high and focusing on average dynamics may conceal potential future risks. Second, as official lending has moved into addressing the problems of economies with large and liquid public bond markets, the traditional approach faces criticism that it neglects that sovereigns issue debt recurrently with the underlying debt management techniques (Guzman and Lombardi 2018, Corsetti et al. 2018).
To cope with uncertainty we need DSA tools that facilitates a view beyond mean value projections. IMF authors propose a ”fan-chart approach” to debt sustainability (Celasun et al., 2006), and Consiglio and Zenios (2015b) introduce the optimization of a measure of tail risk, arguing that ”the devil is in the tails”.
But the task at hand does not stop at estimating uncertainty. The public debt management offices actively manage public debt risks, for instance, by combining shorter and longer maturities, which can affect not only borrowing costs but also debt dynamics. Hence, debt flow dynamics become critical under the accommodative terms of the official help. For instance, IMF (2013a) and Grauwe (2015) find that the Greek debt could be considered sustainable under the official lending (concessional) conditions, but Consiglio and Zenios (2015a) show that sustainability is highly unlikely even under favourable (post-adjustment program) market conditions. Following intense debates with European institutions, the IMF changed the way it evaluates DSA (IMF 2013b), and is now advocating the setting of two limits: one on sovereign gross financing needs (an aggregate of a country’s primary balance, interest payments, and maturing debt), and a second on debt stock dynamics.
These developments in institutional policy bring to the frontline of DSA the flow features of debt. However, debt flows are critically affected by the sovereign’s issuance strategy which in turn affects debt stocks.
Standard DSA models largely ignore the funding strategy, and debt flows become less informative because they do not account for the debt managers’ impact on debt dynamics. There is a need for a DSA framework with elements of risk management that can quantify the trade-off between refinancing risks and debt costs – or, more broadly, between debt stock and flows. Such an enhanced framework can provide important insights and better inform policy.
In a recent working paper (Athanasopoulou et al., 2018) we tackle both issues by enriching the traditional DSA framework with an optimizing issuer operating in a risk environment. In this setting a government chooses the issuance strategy, from a set of different maturities, to minimize borrowing costs while controlling refinancing risks. This implies that reducing refinancing risks comes with longer maturities and, therefore, with higher costs that weigh on debt stock. This potential conflict between lower financing needs and higher debt costs unfolds through the funding strategy. In this framework we add constraints to incorporate into the tool the limits prescribed by IMF.[2] With this approach we ensure that debt levels and refinancing needs remain within acceptable levels, with high probability.
In this note we highlight the key insights from using our framework.
Optimizing debt sustainability analysis: features and lessons
The model we develop enriches the DSA framework by taking into account for the issuer’s optimizing behaviour, and adding constraints to limit the pace of debt stock reduction and the level of refinancing. These constraints incorporate the new critical elements of DSA analysis into our optimizing problem. Hence, the model integrates the current DSA practices with the debt financing decisions of the sovereign debt managers, and it does so within a risk framework accounting for uncertainty. Furthermore, we model the feedback loop between debt stock and refinancing rates that in turn feed back into debt stock (Gabriele, 2017).
The model uses scenario analysis. It builds on a long tradition of multi-period, multi-stage stochastic models, that find numerous applications in the risk management of large-financial institutions (Zenios and Ziemba 2007). Our work shows that this technology can be transposed into the context of sovereigns. This is especially relevant in light of the recent IMF suggestion that sovereigns should gauge the resilience of public finances, not just debt, to tail risks (IMF, 2018).
Skipping over technical details, we outline key features of our model:
- Scenario representation of macroeconomic, fiscal, and financial variables. The scenarios are calibrated to a country’s conditions and observed market data, using historical correlations. Interest rates are driven by a stochastic process of risk-free interest rates and the nonlinear feedback of the country’s debt level on its borrowing rates.
- Optimization of debt financing decisions to trade off debt financing cost with refinancing risks.
- Simultaneous tracking of debt stock and debt flow dynamics, identifying trade-offs within sustainability constraints.
- A measure of tail risk (Conditional Value-at-Risk, CVaR, of debt stock and/or debt flow) allows policymakers to draw conclusions with high confidence.
The key innovation is the ability to optimize debt financing decisions within a risk framework. This innovation is of critical importance for advanced economies, as these tend to have a rich debt issuance strategy. Our approach contrasts with traditional DSA approaches where debt refinancing is normally exogenously assumed to happen with a fixed (usually, five-year) maturity. The model parametrizes the refinancing risk tolerance with a value (omega) on the tail risk measure of gross financing needs,. Higher values of omega imply a higher refinancing risk. Assuming that 5% is the acceptable confidence level for the policymakers, we see solutions such that the top 5% of outcomes have gross financing needs (as percent of GDP) smaller than omega .
We highlight two key lessons from applying the model to a realistic economy.
- Risk management for debt financing comes at a cost
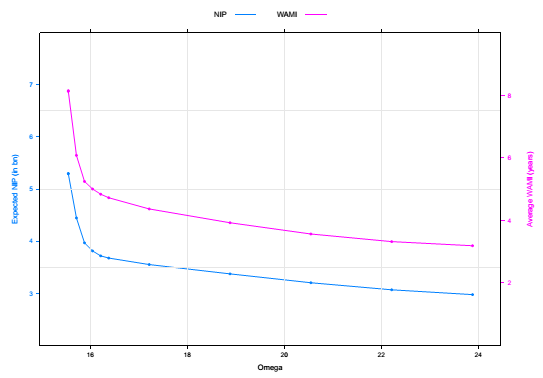
Figure 1 shows expected interest payments for different levels of risk (omega). We observe that higher refinancing risk implies lower expected interest payments. The same figure also shows the weighted average maturity of issued debt, and we observe that risk averse sovereigns should choose issuance strategies that resort more often to long-term financing instruments. Those, however, are more expensive. Likewise, we observe a shift from long-term to short-term issuance as risk tolerance increases. This shift creates even greater risks when a country is in trouble. Our model captures the “gambling for redemption” effect of what Conesa and Kehoe (2015) for high risk countries.
- Trading off debt flow and stock dynamics
Our simulations reveal also a trade-off between the dynamics of gross financing needs and those of debt stocks. Average debt stock and gross financing needs, under the optimal issuance strategy, move in opposite directions as we change the acceptable level of risk. The fan charts in Figures 2(a) and 2(b) clearly make the point for two different values of risk (high in blue, low in red).
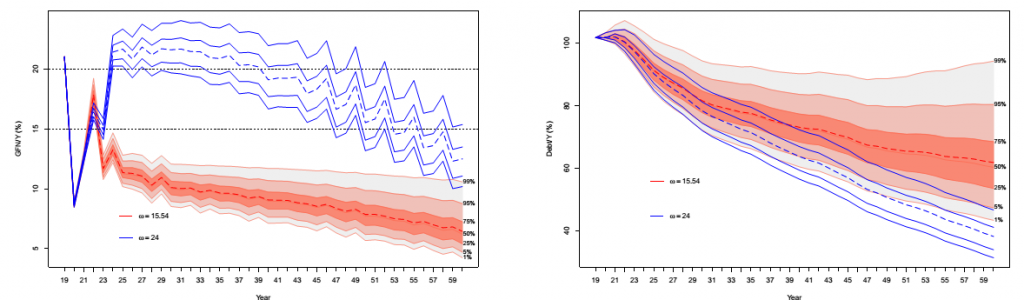
Figure 2: Gross financing needs and debt stock move in opposite directions as we change the risk tolerance
An important value-added of our model is that it quantifies this trade-off in both temporal and stochastic dimensions. Reducing refinancing risks is always desirable, but at what point does this become too costly? How much should a Treasury increase the weighted average maturity of its issuances to reduce tail refinancing risks by 1%? The relationship between these variables is nonlinear and addressing these questions without a rich and realistic quantitative tool can generate misleading policy advice. The model provides important insights into these issues.
Are the solutions relevant?
The trade-offs we identified are pertinent for policymakers only to the extend they have significant quantitative effects. For our (realistic) calibrated economy, we find that reducing risk from a relatively high level to the lowest attainable level implies about a 5-year increase in the weighted average maturity of issued debt and an increase in the effective interest rates of 0.8% on average. Consistent with these effects, gross financing needs drop by about 8% while debt deteriorates by 9%. Such numbers are significant for any sovereign and in case of crisis countries can make the difference between sustainability or not. We also found that the sensitivity of solution to the level of acceptable risk increases with the initial stock of debt and with shorter debt maturities, so the model is more effective for countries that are in, or approaching, a crisis situation.
Conclusions
Our model quantifies the trade-off between debt stocks and debt flows and makes clear the relevant risks by optimizing the debt financing decisions. This framework allows us to provide, among other matters, answers to three important policy questions:
- What are the costs and benefits of reducing refinancing risks?
- What are the minimum refinancing risks to be faced for a given level of debt reduction?
- What is the size and timing for reducing financing needs to preserve a specific level of refinancing risks, while targeting a specific amount of debt reduction?
When calibrated to a specific economy, this model can answer these questions. Our framework offers policymakers the ability to refine their assessment of alternative policies on future debt dynamics. Our approach also adds new risk factors that enrich the standard assessments by evaluating refinancing risks and the relevant costs for reducing them.
References
M. Athanasopoulou, A. Consiglio, A. Erce, A. Gavilan, E. Moshammer, and S.A. Zenios. Risk management for sovereign financing within a debt sustainability framework. Working Paper 31, European Stability Mechanism, Luxembourg, 2018.
O. Celasun, X. Debran, and J.D. Ostry. Primary surplus behaviour and risks to fiscal sustainability in emerging market countries: A “fan-chart” approach. Working Paper 06/67, International Monetary Fund, Washington, DC, 2006.
J.C. Conesa and T.J. Kehoe. Gambling for redemption and self-fulfilling debt crises. Research Department Staff Report 465, Federal Reserve Bank of Minneapolis, 2015.
A. Consiglio and S.A. Zenios. Risk management optimization for sovereign debt restructuring. Journal of Globalization and Development, 6(2):181–214, 2015a.
A. Consiglio, and S.A. Zenios. Greek debt sustainability: The devil is in the tails. VOX, CEPR’s Policy Portal, August 2015b.
G. Corsetti, A. Erce, and T. Uy. Debt Sustainability and the Terms of Official Support, ADEMU Working Papers, 2018.
P. De Grauwe. Greece is solvent but illiquid: Policy implications. VOX, CEPR’s Policy Portal, July 2015.
C. Gabriele, M. Athanasopoulou, A. Erce, and J. Rojas. Debt stocks meets gross financing needs: A flow perspective into sustainability. Working Paper Series No. 24, European Stability Mechanism, Luxembourg, 2017.
M. Guzman and D. Lombardi. Assessing the appropriate size of relief in sovereign debt restructuring. Research Paper 18-9, Columbia Business School, New York, NY, 2018.
IMF, Greece: Ex-post Evaluation of Exceptional Access under the 2010 Stand-By Arrangement, International Monetary Fund, 2013a.
IMF, Staff Guidance Note for Public Debt Sustainability Analysis in Market-Access Countries, International Monetary Fund, 2013b.
IMF, Fiscal Monitor: Managing public wealth, International Monetary Fund, 2018.
J. Zettelmeyer, E. Kreplin, and U. Panizza. Does Greece Need More Official Debt Relief? If So, How Much?, Peterson Institute for International Economics, Working Paper 17-6, 2017.
S.A.
Zenios and W.T. Ziemba, editors.
Handbook of Asset and Liability Management. Vol. 1. Theory and Methodology and
Vol. 2 Applications and Case Studies.
Handbooks in Finance, 2007.
[1] The views expressed herein are those of the authors and do not necessarily represent those of the ESM or ESM policy.
M. Athanasopoulou, A. Erce, A. Gavilan and E. Moshammer are with the European Stability Mechanism, Luxembourg. A. Consiglio is with the University of Palermo, Palermo, Italy. S.A. Zenios is with the University of Cyprus, Nicosia, CY, Non-Resident Fellow, Bruegel, Brussels, and Senior Fellow, Wharton Financial Institutions Center, University of Pennsylvania, USA.
[2] Within the IMF framework, limits for gross financing needs are set at 15% of GDP for emerging economies and 20% for advanced countries.