Digital Transformation has led to significant changes in
all business models and sectors, particularly in the financial industry. New technologies and new methodologies are
changing the way to do business.
Today, it is necessary
to shift perspective and update one’s
specific skillset: to accomplish this task, the Politecnico di MilanoGraduate
School of Business has developed a highly professional training programme which
is able to respond in a timely manner to the needs of the market.
The International Master in Fintech, Finance and Digital Innovationis the programme developed by MIP Politecnico di Milano, in cooperation with the Department of Mathematics, the Department ofManagementEngineering and the Department of Electronics, Information and Bioengineering of the Politecnico di Milano, to provide all the skills and competencies needed to face the Fintech revolution.
The 12-month Master, entirely taught in English, offers a comprehensive education in finance and an in-depth understanding of digital technologies and their applications in the financial sector (banking, insurance companies, asset management). The programme targets young graduates who want to specialise in the Fintech area and its aim is to train professionals to be able to understand and manage the digital transformation, building on their different skills and capabilities. The Master builds on the collaboration with our partners from the financial industry –Aviva, Deloitte, Fabrick Spa, IBM and Intesa Sanpaolo Group – in order to combine theoretical competencies on methods and technologies with the expertise of the financial world and Fintech applications. The Master also boasts the cooperation with Fintech companies such as Moneyfarm, Net Insurance and ZeroKMFinance.
The programme
is structured in three building blocks, designed to guide all participants through
a learning funnel that enables the attainment of an in-depth understanding of the
Fintech revolution. Starting from a strong basis in Finance,
InformationTechnology, ComputerProgramming and Quantitative Finance, students will understand the foundations of the
Fintech ecosystem. The Master then covers digital innovation technologies that
play a preeminent role in Fintech, such as big data, cybersecurity, distributed
ledger technologies, smart contracts, blockchain, machine learning, natural
language processing and data visualisation. Finally, the programme enters into
the Fintech domain, analysing how these technologies/methodologies can
transform classical intermediation activity and how they can disintermediate traditional
players in a peer-to-peer perspective.
To learn more about the Master, visit the MIP website and discover how to
improve your skills and give the right direction to your career in the Fintech
sector:
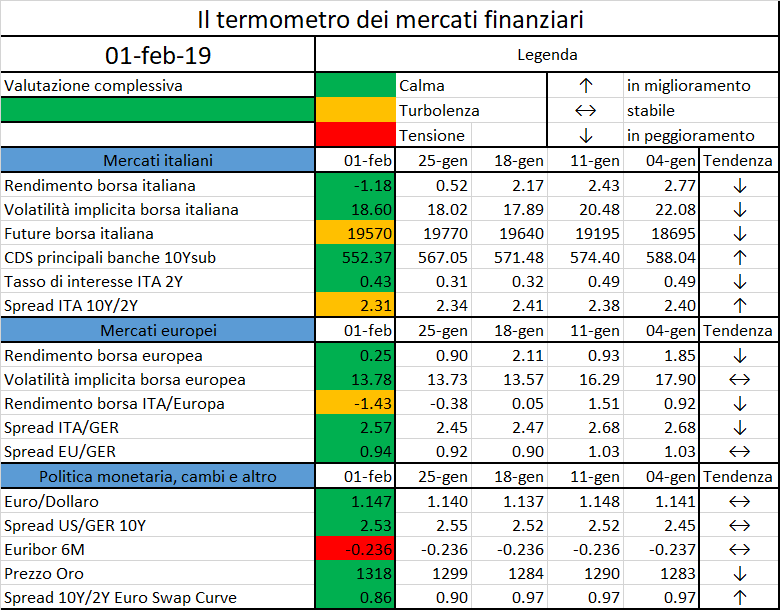
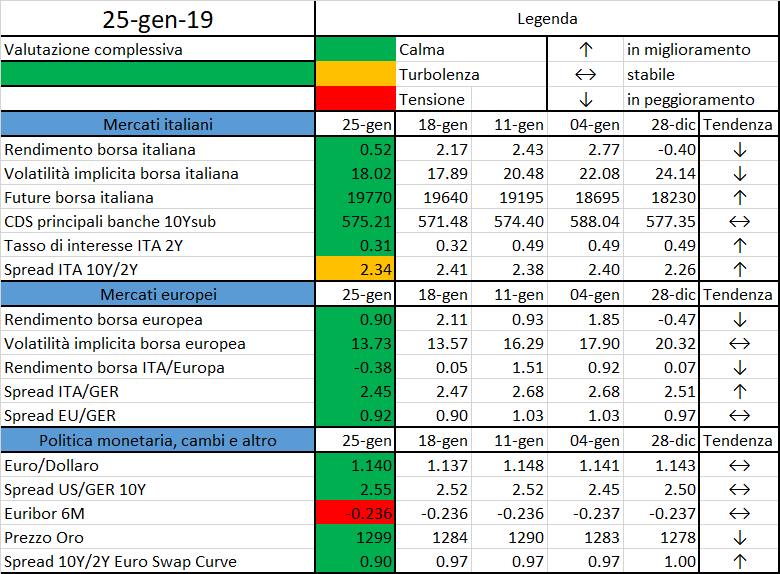
L’iniziativa di Finriskalert.it “Il termometro dei mercati finanziari” vuole presentare un indicatore settimanale sul grado di turbolenza/tensione dei mercati finanziari, con particolare attenzione all’Italia.
Significato degli indicatori
Rendimento borsa italiana: rendimento settimanale dell’indice della borsa italiana FTSEMIB;
Volatilità implicita borsa italiana: volatilità implicita calcolata considerando le opzioni at-the-money sul FTSEMIB a 3 mesi;
Future borsa italiana: valore del future sul FTSEMIB;
CDS principali banche 10Ysub: CDS medio delle obbligazioni subordinate a 10 anni delle principali banche italiane (Unicredit, Intesa San Paolo, MPS, Banco BPM);
Tasso di interesse ITA 2Y: tasso di interesse costruito sulla curva dei BTP con scadenza a due anni;
Spread ITA 10Y/2Y : differenza del tasso di interesse dei BTP a 10 anni e a 2 anni;
Rendimento borsa europea: rendimento settimanale dell’indice delle borse europee Eurostoxx;
Volatilità implicita borsa europea: volatilità implicita calcolata sulle opzioni at-the-money sull’indice Eurostoxx a scadenza 3 mesi;
Rendimento borsa ITA/Europa: differenza tra il rendimento settimanale della borsa italiana e quello delle borse europee, calcolato sugli indici FTSEMIB e Eurostoxx;
Spread ITA/GER: differenza tra i tassi di interesse italiani e tedeschi a 10 anni;
Spread EU/GER: differenza media tra i tassi di interesse dei principali paesi europei (Francia, Belgio, Spagna, Italia, Olanda) e quelli tedeschi a 10 anni;
Euro/dollaro: tasso di cambio euro/dollaro;
Spread US/GER 10Y: spread tra i tassi di interesse degli Stati Uniti e quelli tedeschi con scadenza 10 anni;
Prezzo Oro: quotazione dell’oro (in USD)
Spread 10Y/2Y Euro Swap Curve: differenza del tasso della curva EURO ZONE IRS 3M a 10Y e 2Y;
Euribor 6M: tasso euribor a 6 mesi.
I colori sono assegnati in un’ottica VaR: se il valore riportato è superiore (inferiore) al quantile al 15%, il colore utilizzato è l’arancione. Se il valore riportato è superiore (inferiore) al quantile al 5% il colore utilizzato è il rosso. La banda (verso l’alto o verso il basso) viene selezionata, a seconda dell’indicatore, nella direzione dell’instabilità del mercato. I quantili vengono ricostruiti prendendo la serie storica di un anno di osservazioni: ad esempio, un valore in una casella rossa significa che appartiene al 5% dei valori meno positivi riscontrati nell’ultimo anno. Per le prime tre voci della sezione “Politica Monetaria”, le bande per definire il colore sono simmetriche (valori in positivo e in negativo). I dati riportati provengono dal database Thomson Reuters. Infine, la tendenza mostra la dinamica in atto e viene rappresentata dalle frecce: ↑,↓, ↔ indicano rispettivamente miglioramento, peggioramento, stabilità rispetto alla rilevazione precedente.
Disclaimer: Le informazioni contenute in questa pagina sono esclusivamente a scopo informativo e per uso personale. Le informazioni possono essere modificate da finriskalert.it in qualsiasi momento e senza preavviso. Finriskalert.it non può fornire alcuna garanzia in merito all’affidabilità, completezza, esattezza ed attualità dei dati riportati e, pertanto, non assume alcuna responsabilità per qualsiasi danno legato all’uso, proprio o improprio delle informazioni contenute in questa pagina. I contenuti presenti in questa pagina non devono in alcun modo essere intesi come consigli finanziari, economici, giuridici, fiscali o di altra natura e nessuna decisione d’investimento o qualsiasi altra decisione deve essere presa unicamente sulla base di questi dati.
Tra le “buzzword” del momento, troviamo certamente
“robo-for-advisor”. Ovvero strumenti d’analisi e costruzione di portafoglio in
dotazione ai relationship manager. È tecnologia a supporto del professionista:
lo potenzia, a tutto beneficio di produttività e qualità del servizio al
cliente. Sembra essere il connubio uomo-tecnologia ottimale, visto che i
roboadvisor puri sono relegati a una nicchia di mercato destinata a rimanere
tale per un po’ e visto che “the human touch” sembrerebbe ineliminabile, almeno
per ora.
Bello, in teoria.
In pratica, però, ho notato che svariate
istituzioni finanziarie sono rimaste un filo indietro. E così sono corse ai
ripari, magari sulla spinta delle reti, dotando in fretta e furia i loro relationship
manager – ossia private banker, consulenti finanziari dipendenti e
indipendenti, operatori di filiale – di strumenti di portfolio construction. Ne
ho visto diversi, buoni e meno buoni. Molti soffrono di un (antico) problema
sul quale mi sento di condividere alcune riflessioni.
Un antico tormentone
Il problema, che riemerge periodicamente (accadde
già con la prima ondata di roboadvisor), è che gran parte di questi sistemi di
robo-for-advisor si basano sull’applicazione naïve della Modern Portfolio
Theory di Markowitz, in breve naïve-Markowitz.
È inquietante osservare come, a sprezzo di circa
trent’anni di ricerca accademica, l’Homo sapiens riesca ad essere così superficiale
da trasformare in pattume pseudoscientifico un’idea illuminante e geniale – in
questo caso quella seminale di Harry Markowitz, che consisteva nel ricercare
esplicitamente il trade-off tra rischio e rendimento, facendo tesoro di tecniche
di programmazione matematica. Purtroppo, il naïve-Markowitz è invece metodologicamente
agghiacciante, nonché praticamente pericoloso per i clienti, per i
professionisti e per la reputazione delle azienda. Vediamo perché.
L’inghippo è che il processo naïve-Markowitz è semplice,
ma dall’apparenza scientifica: si definisce l’universo investibile (asset
class, fondi, etf, ecc), si prende qualche anno di serie storiche, se ne ignora
bellamente la distribuzione di probabilità empirica, ipotizzando invece che sia
gaussiana, poi si stimano a massima verosimiglianza dalla storia i parametri
(matrice di covarianza e vettore delle medie), si sbatte tutto in un risolutore
per problemi di programmazione quadratica, infine si pigia il bottone. Et voilà!
S’ottiene la mitica frontiera efficiente dei portafogli, con tanto di curva scenografica
e rendimenti attesi specificati al secondo numero decimale, magari anche al
terzo, a seconda del software.
C’è però un problema: quei portafogli non hanno
senso. Se non per caso. Letteralmente: i pesi di portafoglio sono de facto
casuali.
Questo perché l’errore di stima dei parametri è
tipicamente di tipo “monster[1]”. Inoltre i portafogli si
fondano su una storia che probabilmente non si verificherà più. Infine, le
ipotesi sottostanti sono lontane dalla realtà (i rendimenti arcinotoriamente non
seguono affatto una distribuzione gaussiana e i parametri del “data generation
process” non restano costanti nel tempo) – ma questo, lasciatemi dire, è il
minore dei mali.
È intuitivo che, là fuori nel mondo reale, siffatti
portafogli qualche problema siano destinati ad averlo. Così, alle prime legnate
prese dai mercati, tutto sembrerà assai meno scientifico, tra le belluine proteste
di clienti e le lamentele dei consulenti (“il sistema di robo-for-advisor non
funziona”).
Sospetto che molti di voi ritengano che mi stia
arrovellando intorno a una sottile questione tecnica, irrilevante nella
pratica. Niente di più sbagliato: è sì una questione tecnica, ma tra poco,
numeri alla mano, vi mostrerò la vastità del problema nella pratica. Cioè gli
impatti di business.
In ogni caso, alla radice del problema non c’è la
sfortuna dell’investitore e del suo consulente, bensì il “butterfly effect,
cioè l’effetto farfalla, ben noto a priori se uno .
The butterfly effect
Si tratta di un rimarchevole concetto nativo della
teoria del caos e dei sistemi complessi. L’idea, che probabilmente conoscete, è
espressa coereograficamente così: un batter d’ali di una farfalla in Brasile
può causare una catena di eventi nell’atmosfera tali da provocare un tornado in
Texas. Generalizzando, piccole variazioni nelle variabili di un sistema possono
arrivare a causare grandi effetti.
È proprio ciò che capita con i modelli
naïve-Markowitz: gli errori nella stima degli input si fanno strada negli
algoritmi che portano all’asset allocation finale, crescono e finiscono con
avere un impatto enorme, tale da inficiare del tutto la validità dell’output. Tanto
che l’applicazione del naïve Markowitz è nota come “maximization error model”. Siccome
l’idea è un po’ cerebrale, tocchiamola con mano grazie ad un esempietto
numerico.
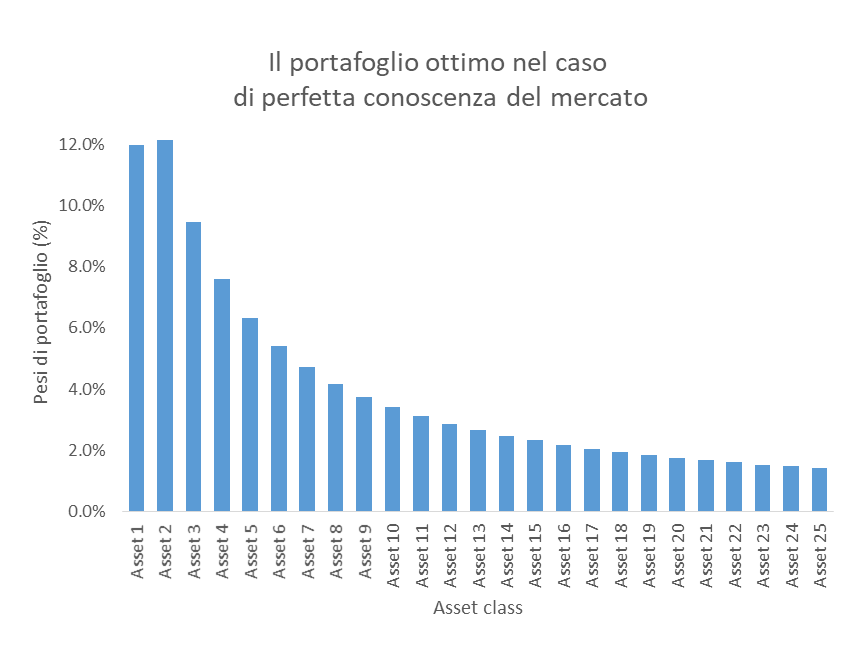
Immaginate di essere il dio dei mercati finanziari.
Considerate 25 asset class, per le quali bonariamente imponete che la
distribuzione di probabilità dei log-rendimenti mensili sia gaussiana, con
volatilità crescente da 1% a 25% e Sharpe ratio pari a 0.3 per tutte le asset
class, matrice di covarianza a correlazione costante (ipotesi utili per creare un esempio ragionevole e comprensibile,
nient’altro).
In queste condizioni, per un profilo di rischio
medio, un portafoglio “ottimo” long-only secondo il modello naïve Markowitz ha
i pesi delle varie asset class (ordinate in funzione della volatilità) mostrati
nella figura seguente.
Già ad occhio il portafoglio sembra piuttosto
ragionevole: i pesi sono ben distribuiti, le attività meno rischiose pesano di
più (rammento che è un portafoglio a rischio medio), circa il 50% del
portafoglio, mentre gli attivi più volatili cubano per un 20% circa. L’indice
di diversificazione è 96%, altissimo.
In questo mondo immaginario questa è la verità
assoluta, perché non c’è alcun errore di specificazione, legato alla scelta del
modello, né errore di misura (stima) dei parametri: siamo di fronte al “vero”
portafoglio ottimo.
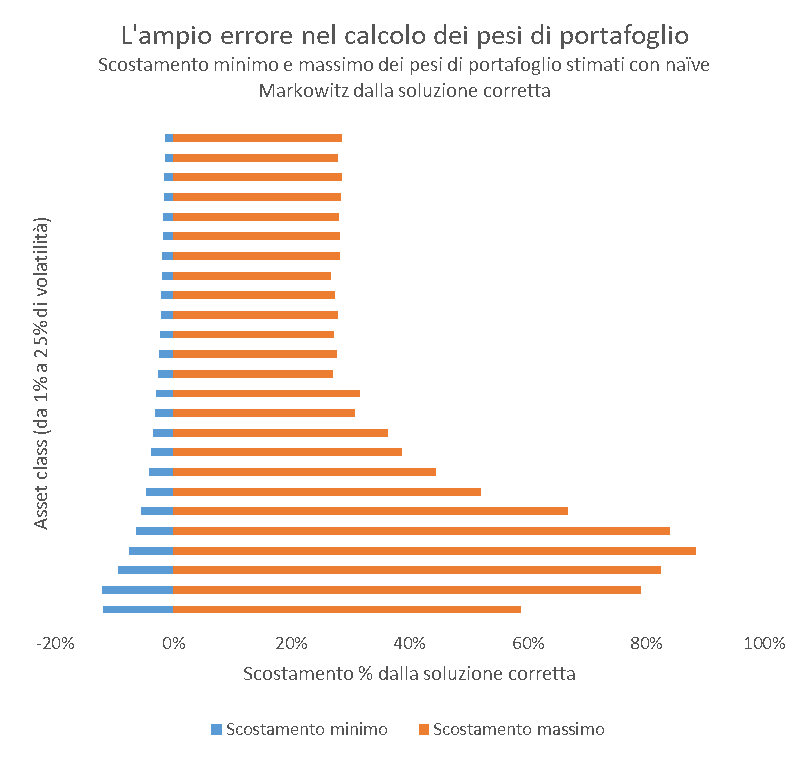
Ora cambiamo prospettiva: siete un sistema di robo-for-advisory
al quale viene dato in pasto un campione di cinque anni di dati generati dalla
distribuzione di probabilità di cui sopra, quella del dio del mercato. Date le
ipotesi, si può dimostrare come l’errore di specificazione del modello sia pari
a zero. C’è solo errore di misura, puro errore campionario. Calcolate di nuovo
i pesi ottimali secondo naïve Markowitz e li mettete da parte.
Poi, come in preda a un rewind temporale, vi
vengono forniti altri 5 anni di dati generati sempre dalla stessa distribuzione
multivariata. Un altro campione. Un altro “mondo possibile”. E così ripetete
l’esercizio.
E ancora, per 10mila volte, 10mila scenari
possibili.
Ora vediamo nel grafico seguente quanto si scostano
i pesi di portafoglio stimati da quelli veri: per ogni asset class riporto
l’intervallo che contiene gli estremi di variazione degli scostamenti. L’errore
commesso rispetto al portafoglio “del dio” varia allegramente dal -12% a poco
meno del 90%. L’indice di diversificazione di questi portafiogli ha valore
mediano pari a 35% (rammneto che quello “vero” è 96%), il che vuol dire che l’idea
stessa di diversificazione è largamente compromessa.
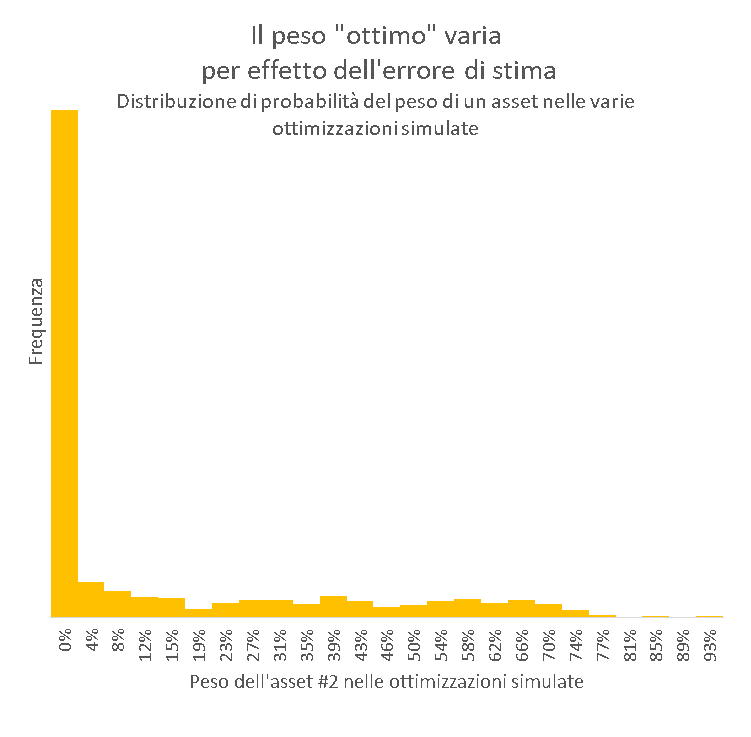
Se consideriamo per esempio l’asset 2 (a basso
rischio, con volatilità 2% e rendimento atteso 0.6%), nel portafoglio ottimo
“vero” il peso è 12%. Guardate invece come oscilla nelle varie
ottimizzazioni fatte dal robo-for-advisor: assume sovente valore 0%, e
qualsiasi valore ammissibile, arrivando anche a dominare il portafoglio. Non
stupisce che la diversificazione vada gambe all’aria.
Penso vi sia chiara la madornale portata
dell’errore associato al naïve Markowitz e la ragione dell’appellativo
“maximization error model”: l’errore di stima genera portafogli casuali come
quelli che potrebbe generare una scimmia. Non si tratta di mancanza di finezza
matematico-statistica. No. Si tratta di risultati casuali e instabili (per chi
è matematicamente orientato, per avere un’idea analitica dell’instabilità basta
dare un’occhiata alla matrice jacobiana contenente tutte le derivate parziali
dei pesi ottimi nella soluzione in forma chiusa di Markowitz, cioè w*, rispetto
al rendimento atteso m, ossia ∂w*/∂m).
Numeri spesso lontanissimi dalla vera soluzione ottima e quindi praticamente
privi di valore. Classico “garbage-in, garbage-out”.
E considerate che la realtà è ben peggiore di così:
nell’esempio c’è solo e soltanto l’errore legato alla stima campionaria, mentre
nella pratica c’è anche un sostanzioso errore legato alla specificazione del
modello, al quale s’aggiunge il fatto che i parametri di mercato cambiano di
continuo.
Spero sia ora evidente quale immensa idiozia siano
quelle belle frontiere efficienti e quei rendimenti attesi specificati al
secondo decimale.
Utilizzare naïve Markowitz così – proprio ciò che stanno
facendo con entusiasmo molti consulenti finanziari e private banker – alla fine
della fiera porterà a una sola cosa: una disastro, per di più non facilmente
spiegabile al cliente.
E quando si verificheranno i disastri, di chi sarà
la colpa? Del roboadvisor/motore di portfolio construction in primis, in solido
con il consulente che ci mette la faccia e con la casa madre che ha messo in
piedi il baraccone. Un bel rischio operativo.
Soluzioni?
C’è una buona notizia: si può evitare di sprecare budget
in una raffinata macchina per produrre spazzatura finanziaria e dare invece qualche
strumento agli advisor.
I meta-ingredienti occorrenti sono due:
una metodologia, che non può essere un singolo
modello one-size-fits-all, bensì una “ricetta d’investimento” fatta di una
combinazione di metodi di portfolio construction e stimatori robusti, inseriti
in un processo d’investimento razionale, disciplinato e finanziariamente ben
fondato, con uno storytelling chiaro nel confronti del cliente;
un governo centrale e competente del processo, che
parta dalla casa madre. Senza un metodo solido e un presidio forte sulla
costruzione dei portafogli è inevitabile che qualche consulente finanziario o
private banker con l’indole del Warren Buffet della Brianza o del Ray Dalio della
Ciociaria prima o poi combinerà qualche disastro.
Non è difficile fare le cose per bene. Occorre solo
conoscenza di processo e un po’ di know-how teorico-pratico di modellizzazione statistica
e finanziaria che vada oltre Markowitz e uno scolastico Black-Litterman. Sfortunatamente,
sembra che non poche organizzazioni ne siano sprovviste.
[1] Questo problema è ampiamente riconosciuto e studiato, sia
teoricamente che empiricamente; si vedano, tra i molti, Best e Grauer (1991), “On the Sensitivity of
Mean Variance Efficient Portfolios to Changes in Asset Means: Some Analytical
and Computational Results”, Review of Financial Studies, nonché Chopra e Ziemba
(19939, “The Effects of Errors in Means, Variances and Covariances on Optimal
Portfolio Choice”, Journal of Portfolio Management.
Credit terms tightened for all counterparts, but non-price terms offered to hedge funds remained stable
Banks and dealers increased resources and attention dedicated to managing concentrated credit exposures
Liquidity and general trading conditions for underlying collateral deteriorated slightly, following improvement recorded in previous survey
Reduction in market-making activities was particularly visible for other government, sub-national and supra-national bonds, high-quality financial corporate bonds and derivatives
Credit terms offered to almost all counterparties, both in the provision of finance collateralised by euro-denominated securities and in over-the-counter (OTC) derivatives markets, became somewhat less favourable between September 2018 and November 2018. Non-price terms for hedge funds were the only component that remained stable. Looking ahead, a small net percentage of respondents now expect price terms to ease for most counterparty types. Non-price terms are expected to remain stable, although some tightening is expected for insurance companies, non-financial corporations and investment funds. Survey respondents further increased the resources and attention they dedicate to managing concentrated credit exposures both to central counterparties and to banks and dealers.
Switzerland-based crypto hardware wallet maker Tangem says it has been selected by the Republic of the Marshall Islands to produce the “physical blockchain notes” for the nation’s planned national digital currency.
Tangem announced the news Monday, saying the blockchain notes will be used to store the republic’s Sovereign (SOV) digital currency, which is being launched as an alternative legal tender in the country. Once issued, the SOV will be officially accepted alongside the U.S. dollar.
L’iniziativa di Finriskalert.it “Il termometro dei mercati finanziari” vuole presentare un indicatore settimanale sul grado di turbolenza/tensione dei mercati finanziari, con particolare attenzione all’Italia.
Significato degli indicatori
Rendimento borsa italiana: rendimento settimanale dell’indice della borsa italiana FTSEMIB;
Volatilità implicita borsa italiana: volatilità implicita calcolata considerando le opzioni at-the-money sul FTSEMIB a 3 mesi;
Future borsa italiana: valore del future sul FTSEMIB;
CDS principali banche 10Ysub: CDS medio delle obbligazioni subordinate a 10 anni delle principali banche italiane (Unicredit, Intesa San Paolo, MPS, Banco BPM);
Tasso di interesse ITA 2Y: tasso di interesse costruito sulla curva dei BTP con scadenza a due anni;
Spread ITA 10Y/2Y : differenza del tasso di interesse dei BTP a 10 anni e a 2 anni;
Rendimento borsa europea: rendimento settimanale dell’indice delle borse europee Eurostoxx;
Volatilità implicita borsa europea: volatilità implicita calcolata sulle opzioni at-the-money sull’indice Eurostoxx a scadenza 3 mesi;
Rendimento borsa ITA/Europa: differenza tra il rendimento settimanale della borsa italiana e quello delle borse europee, calcolato sugli indici FTSEMIB e Eurostoxx;
Spread ITA/GER: differenza tra i tassi di interesse italiani e tedeschi a 10 anni;
Spread EU/GER: differenza media tra i tassi di interesse dei principali paesi europei (Francia, Belgio, Spagna, Italia, Olanda) e quelli tedeschi a 10 anni;
Euro/dollaro: tasso di cambio euro/dollaro;
Spread US/GER 10Y: spread tra i tassi di interesse degli Stati Uniti e quelli tedeschi con scadenza 10 anni;
Prezzo Oro: quotazione dell’oro (in USD)
Spread 10Y/2Y Euro Swap Curve: differenza del tasso della curva EURO ZONE IRS 3M a 10Y e 2Y;
Euribor 6M: tasso euribor a 6 mesi.
I colori sono assegnati in un’ottica VaR: se il valore riportato è superiore (inferiore) al quantile al 15%, il colore utilizzato è l’arancione. Se il valore riportato è superiore (inferiore) al quantile al 5% il colore utilizzato è il rosso. La banda (verso l’alto o verso il basso) viene selezionata, a seconda dell’indicatore, nella direzione dell’instabilità del mercato. I quantili vengono ricostruiti prendendo la serie storica di un anno di osservazioni: ad esempio, un valore in una casella rossa significa che appartiene al 5% dei valori meno positivi riscontrati nell’ultimo anno. Per le prime tre voci della sezione “Politica Monetaria”, le bande per definire il colore sono simmetriche (valori in positivo e in negativo). I dati riportati provengono dal database Thomson Reuters. Infine, la tendenza mostra la dinamica in atto e viene rappresentata dalle frecce: ↑,↓, ↔ indicano rispettivamente miglioramento, peggioramento, stabilità rispetto alla rilevazione precedente.
Disclaimer: Le informazioni contenute in questa pagina sono esclusivamente a scopo informativo e per uso personale. Le informazioni possono essere modificate da finriskalert.it in qualsiasi momento e senza preavviso. Finriskalert.it non può fornire alcuna garanzia in merito all’affidabilità, completezza, esattezza ed attualità dei dati riportati e, pertanto, non assume alcuna responsabilità per qualsiasi danno legato all’uso, proprio o improprio delle informazioni contenute in questa pagina. I contenuti presenti in questa pagina non devono in alcun modo essere intesi come consigli finanziari, economici, giuridici, fiscali o di altra natura e nessuna decisione d’investimento o qualsiasi altra decisione deve essere presa unicamente sulla base di questi dati.
Developed and deep capital markets can play a key role in financing economic growth
as well as influencing financial stability and the transmission of monetary policy. As
economies develop and investment projects become larger and more complex,
efficient resource allocation and risk-sharing are facilitated by the information
aggregation activity and variety of financial claims provided by capital markets.
Moreover, capital markets have played an important role in financing the recovery
from the Great Financial Crisis (GFC), a reminder of their “spare tyre” role in the
financial system.
Consistent with the mandate of the Committee on the Global Financial System to further the understanding of financial markets’ underpinnings and promote improvements to their functioning and stability, this report assesses recent trends in capital market development and identifies both key drivers in the enabling environment and other factors more specific to capital market functions. It concludes by providing policy recommendations that aim to enhance the effectiveness of capital markets in serving the real economy. The breadth of the recommendations reflects the broader role of central banks in promoting capital market development in addition to their direct regulatory responsibilities.
There still remain significant differences in the size of capital markets across
economies. Indicatively, the largest equity, government bond and corporate bond
markets relative to GDP in advanced economies (AEs) are approximately twice the
size of those at the 75th percentile, which in turn are twice the size of those at the
25th percentile. A similar pattern holds across markets in emerging market economies
(EMEs).
Fixed income markets have seen strong growth over the past two decades,
bringing current amounts outstanding closer to equity market capitalisation. In terms
of market functioning, market participants report the least concerns about
government securities markets and the greatest concerns about markets for
corporate bonds, with equities somewhere in between.
EME capital markets are catching up, but a gap relative to AE markets remains.
In EME government securities markets, the instrument mix and liquidity have
improved. At the same time, EME corporate securities markets have experienced a
broad deepening. However, they remain on average smaller than those in AEs and
their growth has been somewhat flattered by issuances from state-owned firms and
companies with large insider holdings. Moreover, EME corporates still have less
access to longer-maturity, local currency debt securities; and compared with AEs,
fewer small firms access EME equity markets. Overall, EME markets still appear less
resilient to volatility than AE markets.
This diversity in capital market development across AEs and EMEs and capital markets’ evolution over time is explained by a number of factors. Underlying much of the heterogeneity in capital market development are differences in the strength of the enabling environment. An environment of low and stable inflation and sustainable fiscal management contributes to lowering the costs of capital market finance for both public and private sector issuers. Market autonomy to determine allocations, free from repressive policies such as excessive requirements to hold government securities or paternalistic management of stock prices through initial public offering (IPO) quotas, facilitates information creation and investor base diversity.
A supportive legal environment ensures the efficient and fair enforcement of arm’s length financial contracts and transactions, while efficient and predictable insolvency regimes provide greater assurance about the recovery value of distressed assets. Finally, independent regulators with well defined objectives, adequate resources and credible enforcement powers are better able to protect investors, lower issuance costs and ensure that capital markets are fair, effective and transparent.
Beyond the enabling environment, there are other drivers which are more closely linked to capital market-specific functions. High quality and timely information is the lifeblood of effective and viable capital markets. Thus, the provision of high-quality information at low cost through well developed disclosure regimes gives investors the means to value securities. A broad and diversified investor base provides a source of stable demand that supports liquidity, depth and stability. Greater bi-directional openness to international investors and issuers expands the pool of savings and investment products as well as promoting implementation of international best practices and standards.
But openness may also increase the sensitivity of domestic capital markets to global spillovers. Deeper complementary markets such as those for derivative, repo and securities lending spur liquidity and broader participation by facilitating the hedging and funding of capital market positions. Finally, robust and efficient market infrastructures with fair and open access boost liquidity by making it safer and cheaper to trade, hold and value capital market securities.
The report concludes with six broad policy recommendations. The relevance of
these policy takeaways varies by economy, and some of them fall outside direct
central bank control. Nevertheless, they impact the vibrancy of capital markets and
central banks’ ability to meet their objectives. The broad range of drivers identified
also suggests that comprehensive initiatives that take into account the range of
dimensions identified are likely to prove more successful in developing viable capital
markets.
First, greater market autonomy would enhance capital market pricing and
funding allocations. In particular, policymakers need to address vestiges of financially
repressive policies and fix market failures. These include policies that create
preferential financing terms for the public sector as well as paternalistic policies that
override private allocations. In many cases, repressive measures exacerbate market
volatility by reducing investor diversity and suppressing securities issuance.
Second, capital market development can be placed on firmer foundations by
strengthening legal and judicial systems for investor protection. Policies that
ease access to legal recourse lower the cost of private contract enforcement and
sanctioning breaches of duty. In addition, raising the efficiency, consistency and
fairness of legal proceedings, eg through the creation of specialised financial courts,
could usefully boost investor protection, as would policies that raise the predictability
and efficiency of insolvency procedures.
Third, enhancing regulatory independence and effectiveness is a key factor in striking a balance between investor protection and issuer costs. Clear and well focused objectives and strong governance frameworks for regulators strengthen operational autonomy, thereby protecting against unwarranted influence. Enhancing investigative powers as well as ensuring the adequacy of resources would facilitate effective enforcement of regulations and timely diagnosis of market failures and vulnerabilities. Regulators can also strengthen investor protection by raising accounting and disclosure standards, and promoting best practices in corporate governance. In addition, authorities can supplement regulatory efforts by encouraging the private sector to develop standards and codes that may help market practices keep pace with evolving market innovations.
Fourth, many economies have scope to increase the depth and diversity of the
domestic institutional investor base. Policies to promote greater penetration on
the part of institutional investors such as pension funds and insurance companies can
dampen volatility as well as create a domestic constituency that raises corporate
governance standards and the broader efficiency of capital markets. Achieving
greater financialisation of household savings by facilitating cost-effective, transparent
and well regulated collective investment products and fostering greater financial
literacy would further boost capital market development.
Fifth, a broad and bi-directional opening of capital markets can exert a
general positive influence on domestic capital market development. But to reap the
benefits, policymakers need to actively engage with potential market entrants and
prepare for spillover risks. Calibrating the pace and sequencing of opening and
creating macro policy buffers can help contain the associated risks and provide
margins for coping with volatility.
Finally, enhancing market ecosystems by developing deep complementary
markets for derivative, repo and securities lending requires a coordinated effort
along multiple dimensions. These include a supportive legal and regulatory
environment, regulatory coordination to broaden the investor base in these markets,
and robust and efficient market infrastructures such as central counterparties and
trade repositories to manage potential financial stability risks.
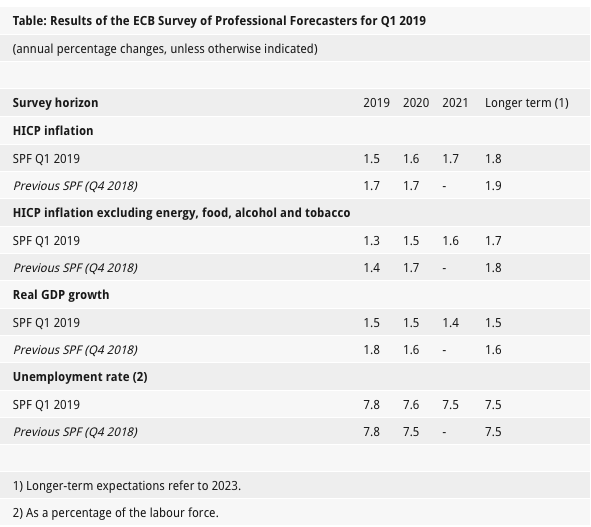
Respondents to the ECB Survey of Professional Forecasters (SPF) for the first quarter of 2019 reported point forecasts for annual HICP inflation averaging 1.5%, 1.6% and 1.7% for 2019, 2020 and 2021, respectively. These results represent downward revisions of 0.2 percentage point (p.p.) for 2019 and 0.1 p.p. for 2020 compared with the previous (Q4 2018) survey round. Average longer-term inflation expectations (which, like all other longer-term expectations in this SPF, refer to 2023) were revised down to 1.8%, from 1.9% in the previous survey.
SPF respondents’ expectations for growth in euro area real GDP averaged 1.5%, 1.5% and 1.4% for 2019, 2020 and 2021, respectively. This represents downward revisions of 0.3 p.p. for 2019 and 0.1 p.p. for 2020. Average longer-term expectations for real GDP growth were revised down to 1.5%, from 1.6% in the previous survey.
Average unemployment rate expectations were broadly unchanged. At 7.8%, 7.6% and 7.5% for 2019, 2020 and 2021, respectively, the latest expectations continued to point to further falls in the unemployment rate over the next three years. Expectations for the unemployment rate in the longer term remained at 7.5%.
The International Organization of Securities Commissions (IOSCO) is today publishing a statement setting out the importance for issuers of considering the inclusion of environmental, social and governance (ESG) matters when disclosing information material to investors’ decisions.
Disclosure of ESG information in the market has increased in recent years. Examples of ESG matters that issuers are disclosing include environmental factors related to sustainability and climate change, social factors including labor practices and diversity, and general governance- related factors that have a material impact on the issuer’s business.
IOSCO monitors and discusses current developments regarding disclosure of ESG information and the perspectives of different market participants, including investors, issuers, and other stakeholders.
Investor perspectives
Today, investors’ interest in ESG disclosure is growing and some investors already
significantly value ESG matters in their investment strategy. They highlight that such
disclosures are necessary to supplement their investment and voting decisions. Such
information includes how ESG matters affect the issuer’s approach to long-term value creation,
the nature of strategic and financial risks, and the way the issuer intends to manage them. They
also ask issuers to report on the impacts (either potential or realized) resulting from ESG
matters. ESG matters may represent material risks and opportunities to an issuer or may, under
certain circumstances, pose serious threats to the sustained viability of an issuer.
At the same time, some investors have expressed the desire for enhanced reliability and
comparability of ESG information and disclosures, in order to facilitate a more accurate
assessment of risk and, accordingly, more informed investment decisions.
Issuer perspectives
IOSCO has observed that some issuers are increasingly disclosing ESG information, either on
a voluntary basis or as a result of compulsory requirements at a local level. This trend has
resulted in an increase in the overall level of disclosure of ESG information in some industries.
However, IOSCO also observes that disclosure practices remain varied among issuers. The
type of information disclosed, as well as the quality of information, may differ in and between
markets, depending, for example and among other reasons, on the disclosure frameworks used,
the disclosure requirements and definitions of materiality imposed by jurisdictions, or the
materiality of specific ESG matters to a particular issuer.
Voluntary disclosure frameworks
There are various interest groups and private sector bodies that are active in the area of disclosures related to environment, carbon emissions, climate, social or governance related matters. They have developed various disclosure frameworks that issuers may consider on a voluntary basis when disclosing ESG information. Such frameworks often aim at facilitating and guiding the disclosure of ESG information and attempt to enhance the comparability of such disclosures for investors. Amongst the different frameworks available to issuers in the field of climate change are the disclosure recommendations and methodology developed by the industry-led Financial Stability Board’s Task Force on Climate-Related Financial Disclosures (TCFD).
The TCFD has developed climate-related financial risk disclosure recommendations that may be used by companies to provide information to investors, lenders, insurers, and other stakeholders. The objective of this guidance is to facilitate more consistent disclosure practices and encourage firms to align their disclosures with investors’ needs. Similarly, there are other reporting frameworks that have been developed to include ESG matters, including, but not limited to, the Carbon Disclosure Project (CDP), the Global Reporting Initiative (GRI), and Integrated Reporting (IR).
The Bank for International Settlement (BIS) published a paper focusing on how Bitcoin and related cryptocurrencies verify that payments are final, that is, irreversible once written into the blockchain. It points to the high costs of achieving such finality via “proof-of-work”. It then weighs the outlook for cryptocurrencies based on this kind of algorithm, and looks at possible future avenues for progress.
The paper shows that two economic limitations affect the outlook of cryptocurrencies modelled on proof-of-work. The first lies in the extreme costs of ensuring payment finality in a reasonable space of time. The second is that these systems will not be able to generate transaction fees that are adequate to guarantee payment security in future. The paper shows that the future of Bitcoin and related cryptocurrencies is crucially affected by the interplay of these two limitations.
After surveying the market for transactions and the way fees are determined, the paper finds that the liquidity of cryptocurrencies is set to shrink. In this light, the paper then asks how technical progress might raise the efficiency of Bitcoin-type payments. So-called second-layer solutions such as the Lightning Network could help. Or methods other than proof-of-work could be used to achieve payment finality. But these might require coordination mechanisms, implying support from a central institution. Thus, the current technology seems unlikely to replace the current monetary and financial infrastructure. Instead, the question is rather how the technology might complement existing arrangements.
The paper discusses the economics of how Bitcoin achieves data immutability, and thus payment finality, via costly computations, ie “proof-of-work”. Further, it explores what the future might hold for cryptocurrencies modelled on this type of consensus algorithm. The conclusions are, first, that Bitcoin counterfeiting via “double-spending” attacks is inherently profitable, making payment finality based on proof-of-work extremely expensive. Second, the transaction market cannot generate an adequate level of “mining” income via fees as users free-ride on the fees of other transactions in a block and in the subsequent blockchain. Instead, newly minted bitcoins, known as block rewards, have made up the bulk of mining income to date. Looking ahead, these two limitations imply that liquidity is set to fall dramatically as these block rewards are phased out. Simple calculations suggest that once block rewards are zero, it could take months before a Bitcoin payment is final, unless new technologies are deployed to speed up payment finality. Second-layer solutions such as the Lightning Network might help, but the only fundamental remedy would be to depart from proof-of-work, which would probably require some form of social coordination or institutionalisation.
Questo sito utilizza cookie tecnici e di profilazione, propri e di terze parti, per garantire la corretta navigazione, analizzare il traffico e misurare l'efficacia delle attività di comunicazione.
Questo sito Web utilizza i cookie per migliorarne l'esperienza di navigazione. I cookie classificati come necessari, sono essenziali alle funzioni di base sito e vengono sempre memorizzati nel tuo browser. I cookie di terze parti, che ci aiutano ad analizzare e capire come utilizzi questo sito, vengono memorizzati nel tuo browser solo con il tuo consenso. Di seguito hai la possibilità di disattivare questi cookie. Tieni in conto che la disattivazione di alcuni di questi cookie potrebbe influire sulla tua esperienza di navigazione.
Necessary cookies are absolutely essential for the website to function properly. These cookies ensure basic functionalities and security features of the website, anonymously.
Cookie
Durata
Descrizione
cookielawinfo-checkbox-analytics
1 year
Cookie tecnico impostato dal plugin GDPR Cookie Consent che viene utilizzato per registrare il consenso dell'utente per i cookie nella categoria "Analitici".
cookielawinfo-checkbox-necessary
1 year
Cookie tecnico impostato dal plugin GDPR Cookie Consent che viene utilizzato per registrare il consenso dell'utente ai cookie.
CookieLawInfoConsent
1 year
Cookie tecnico impostato dal plugin GDPR Cookie Consent per salvare le scelte si/no dell'utente per ciascuna categoria.
viewed_cookie_policy
1 year
Cookie tecnico impostato dal plugin GDPR Cookie Consent che registra lo stato del pulsante predefinito della categoria corrispondente.
Analytical cookies are used to understand how visitors interact with the website. These cookies help provide information on metrics the number of visitors, bounce rate, traffic source, etc.
Cookie
Durata
Descrizione
_pk_id.gV3j99y0AE.0928
1 year 27 days
Cookie analitico impostato da Matomo e utilizzato per memorizzare alcuni dettagli sull'utente come l'ID univoco del visitatore
_pk_ses.gV3j99y0AE.0928
30 minutes
Cookie analitico impostato da Matomo di breve durata e utilizzato per memorizzare temporaneamente i dati della visita