«Thanks to Fed, an Inverted Yiled Curve is imminent» titolava, con toni allarmistici, pochi giorni fa un articolo di Brian Chappatta su Bloomberg [1], a seguito della recente decisione del FED Open Market Committee – FOMC – di rivedere al rialzo i tassi a breve [2].
La paura di un’inversione della curva non è tema nuovo oltreoceano; già in passato, al meeting di Dicembre 2017 del FOMC, Evans e Kashkari votarono contro un rialzo dei tassi proprio per timori legati a questa eventualità.
Che cos’è che spaventa in una curva dei rendimenti invertita? Ma soprattutto, quali sono le dinamiche dietro la sua formazione?
Con curva dei rendimenti (risk-free) invertita s’intende una situazione di mercato in cui i rendimenti offerti, per scadenze più lunghe, sono minori rispetto ai rendimenti della parte a breve della curva (in questo caso solitamente si considera il “breve” come i tassi fino a 2 anni). Si tratta di una situazione a prima vista contro-intuitiva. Chi ha studiato Finanza ricorderà certamente il mantra per cui 1 euro oggi è meglio di 1 euro domani; una curva invertita, invece, dice esattamente l’opposto: meglio 1 euro domani. Questo comporta che gli investitori, in media, si orientino verso investimenti di lungo periodo, nonostante i rendimenti inferiori agli investimenti di breve.
A questo punto una domanda sorge spontanea: quali sono i drivers che spingono l’investitore ad accettare tempi più lunghi per il rientro del proprio capitale nonostante il minor rendimento?
Per rispondere a questa domanda mettiamoci nei panni di un investitore che abbia una disponibilità e un orizzonte di investimento di 10 anni. Egli può, idealmente, comprare direttamente un bond decennale, accettando il rendimento implicito [3] o investire di anno in anno in un bond annuale (facendo il così detto rolling).
La prima strategia d’investimento non presenta alcun elemento di aleatorietà, poiché l’investitore non deve far altro che mettere il suo capitale nel bond al tempo iniziale (t = 0) e riscuotere a scadenza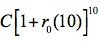 (in questo caso t = 10). La seconda strategia d’investimento, invece, ha un risultato incognito dato dal fatto che i tassi futuri con scadenza un anno non sono noti al tempo in cui si inizia la strategia.
La scelta fra le due sarà dunque guidata dalle aspettative che l’investitore elabora sulla futura evoluzione dei tassi ad un anno. Se l’investitore si aspetta un rialzo futuro dei tassi ad un anno, egli preferirà investire nella strategia di rolling, in modo da poter investire a scadenza (t = 1) il proprio capitale in titoli con rendimento maggiore (sempre che l’aspettativa si realizzi). In caso di aspettative ribassiste, invece, un investitore razionale sarà più propenso ad immobilizzare il proprio capitale direttamente nel bond decennale.
Un po’ come accade nella scelta di un mutuo: se l’aspettativa è quella di un ribasso dei tassi è buona norma scegliere un mutuo a tasso variabile, altrimenti si opta per un tasso fisso. Nel nostro esempio il bond decennale ricopre il ruolo del mutuo a tasso fisso, in quanto ci permette di bloccare il rendimento in maniera sicura, mentre la strategia di rolling è paragonabile al mutuo a tasso variabile.
Estendendo il ragionamento alla generalità degli investitori è facile intuire che i rendimenti delle due strategie (uno certo, l’altro atteso) devono tendere, in equilibrio, ad equivalersi. Se così non fosse gli investitori avrebbero tutto l’incentivo a spostare il proprio capitale da una strategia all’altra.
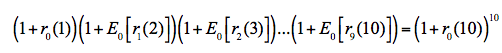
In sostanza, denotando con l’aspettativa al tempo zero del tasso annuale futuro al tempo t, si può supporre che in equilibrio:
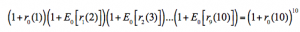
dove l’argomento a sinistra dell’uguale rappresenta il rendimento (atteso) dalla strategia di rolling, mentre l’argomento a destra rappresenta il rendimento (certo) dato dall’investire tutto e subito nel bond decennale.
Affinché nel mercato si realizzi una curva invertita, bisogna che le aspettative degli agenti di mercato siano tali che l’uguaglianza si trasformi, temporaneamente, in una disuguaglianza:
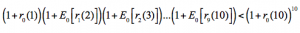
In tal caso la maggioranza degli investitori è spinta a investire nel bond a 10 anni piuttosto che nella strategia di rolling: questa, come si vede dalla disuguaglianza, restituisce infatti un rendimento complessivo inferiore.
Una maggiore domanda orientata verso il bond decennale porta ad un incremento del suo prezzo e conseguentemente ad una riduzione del suo rendimento, fintanto che l’uguaglianza non è ristabilita per un tasso più basso. Se questa diminuzione è consistente, il risultato ottenuto è un’inversione della curva.
La condizione che determina il crearsi di tale disequilibrio, e di conseguenza l’inversione della curva, è essenzialmente una: l’affermarsi di un’aspettativa ribassista sui tassi a breve futuri.
Ma come si genera un’aspettativa dominante di tassi a breve in declino? La risposta sembra essere un’altra aspettativa: quella di una recessione economica. La prima reazione da parte delle banche centrali ad una recessione è infatti, da sempre, l’abbassamento dei tassi a breve. Di conseguenza, un’aspettativa di recessione si traduce in un’aspettativa di tassi a breve futuri minori, ovvero nella disuguaglianza che origina l’inversione della curva.

Ma cosa provoca allora la diffusione di questa seconda aspettativa di recessione economica? La risposta sta nell’azione della Fed, come citato a inizio articolo. Qualora l’azione delle banche centrali di alzare i tassi a breve venga mal percepita dal mercato, questa sarà la premessa logica per un’aspettativa di caduta in recessione nel futuro (cui seguono tassi bassi futuri per contrastare la recessione). Una curva invertita è dunque conseguenza dell’azione di una banca centrale che alza i tassi a breve termine (facendo dunque salire la parte sinistra della curva) e di un’interpretazione del mercato che porta la parte lunga della curva a scendere sotto il livello della parte a breve.
Ricapitolando: da un’azione della FED, ritenuta sbagliata o “precoce” dalla maggior parte degli operatori, può generarsi un’aspettativa di recessione futura, che si traduce a sua volta in un’aspettativa di tassi a breve futuri in ribasso. Tutto ciò finisce per incrementare la domanda rivolta ai bond di lungo termine con conseguente abbassamento dei rendimenti di lungo termine sotto quelli di breve.
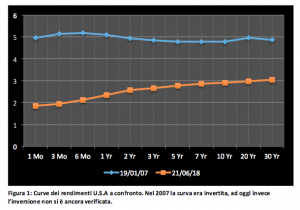
Proprio a causa di questo forte nesso logico, l’inversione della curva è sovente usata in letteratura come predittore di crisi economiche. Basti pensare che le ultime sette recessioni economiche sono tutte state precedute da un’inversione della curva.
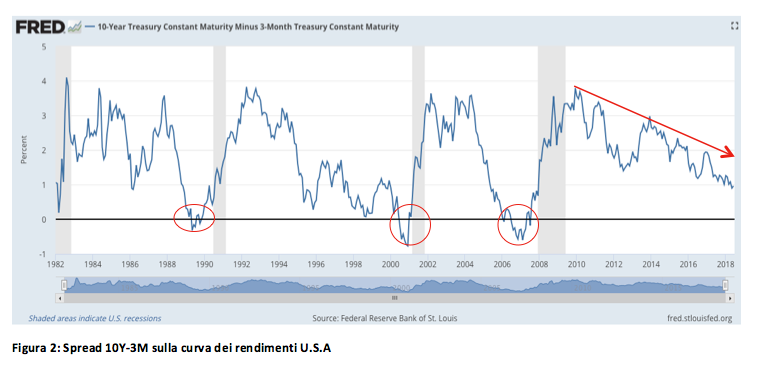
Estrella e Mishkin (1996) utilizzano un semplice approccio di regressione probit per stimare la probabilità di recessione 12 mesi avanti usando lo spread nei rendimenti a 10 anni e 3 mesi.
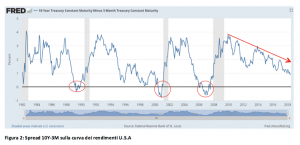
Al 22 Giugno 2018 lo spread 10Y-3M sulla curva americana è di 97 bps, quindi ancora in una sorta di confort zone, se ci basiamo sulla tabella di Estrella e Mishkin. Tuttavia ciò che conta spesso in Economia è anche la dinamica del fenomeno che, come si vede dalla Figura 2, è caratterizzata da un trend in netto peggioramento.
Note:
[1] https://www.bloomberg.com/view/articles/2018-06-13/fed-decision-an-inverted-yield-curve-is-imminent
[2] Federal Fund Rates e Discount Rates
[3] il pedice rappresenta il momento temporale di riferimento a cui è definito il tasso di rendimento, l’argomento fra parentesi rappresenta la maturity dell’investimento.