Nuovo Rapporto EBA sui collegi di vigilanza UE

Mar 23 2017

L’EBA ha pubblicato la valutazione dei collegi di vigilanza dell’Unione Europea per il 2016. Tali strutture – che riuniscono autorità di vigilanza di diversi paesi europei – svolgono, infatti, un ruolo fondamentale per la vigilanza efficace dei gruppi bancari transfrontalieri. Tra i principali compiti demandati ai collegi vi sono la valutazione dei rischi a livello di gruppo bancario, la definizione di decisioni condivise sui requisiti patrimoniali e di liquidità di Secondo Pilastro e la valutazione dei piani di risanamento di gruppo. Il loro ruolo fondamentale è quello di garantire una migliore qualità della sorveglianza dei gruppi bancari transfrontalieri garantendo una cooperazione efficace tra le autorità di vigilanza interessate.

Il Rapporto EBA – basato sulle osservazioni ottenute attraverso la partecipazione ai collegi e sui risultati consolidati delle valutazioni dei singoli collegi – ha evidenziato un ulteriore miglioramento del livello e della qualità del lavoro dei collegi di vigilanza nel 2016. In particolare:

– le valutazioni dei rischi di gruppo hanno fornito un’adeguata panoramica dei profili di rischio;

– le decisionali condivise in tema di requisiti patrimoniali e di liquidità sono state ben motivate e in linea con le conclusioni del processo SREP.

Il documento, inoltre, ha illustrato alcuni elementi di vigilanza che dovranno essere oggetto di attenzione nel 2017, tra i quali: le politiche di bilancio in essere, la riduzione della quota di sofferenze tra gli attivi e la sostenibilità dei modelli di business delle banche.

Comunicato stampa
Report EBA sui collegi di vigilanza europei 2016

Pubblicato Provvedimento IVASS sull’informativa RUI

Mar 23 2017

L’Istituto di Vigilanza sulle Assicurazioni (IVASS) ha emesso il Provvedimento N. 58 del 14 marzo 2017 recante modifiche al Regolamento ISVAP N. 5 del 10 ottobre 2006 concernente la disciplina dell’attività di intermediazione assicurativa e riassicurativa. In particolare, il Provvedimento apporta novità significative nelle modalità di presentazione all’IVASS delle istanze e delle comunicazioni dovute dagli intermediari e dalle imprese ai fini della tenuta del Registro Unico degli intermediari assicurativi e riassicurativi (nel seguito, RUI), proseguendo nel percorso di semplificazione e dematerializzazione avviato nel 2015, in linea con quanto previsto dall’art. 15, comma 2 del D.lgs. 7 marzo 2005 n. 821 e con gli obiettivi strategici dell’Istituto. Il Provvedimento persegue la finalità di agevolare i rapporti tra IVASS e operatori e di snellire i processi interni di gestione dedicati alla movimentazione e all’aggiornamento del RUI, introducendo un più moderno sistema, interamente digitale, di raccolta dei dati contenuti nelle istanze/comunicazioni presentate all’Istituto.

Provvedimento IVASS n. 58 del 14 marzo 2017

News from the CRD IV-CRR/Basel III monitoring exercise by EBA
di Emilio Barucci

Mar 16 2017
News from the CRD IV-CRR/Basel III monitoring exercise by EBA  di Emilio Barucci

The European Banking Authority has released its semi-annual evaluation on the implementation of CRD IV-CRR/Basel III by banks (EBA 2017). The analysis refers to June 2016 and looks at capital ratio, leverage ratio, liquidity coverage ratio (LQR) and net stable funding ratio (NSFR).

It is important to notice that the monitoring activity concerns how banks (164 banks from 17 EU member States) comply with the full requirements of the regulation (at the end of the ‘‘phase in’’ period) and so it doesn’t provide a stress test on the solidity of banks. Taking the full requirements as a target, we may interpret the analysis as a signal about the status of the banks with respect to the regulation. Banks are divided in two groups: Group 1 (44 large banks) and Group 2 (120 medium banks).

The main results are the following:

  • (risk weighted) Capital ratios (CET1, Tier 1, Total capital) are not a problem thanks to a significant increase in CET1 capital (around 55% during the last five years) and to a lesser degree by a decrease in RWA (around 20%). Also the leverage ratio showed a significant increase. Leverage ratio shows a higher dispersion among banks than Tier 1 ratio.
  • There is no shortfall on CET1 capital, the capital shortfall to cover risk based ratios is 2.1 bln euro, 3 bln are necessary to cover the leverage ratio requirements. The leverage ratio constraint is more binding for Group 2 banks than for Group 1 banks.
  • Risk-based ratio constraints are more binding than the leverage ratio constraint. As a matter of fact, only 29% of Group 1 banks and 40% of Group 2 banks are more constrained by the leverage ratio constraint than by the risk based Tier 1 capital requirement in a sense that they need more capital to meet the leverage ratio at 3% than the risk based ratio at 8.5% plus G-SII/O-SII buffers.
  • During the last four years Group 1 banks have decreased the quality of their capital, i.e., the fraction of CET1 capital over regulatory capital is on average equal to 77%, the opposite trend is observed for Groups 2 banks that on average have 86% of their regulatory capital as CET1 capital.
  • On the composition of RWA we observe an increase of operational risk (more pronounced for Group 1 banks) and a decline of market risk and of CVA with a cutting of CVA positions.
  • Considering the exposures in the balance sheet, Groups 1 banks have 23% allocated to derivatives, securities, off-balance-sheet items, Groups 2 banks have only 10%.
  • The risk density (the ratio between RWA and exposure) has decreased over time showing that banks have decreased their RWA and increased their exposure, i.e., the main driver was a de-risking rather than a de-leveraging.
  • The liquidity coverage ratio doesn’t bind significantly banks: the 100% constraint, which will be binding by 2018, leads to a shortfall of 2.5 bln. Instead, the Net stable funding ratio produces a shortfall of 159 bln. The shortfall is mostly attributable to Group 1 banks.

Shadow banking: consultazione del Comitato di Basilea sul rischio di step-in

Mar 16 2017

Il Comitato di Basilea per la vigilanza bancaria ha pubblicato un documento di consultazione sull’identificazione e la gestione del rischio step-in. Tale rischio nasce dalla possibilità che una banca intervenga a supporto di altre entità che versano in difficoltà finanziaria senza, o al di fuori, di obblighi contrattuali precostituiti – al fine di proteggersi da eventuali danni reputazionali derivanti dalla sua connessione a tali entità. Il rischio di step-in è potenzialmente riscontrabile soprattutto nelle relazioni tra banche e soggetti appartenenti al cosiddetto sistema bancario ombra (shadow banking).

Le proposte oggetto della consultazione fanno seguito ad una consultazione precedente avviata nel dicembre 2015 per la formulazione di un framework per l’individuazione e la gestione del rischio di step-in.

Sulla base dei commenti ricevuti durante la prima consultazione, il Comitato ha apportato delle modifiche al quadro di riferimento, in particolare per quanto riguarda i modelli di segnalazione di vigilanza e gli strumenti prudenziali previsti.

Il piano normativo proposto contribuirà a rafforzare la supervisione e la regolamentazione del sistema bancario ombra, con l’obiettivo di mitigare i rischi sistemici e, in particolare, quelli derivanti dal coinvolgimento delle banche con istituzioni del sistema bancario ombra.

La consultazione avrà termine il 15 maggio 2017.

Comunicato stampa
Documento di consultazione

L’EBA aggiorna la lista delle istituzioni O-SIIs europee

Mar 16 2017

L’EBA ha rilasciato l’aggiornamento annuale dell’elenco delle istituzioni UE rientranti nelle cosiddette O-SIIs (Other Systemically Important Institutions). Si tratta delle istituzioni finanziarie, diverse dalle G-SIIs (Global Systemically Important Institutions), considerate di importanza sistemica dalle Autorità competenti tramite l’applicazione dei criteri comuni individuati dall’EBA.

L’elenco è completato dalle riserve di capitale addizionali che le autorità di vigilanza hanno fissato per le singole istituzioni. Tali misure patrimoniali addizionali saranno efficaci solo dopo che saranno passati almeno 12 mesi dalla pubblicazione dell’elenco, in modo da permettere alle istituzioni interessate di adottare le politiche necessarie per l’adeguamento.

Comunicato stampa
Lista EBA O-SIIs

CRR: nuove linee guida EBA sulla segnalazione LCR

Mar 16 2017

L’Autorità bancaria europea (EBA) ha pubblicato la versione finale delle Linee guida sulle modalità di segnalazione in materia di Liquidity Coverage Ratio (LCR). Queste linee guida forniscono modelli informativi armonizzati e mirano a migliorare la trasparenza e la comparabilità dei dati di LCR senza alterare il quadro informativo generale previsto dal regolamento CRR.

In particolare, le disposizioni adottate prevedono un modello informativo “completo” – in linea con quanto proposto dal Comitato di Basilea per la vigilanza bancaria – per gli enti creditizi sistemici e uno “semplificato” per le altre istituzioni rientranti nel perimetro di applicazione.

Le nuove linee guida si applicheranno agli istituti di credito oggetto del regolamento delegato LCR e identificati come istituzioni di importanza sistemica (G-SIIs e O-SIIs). Inoltre, altri istituti di credito potranno applicare queste linee guida a discrezione dell’autorità di vigilanza competente o su base volontaria.

Le linee guida entreranno in vigore il 31 dicembre 2017.

Comunicato stampa
Linee guida EBA sulla segnalazione LCR

Comunicazione di Banca d’Italia sul trattamento delle operazioni TLTRO nelle segnalazioni di vigilanza e in bilancio

Mar 16 2017

Con la Comunicazione pubblicata in data 7 marzo 2017, Banca d’Italia ha fornito dei chiarimenti sulle modalità di segnalazione delle operazioni TLTRO (Targeted Longer-Term Refinancing Operations) con la BCE. In particolare, si precisa che nell’ottica di segnalazione di vigilanza (matrice dei conti):

  • le operazioni TLTRO-I (prima serie) sono segnalate come “a tasso fisso”, considerato che il tasso è fissato all’inizio per tutta la durata dell’operazione;
  • le operazioni TLTRO-II (seconda serie) sono, convenzionalmente, segnalate come “a tasso indicizzato” nella fascia di vita residua per data di riprezzamento “da oltre 3 anni a 4 anni”, considerata la possibilità di riduzione del tasso in maniera correlata al tasso d’interesse sulle deposit facility.

Inoltre, criteri analoghi si applicano ai fini dell’informativa sul rischio di tasso d’interesse prevista nella nota integrativa del bilancio bancario.

Comunicazione Banca d’Italia del 7 marzo 2017

L’EBA pubblica i risultati dell’esercizio di benchmarking annuale dei modelli interni

Mar 16 2017

L’EBA ha pubblicato due Report riguardanti la composizione degli attivi ponderati per il rischio (Risk weighted assets o RWA) delle istituzioni europee autorizzate a utilizzare i metodi interni per il calcolo dei requisiti patrimoniali. In particolare, i documenti riguardano l’esercizio di benchmarking annuale condotto in relazione a:

  • mutui residenziali, verso le PMI e altri portafogli corporate (descritti collettivamente come “high default portfolios” o HDP) e
  • rischio di mercato.

Il rapporto HDP esamina il livello generale di variabilità degli RWA ed esamina i diversi driver che spiegano la dispersione dei portafogli. La maggior parte dei risultati sono ampiamente in linea con gli esercizi precedenti.  Il documento evidenzia come oltre l’80% della differenza osservata nella qualità dei portafogli HDP possa essere spiegato alla luce di driver quali: la percentuale di esposizioni insolute in portafoglio, il paese della controparte e il mix di portafoglio. La variabilità residua potrebbe essere attribuita a differenze di rischiosità (caratteristiche idiosincratiche di portafoglio, ipotesi di modellizzazione, pratiche di gestione del rischio utilizzate dalle banche) e a pratiche di vigilanza non perfettamente allineate.
In generale, i valori stimati per PD e LGD sono stati al di sopra dei valori osservati per i default e tassi di perdita. Tuttavia, alcune banche mostrano sistematicamente valori osservati superiori alle stime e richiedono un’analisi più approfondita.

Il Report sul rischio di mercato analizza la variabilità osservata in termini di misure statistiche di dispersione. I portafogli su tassi d’interesse mostrano una variabilità più bassa rispetto ad altre classi di attività a causa di una maggiore omogeneità dei modelli utilizzati dalle banche. In linea con gli esercizi precedenti, si osserva una dispersione significativa per tutte le misure di rischio fornite dalle banche. Come previsto, la variabilità complessiva per il Value at Risk (VaR) è inferiore a quella osservata per lo Stressed VaR (SVAR) e misure più sofisticate come l’Incremental Risk Charge (IRC) e l’All Price Risk (APR) mostrano un livello molto più elevato di dispersione. Le scelte di modello svolgono in questo caso un ruolo importante nello spiegare questa variabilità, soprattutto per le misure di rischio più complesse.

I risultati dell’esercizio di benchmarking mettono in luce diverse aree che richiedono un approfondimento da parte delle autorità di vigilanza e del mondo accademico, quali

  • in tema di portafogli HDP: pratiche riguardanti le esposizioni insolute, la definizione di default, l’utilizzo di modelli globali e differenze ingiustificate tra gli approcci normativi e possibili effetti di compensazione tra gli approcci interni.
  • in tema di rischio di mercato: variabilità accentuata dei prezzi dei derivati ​​azionari, dei contratti su materie prime e degli strumenti su credito.

Come sottolineato dall’EBA, inoltre, l’attività di benchmarking annuale rappresenta un importante strumento per il miglioramento del quadro normativo e per il ripristino della fiducia nei modelli interni.

Comunicato stampa
Report su portafogli HDP
Report su rischio di mercato

Basilea 3: presentati i risultati dell’esercizio di monitoraggio al 30 giugno 2016

Mar 16 2017

Il Comitato di Basilea ha pubblicato i risultati dell’ultimo esercizio di monitoraggio riguardante l’implementazione della disciplina di Basilea 3. L’analisi prende in considerazione i dati di bilancio al 30 giugno 2016 di 210 banche suddivise in due gruppi (di cui il Gruppo 1 composto da 100 banche di grandi dimensioni attive a livello internazionale).
L’esercizio è stato condotto ipotizzando che il pacchetto di misure di Basilea 3 – così come approvato alla fine del 2015 – fosse pienamente in vigore. In altre parole non sono stati presi in considerazione gli eventuali meccanismi transitori in essere e le modifica successivamente introdotte a partire dal mese di gennaio 2016 (quali, ad esempio, la revisione del quadro di riferimento per il rischio di mercato).

Dal punto di vista patrimoniale, tutte le banche del campione rispettano virtualmente sia il requisito minimo di CET1 del 4.5% che il livello target del 7%, tenendo anche conto di eventuali requisiti addizionali per le istituzioni di importanza sistemica globale. Nel primo semestre del 2016, inoltre, le banche del Gruppo 1 hanno continuato a ridurre lo shortfall di capitale sia a livello di Tier 1 che di Tier 2.

L’esercizio di monitoraggio ha preso in considerazione anche i dati relativi alla liquidità delle banche: la media ponderata del Liquidity Coverage Ratio (LCR) per le banche dei due gruppi è pari, rispettivamente, al 126% per il Gruppo 1 (125,2% nel semestre precedente) e 155% per il Gruppo 2 (148,1% rispetto al secondo semestre 2015). In particolare, tutte le banche considerate presentano un LCR superiore al 70% (requisito minimo in vigore per il 2016), mentre l’88% delle banche del Gruppo 1 e il 94% di quelle del Gruppo 2 presenta un LCR superiore al 100%.

L’analisi del Net Stable Funding Ratio (NSFR) riporta una media ponderata per il Gruppo 1 pari al 114% e per il Gruppo 2 del 115%. In ognuno dei due gruppi, oltre l’84% delle banche presenta un NSFR superiore al 100%. La percentuale sale al 96% se si considera la soglia di NSFR pari almeno al 90%.

Comunicato stampa
Report esercizio di monitoraggio Basilea 3 al 30 giugno 2016

EIOPA stress test 2016 results
di Silvia Dell’Acqua

Feb 24 2017
EIOPA stress test 2016 results   di Silvia Dell’Acqua

The European economic growth appears still fragile, with economies characterized by a large public debt and the expectation on the inflation that has not changed despite the ECB’s market stimulus. The excess of liquidity in the markets has reduced government and corporate yields, leading the insurers to reallocate their portfolios towards more risky markets. Moreover, the high volatility driven by the recent economic and political events has exacerbated the burden of persistent low growth and low yield bore by the insurers, which struggle to match their obligations towards the policyholders while maintaining a sufficient level of profitability.

With the aim of identifying the risks and assessing the resilience of the insurance sector as well as a potential systemic impact to the financial and economic environment, EIOPA launched last 24th May 2016 the EU-wide Insurance Stress Test, with reference date 1st January 2016: the outcome, disclosed on the 15th December 2016, raised some concerns, deserving a supervisory response to ensure coordinated actions.

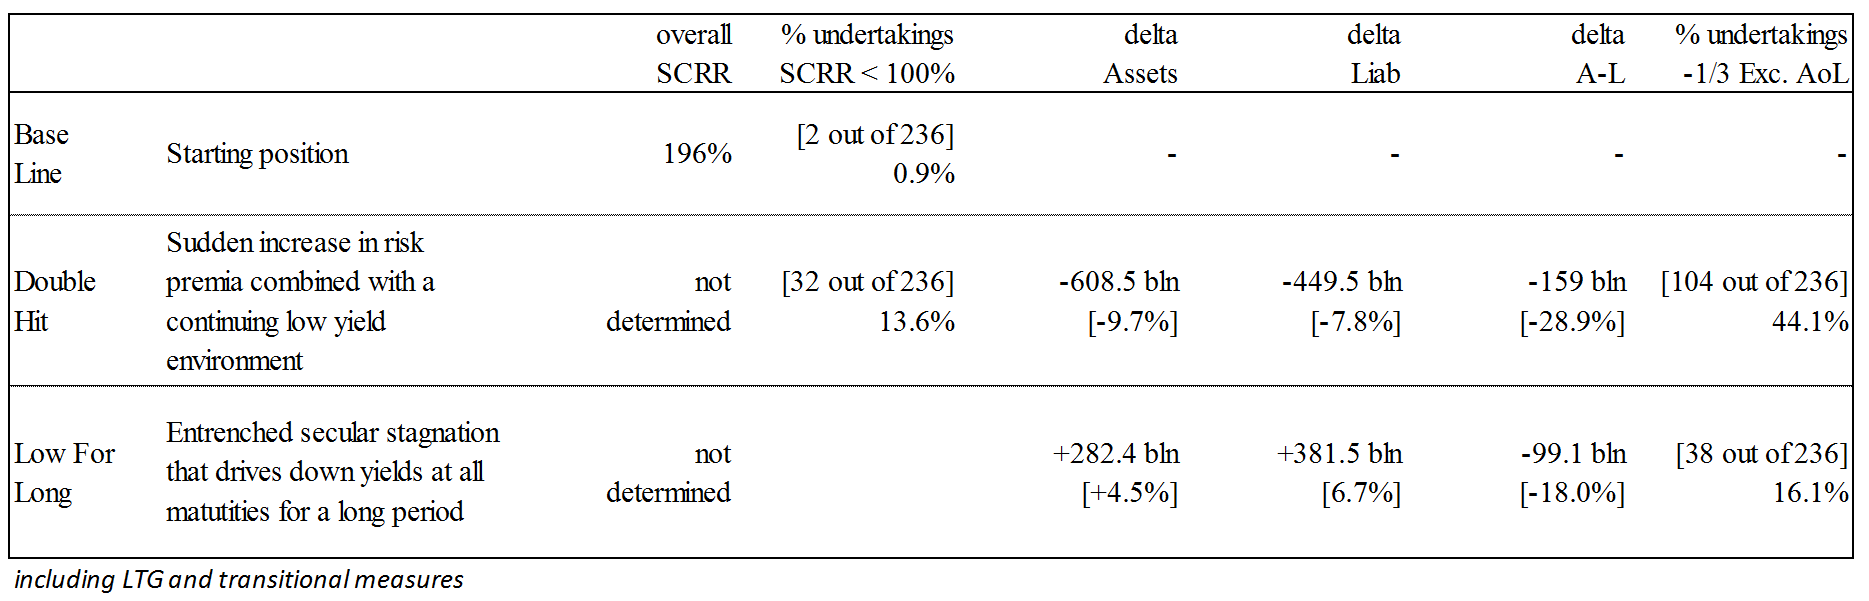
The double hit scenario produces the highest loss, nonetheless it represents a plausible but very extreme event, whose results are not spread equally across the sample (i.e. there are a number of conditions and portfolio structures that make undertakings more vulnerable to such an event). The severity of the scenario goes beyond the SII capital requirements, although its likely-hood cannot be fully calculated.

The results of the Low for long scenario, instead, are more relevant and challenging given the debate on the future course of interest rates. The impacts of such a scenario are spread over a number of years, which may well exceed the decade.

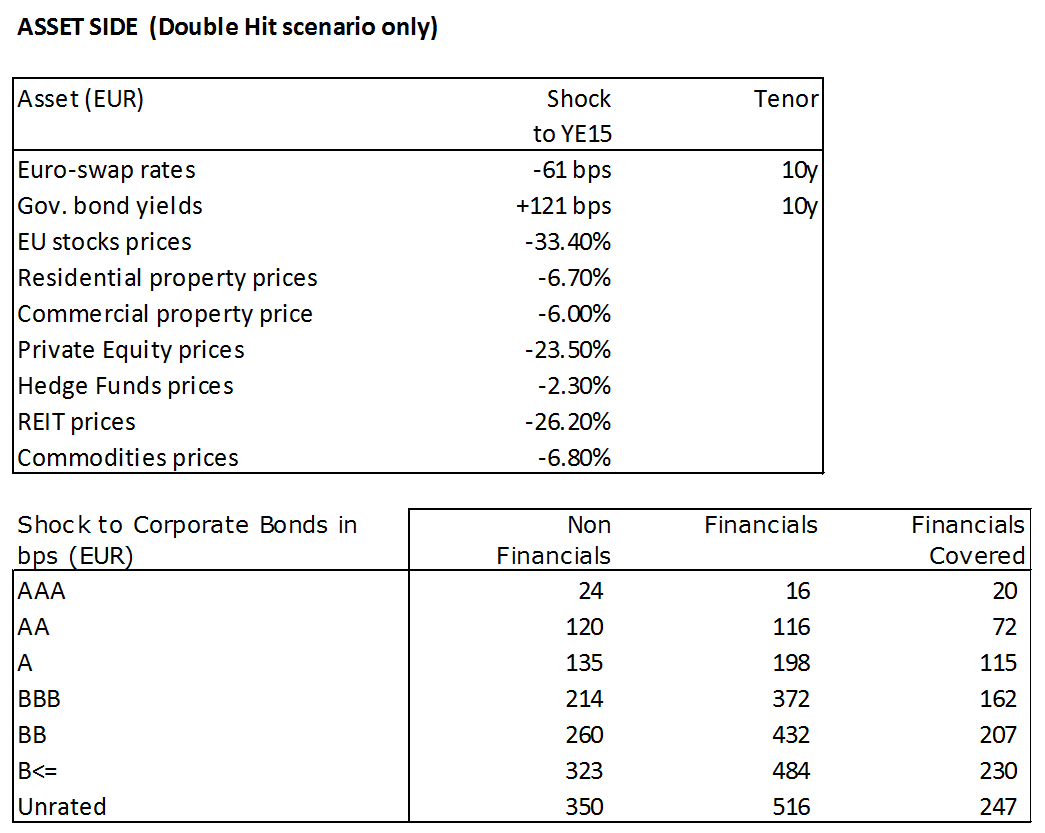
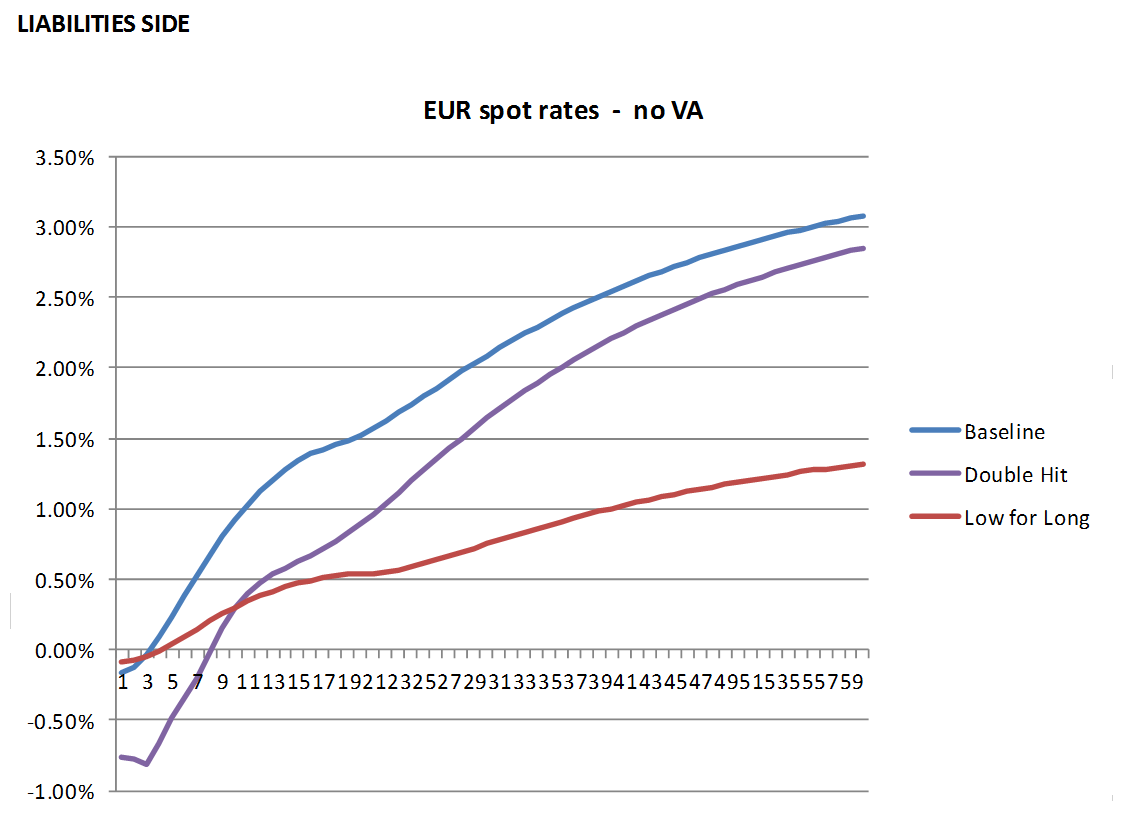
Rather than being interpreted as a pass/fail exercise on the capital requirements, the ST2016 was designed as a vulnerability analysis, testing extreme albeit plausible scenarios. For this reason, there are some departures from the strict application of the Solvency II regime: for instance, the spread shocks were applied to the EU sovereign bonds and in the Low for Long scenario a different assumption for the UFR was used (reduced to 2% – please note that there is no link between this hypothesis and the ongoing consultation on the methodology to derive the Ultimate Forward Rate). With this aim in mind, the SCR was not recalculated under the stresses, on the contrary changes in Assets, Liabilities and Excess of Assets over Liabilities (AoL) were measured to allow a comparison between pre and post stress situations.

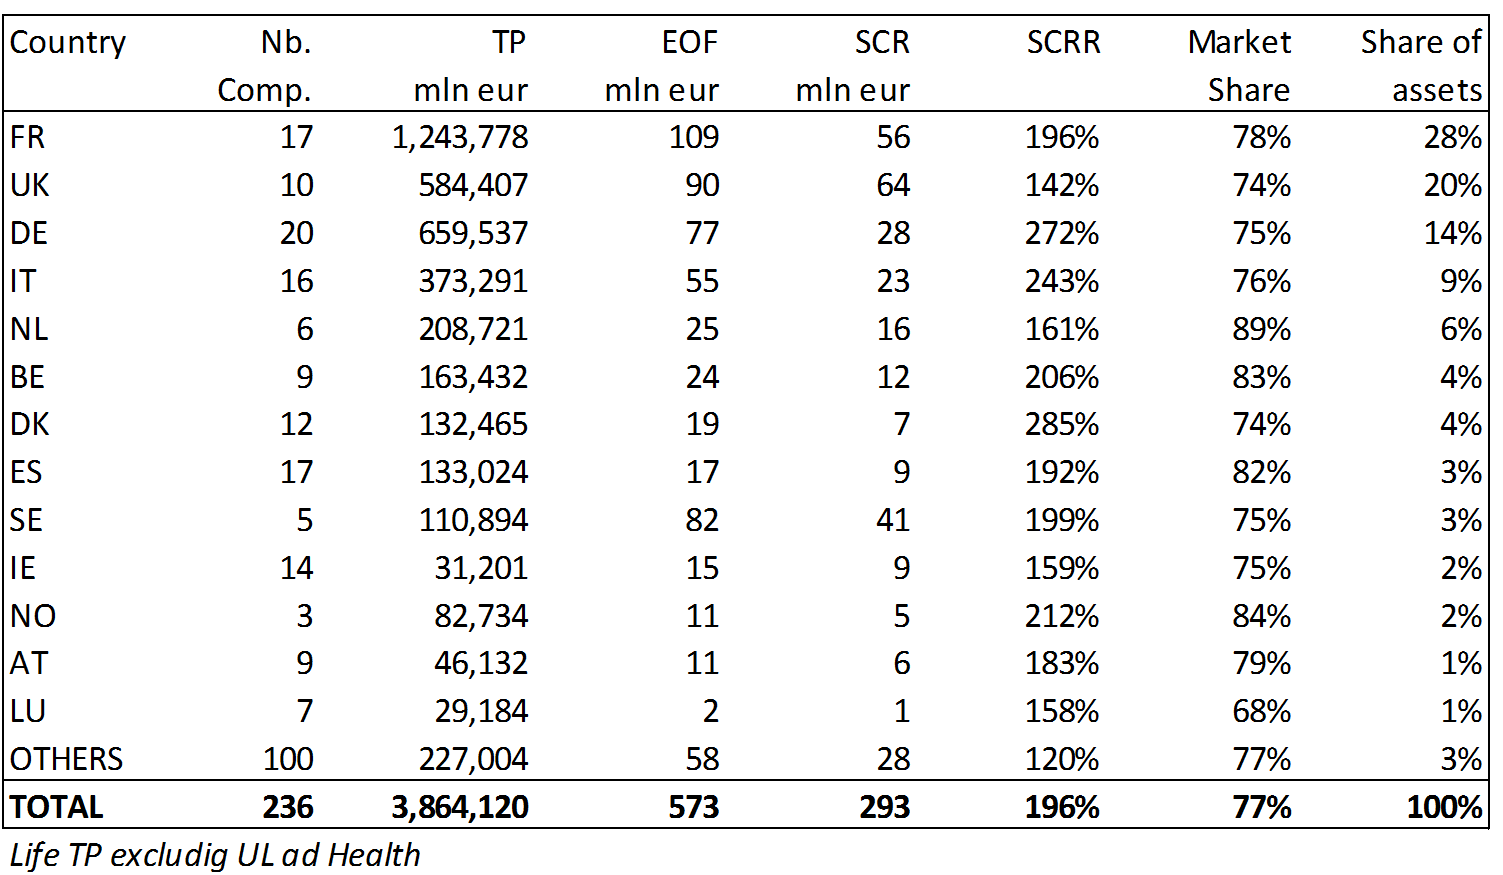
The companies in the sample hold almost 6300 billion in total assets (around 60% of the total assets held by insurers) and show a good capitalization in the Baseline, with an overall SCR of 196% and AoL ratios >1 for all the undertakings. Even if the companies keep on showing a positive Excess of Assets over Liabilities after the stresses (the ratio goes below 1 for 2% and 1% of the sample in the DH and LfL scenarios), the stressed situations decrease this cushion of a quarter and the share of companies that lose more than a third of Excess is remarkable (44% and 16%).

The LTG and transitional measures, among which the VA is by far the most widely used (64% of undertakings), play a crucial role in both the Baseline and the stressed scenarios. The overall SCR-Ratio in the Baseline falls from 196% to 136% in absence of these measures, which also help in keeping the AoL ratio >1 in the DH scenario; the importance is instead less pronounced in the Low for Long scenario. This confirms the intentions behind the VA, which was designed to allow the insurance companies to continue to operate under the assumption that rapid, large and unexpected changes in market asset values are of temporary measure, while was not meant to support the insurance sector in a scenario with long term challenges such as low interest rates. If the LTG and transitional measures were not applied, insurers would probably be induced to force sales and de-risking in order lowering their SCR, possibly pushing further down asset prices, adding to the market volatility and potentially affecting financial stability. Nevertheless, the qualitative questionnaire included in the exercise indicates that insurers do not foresee the need for large scale assets sales: half of participants declared their intention to increase holdings in assets mostly hit by the adverse scenario, potentially acting in a counter-cyclical manner.

In the Double Hit scenario the values of both Assets and Liabilities decrease: the latter is explained partially by the fact that a shock in the asset values implies a reduction of the future benefit payments and profit participations and partially by the increase of the discount factors, given by an overcompensation of the VA (increased due to the high spreads) on the reduced swap rates. In the Low for Long scenario both Assets and Liabilities increase, with the Liabilities increasing more because of their longer durations (the higher the durations, the higher the vulnerability).

The results show that companies with higher AoL ratios are generally more vulnerable, as well as companies with a high SCR, this is particularly the case for smaller undertakings. On the other side, large companies, despite not being the most affected by the stresses, are still potentially vulnerable, exhibiting low AoL ratios in both baseline and stressed scenarios. Companies with a large share of unit linked business are less impacted than those with a large share of traditional business, but, although the unit linked business may act as a shield, it can introduce other risks not included in the stress test: is a competitive market, where liquidity issues could also arise if a large number of policyholders were to surrender at the same time.

Perimeter and Solvency position

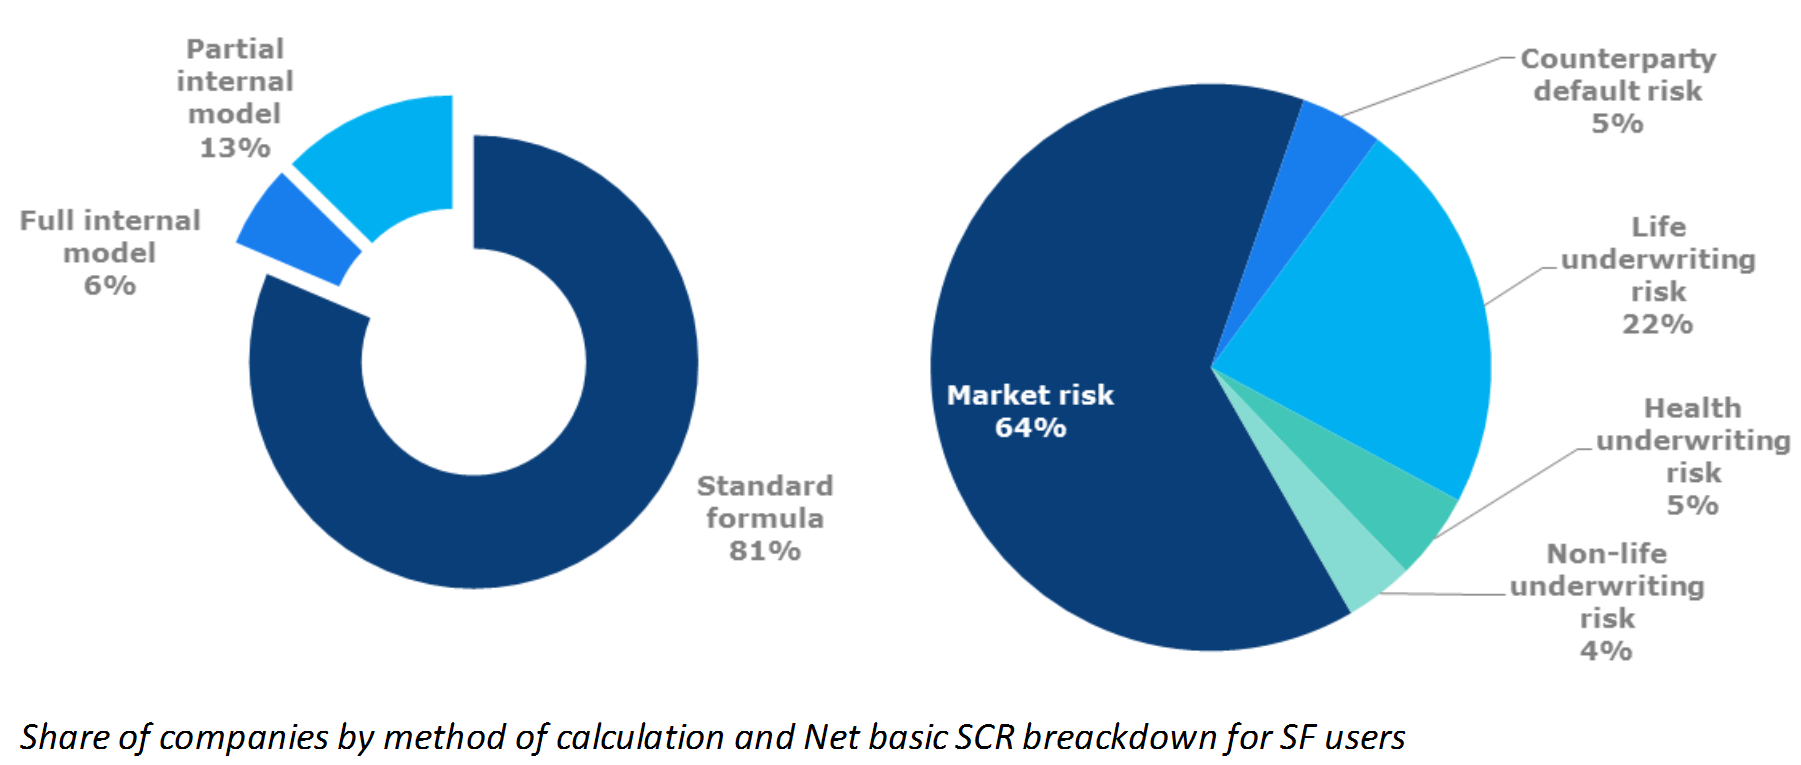
The exercise was carried out on a sample of 236 solo undertakings from 30 countries, which have been selected as perceived more vulnerable to the current market risks, given their long term life business characterized by  interest rate guarantees. Solo undertakings were preferred to groups to highlight potential issues: individual subsidiaries may find support from well diversified groups at a consolidated basis. The sample is dominated by four countries (FR, UK, DE and IT) that represent together almost ¾ of the total. Overall, market coverage of 77% was achieved. The sample undertakings are adequately capitalized, with an overall surplus (EOF-SCR) of 280 billion. 81% of the companies are SF users, showing a market risk that accounts for 64% of the net SCR before diversification.

Asset side

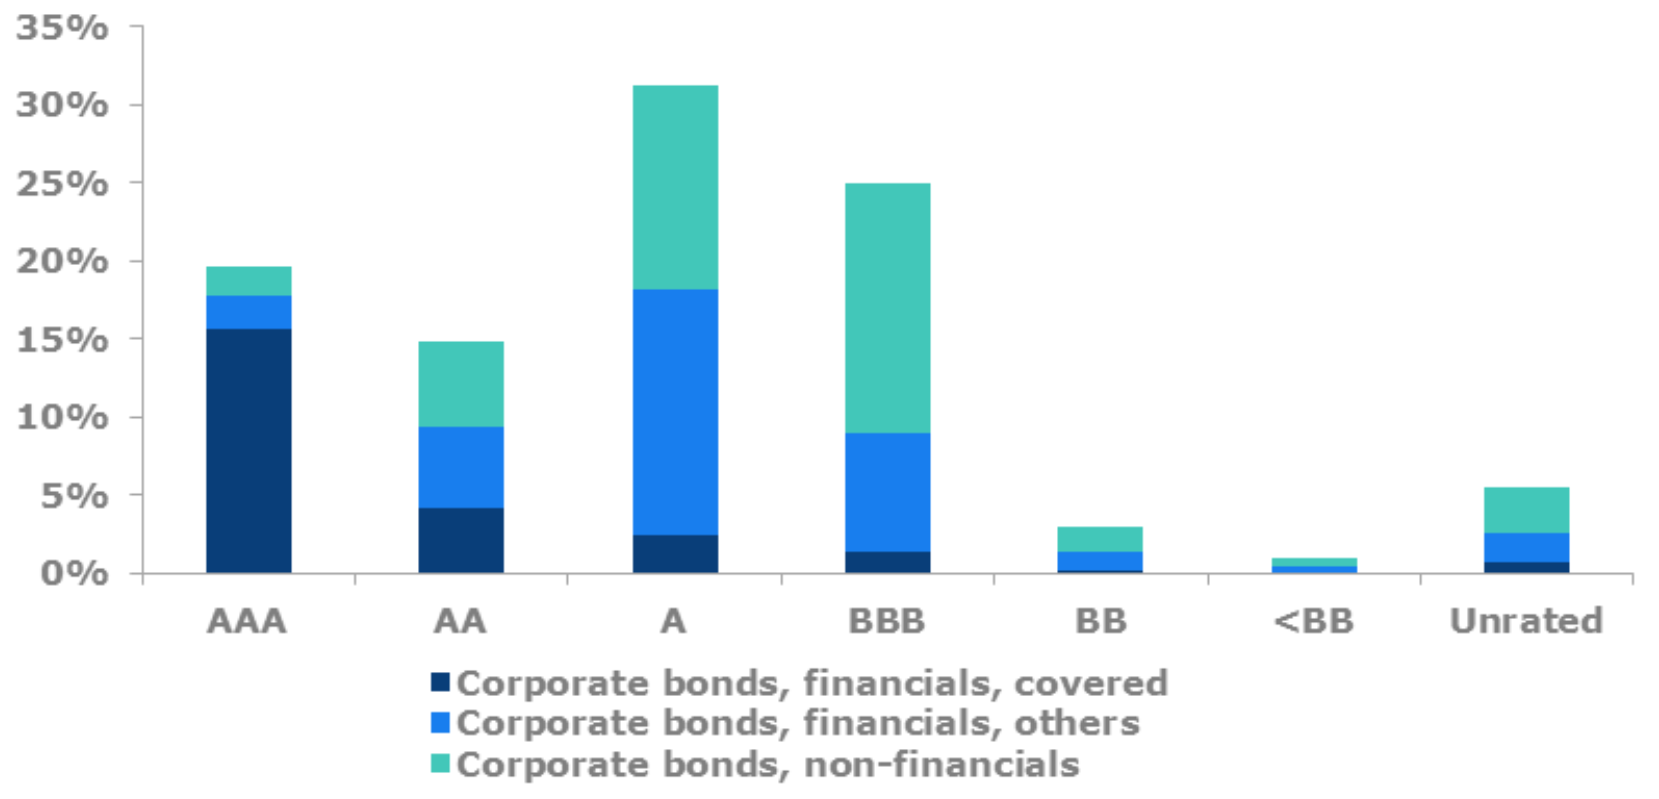
Bonds account for the biggest share of assets (47%): half are governments, half are corporates. Regarding the sovereign, there is a degree of bias in holding those of the country the undertakings belong to: 50% of the exposures of sovereigns is concentrated in FR (27%) and IT (23%), the percentage reaches 89% including DE (11%), ES (10%), BE (9%) and UK (7%). Regarding the Corporates, 60% of bonds are held in AAA to A buckets, with a 25% concentration in BBB.

Liability side

The Technical Provisions account for more than 90% of the total Liabilities, proving that insurers do not rely on external market financing and the financial leverage is small compared to the overall TP.

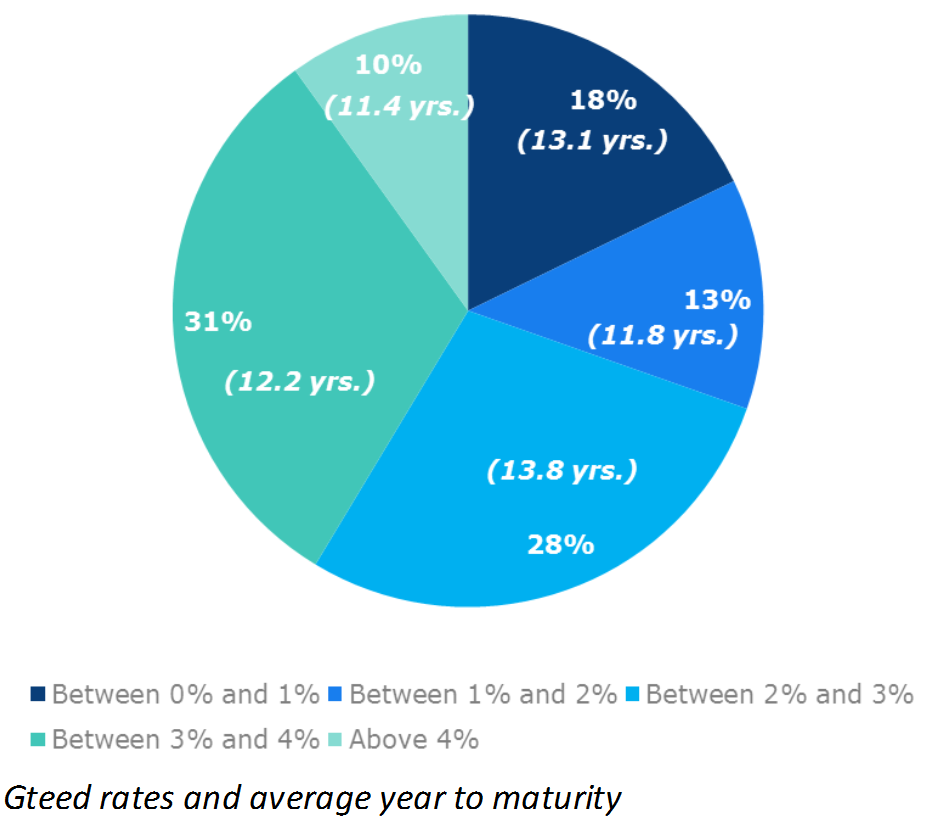
The guaranteed rates are high compared to the current interest rate levels and will apply to future premiums as well, with an average year to maturity above 12 years.

The results of the exercise exhibit the importance of the diversification tool, as well as the projection methodologies, in particular the ability to model negative interest rates, the reliability of the economic scenario generators and the credibility of the future management actions used for all the simulations.

The exercise confirmed the vulnerability of the insurance sector to the low interest rate environment and to a pronounced reassessment of risk premia. For this reason EIOPA decided to issue a set of general recommendations addressing the need for follow-up actions: National Competent Authorities (NCAs) are requested to assess whether the vulnerabilities identified pose a threat to the viability of the entities and of the entire system, EIOPA will undertake a coordinating role.

NCAs are recommended to take some actions split in short and medium term measures:

  • short term measures
    • encourage undertaking to assess the vulnerabilities quoted above in their ORSA
    • assess whether undertakings are reversing their risk appetite or are pursuing portfolio allocations that go beyond their risk capacity
    • request a reduction of the maximum guarantees and of unsustainable profit participation and the cancellation of deferral or dividend distribution when the viability of the business model is at risk
    • assess the impacts of the stress test at group level, considering management actions, diversification effects and possible actions to take (to be delivered by October 2017)
  • medium term measures
    • review and assess undertakings’ models that concern the behaviour of management and policyholders
    • review the clauses of the guarantee, their typologies and optionality to understand whether the valuation of the TP is proportionate and prudent