Le autorità di vigilanza europee (EBA, EIOPA ed ESMA) hanno pubblicato un documento di discussione sull’uso dei rating da parte degli intermediari finanziari nell’UE.
La consultazione è aperta fino al 27 febbraio il 2015.
Le autorità di vigilanza europee (EBA, EIOPA ed ESMA) hanno pubblicato un documento di discussione sull’uso dei rating da parte degli intermediari finanziari nell’UE.
La consultazione è aperta fino al 27 febbraio il 2015.
Le autorità di vigilanza europee (EBA, EIOPA ed ESMA) hanno pubblicato un documento di consultazione contenente un progetto di linee guida per la regolamentazione delle pratiche di cross-selling nel settore finanziario da applicarsi in tutta l’UNione Europea. Queste linee guida stabiliscono un approccio coerente ed efficace nel controllo delle imprese che offrono opzioni di cross-selling, in modo da rafforzare la tutela dei clienti europei.
La consultazione rimarrà aperta fino al 22 marzo 2015
L’EBA ha pubblicato le sue linee guida finali per le procedure e metodologie comuni per la revisione e la valutazione del processo di controllo prudenziale (SREP).
Queste linee guida riconoscono il principio di proporzionalità e l’importanza del giudizio di vigilanza. Forniscono un quadro flessibile ma vincolante per tutte le autorità di vigilanza europee.
Le linee guida si aplicheranno dal 1o gennaio 2016.
L’EBA ha pubblicato norme tecniche di regolamentazione (RTS) in materia di informazioni relative alla riserva di capitale anticiclica (CCB).
L’EBA ha pubblicato linee guida contenenti le informazioni che le istituzioni del settore bancario UE dovrebbero pubblicare a norma del terzo pilastro.
L’ESMA ha pubblicato un documento di discussione sulle diverse categorie di azioni degli UCITS.
La discussione rimarrà aperta fino al 27 marzo 2015

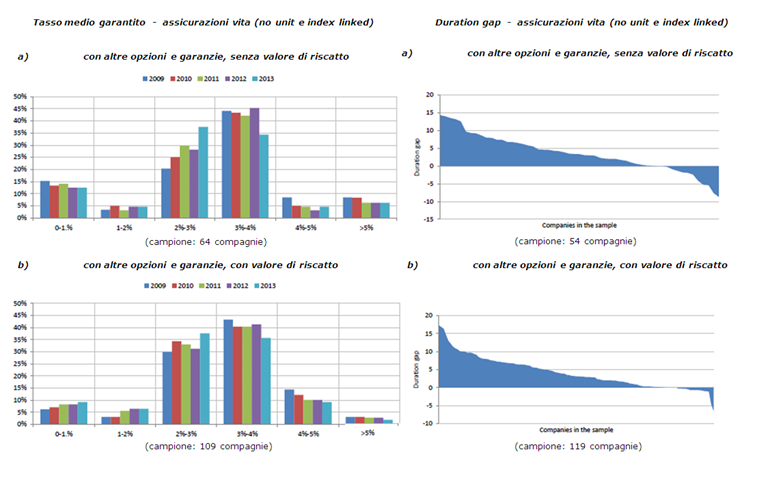
L’impatto che uno scenario di bassi tassi di interesse ha sulle compagnie di assicurazione è il risultato di tre fattori combinati: tassi di interesse garantiti offerti nei contratti di assicurazione, rendimenti di mercato e disallineamento di duration fra attivi e passivi (duration gap); il business più esposto a questo rischio è quello delle compagnie di assicurazione vita e dei fondi pensione, caratterizzati da contratti a lungo termine e rendimenti garantiti o alto profit sharing.
Una situazione di persistenza di bassi tassi di interesse è vista come una delle maggiori problematiche per il settore assicurativo ed EIOPA continua da due anni a questa parte a monitorare la situazione, investigando sulle risposte che il mercato assicurativo propone e sulle precauzioni adottate dagli organi di vigilanza locali (NSA: National Solvency Authorities). Con il paper “Opinion on Supervisory Responce to a Prolonged Low Interest Rate Environment” EIOPA nel Febbraio 2013 metteva in guardia il settore assicurativo sui problemi che potrebbe causare uno scenario di persistenti bassi tassi di interesse e qualche mese dopo, nel Gennaio 2014, circolarizzava un questionario per esaminare le azioni intraprese dalle NSA e dall’industria unitamente agli esercizi su “scenari a bassi tassi di interesse” portati a termine negli anni precedenti. Successivamente, nel Maggio 2014, EIOPA pubblicava uno Stress Test con apposito modulo “Low Yield”, volto a catturare scala e tempistiche del rischio derivante da un tale scenario economico; affiancato all’esercizio quantitativo un questionario ancillare basato su dati storici in regime Solvency I, volto a raccogliere informazioni qualitative e quantitative sull’evoluzione dei prodotti a tasso garantito, sulla dimensione del business coinvolto, sulle tipologie di investimento adottate e sulle principali strategie di mitigazione del rischio che potrebbero essere implementate.
Come situazione generale del mercato assicurativo è emersa la riduzione dei tassi di interesse garantiti (periodo 2009-2013) in risposta ad un contesto di riduzione dei rendimenti: in particolare sembra esserci uno spostamento da tassi superiori al 3% verso fasce più ridotte.
Un altro fattore da considerare è il “duration gap”, ovvero la differenza fra duration di attivi e passivi (che di natura esiste essendo gli orizzonti temporali delle riserve generalmente più lunghi di quelli degli attivi): l’esposizione a cambi di tasso di interesse è maggiore per compagnie con alto duration gap (positivo o negativo).
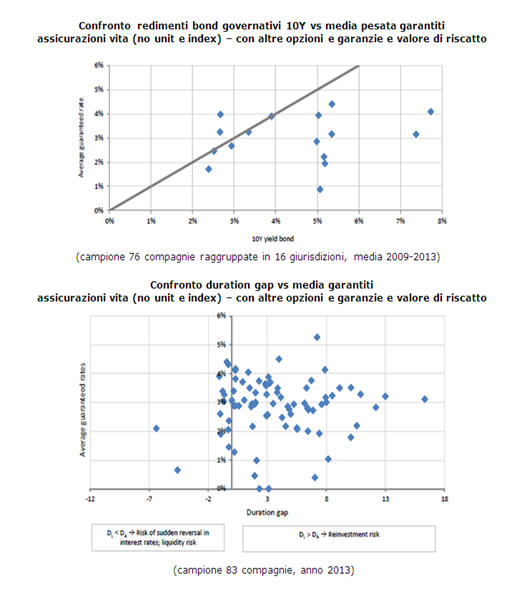
I dati mostrano anche come in alcune giurisdizioni la media dei garantiti nel periodo 2009-2013 sia superiore alla media dei tassi di rendimento governativi decennale locali, di conseguenza, dal momento che tali titoli compongono la gran parte del portafoglio di attivi, in uno scenario di bassi e persistenti tassi di interesse il settore assicurativo potrebbe non essere capace di garantire quanto offerto e potrebbe dover arricchire il portafoglio di titoli più rischiosi a più alto rendimento.
Questi dati su tasso medio garantito e duration gap possono far presagire i problemi a cui potrebbero andare in contro le compagnie, ad esempio il rischio di reinvestimento riguarda maggiormente le compagnie con duration dei passivi maggiore di quella degli attivi ed è particolarmente spiccato per quelle con alti tassi garantiti. Compagnie soggette invece a duration gap negativi sono maggiormente esposte al rischio di inversione di tassi di interesse e potenzialmente al rischio liquidità se gli attivi vanno venduti prima della scadenza per pagare oneri derivanti dalle passività.
Dai due questionari è emerso che la maggior parte delle azioni già compiute dalle NSA e programmate per il futuro riguardano l’intensificazione dei requisiti di rendicontazione sul rischio tasso e la pubblicazione di raccomandazioni o public statements. Un altro potere esercitato negli ultimi anni e che si prevede verrà esercitato in futuro è la richiesta di accantonamento di apposita riserva per il rischio tasso. Altre azioni intraprese in passato, ma che le NSA non prevedono di compiere nel futuro, riguardano interventi sulla politica di investimento e la modifica della valutazione delle riserve tecniche (ad esempio aggiustando i fattori di sconto). In genere le misure intraprese dall’industria variano a seconda che l’obiettivo sia arginare l’impatto di uno scenario di bassi e prolungati tassi di interesse sul nuovo business o su quello già in essere: sul primo le compagnie di assicurazione hanno ridotto e continueranno a ridurre il livello di garanzie offerte sui nuovi contratti e si concentreranno su prodotti senza garanzia o meno dipendenti dal rendimento degli investimenti (come ad esempio i prodotti unit linked); mentre per quanto concerne i contratti già in essere le compagnie stanno accantonando riserve aggiuntive e fornendo incentivi agli assicurati per passare a nuovi contratti meno soggetti al rischio tasso. In generale le compagnie stanno anche riducendo i costi operativi e modificando le strategie ALM (Asset Liabilitiy Management).
Ancorché quasi metà delle NSA abbiano riportato un aumento di quote detenute in strumenti a più alto rendimento, non appare evidente un generalizzato comportamento di “ricerca del rendimento” e soluzioni più rischiose come titoli a garanzia di credito non sono state percorse.
Per quanto riguarda gli esercizi su scenari a bassi tassi di interesse portati a termine negli anni precedenti al questionario del 2014, circa la metà delle NSA hanno dichiarato di averne proposto almeno uno dal 2010, con richieste sia quantitative che qualitative e, in risposta ai risultati, la metà di queste NSA ha dichiarato di avere adottato una misura riparatoria. Molte NSA ritengono che in uno scenario economico come quello attuale il business assicurativo rimanga sostenibile, ma riconoscono che profittabilità e capacità di solvenza siano messe in discussione.

The Comprehensive Assessment (CA), completed on October the 26th 2014 by the European Central Bank (ECB) and the European Banking Authority (EBA), represent a milestone of unprecedented scope toward the Single Supervisory Mechanism (SSM) which started in November. It involved 130 banks for the Asset Quality Review (AQR) part with total assets of 22 trillion of euro (tr) and risk weighted assets of 8.5 tr, which accounted for the 81.6% of the banking system in the SSM; 103 of these financial institutions were involved also into the Stress Test (ST) analysis. After such a tough assessment it comes natural to draw some conclusions.
The CA was intended to accomplish two main tasks: define a level playing field harmonizing different (national) approaches to bank supervision and quantify the riskiness of the European banks. The first task was mainly addressed through the AQR focusing on bank’s assets on the 31 December 2013, the second one through the ST analysis based on two different scenarios on a 3 year window up to 2016: a Baseline Scenario (BS) and an Adverse Scenario (AS).
Figure 1. Comprehensive assessment capital shortfall by country
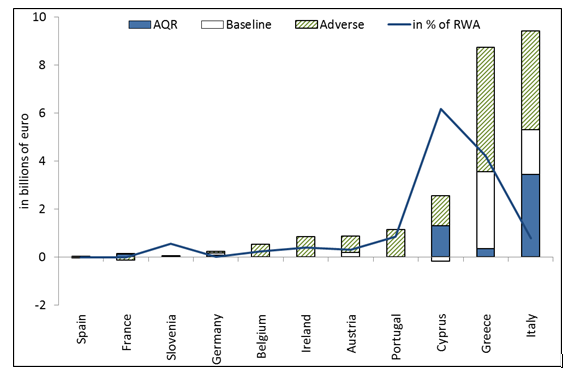
Source: our elaborations on ECB data.
The key quantity in the exercise is the banks’ capital shortfall (SF). In the AQR, a SF emerges if Common Equity Tier 1 (CET1) ratio after the AQR review is less than 8%; in the ST, a SF is recognized if the CET1 ratio in 2016 is less than a given threshold that depends on the scenario: 8% in the BS and 5.5% in the AS. All together CA produced SFs for 24.6 billion of euro (bln) across 25 European banks (Figure 1).
In a recent working paper (Barucci, Baviera and Milani, 2014), AQR and ST exercises have been evaluated looking at the determinants of capital shortfalls.
ECB supervisory approach looks coherent with the standards adopted by national competent authorities (NCA): CET1 ratio represents a cornerstone also for the new supervisory authority, i.e., banks with a strong CET1 position are characterized by a low AQR adjustment.
However, even if the analysis on the determinants of the shortfall in the ST confirms the main evidence provided by the AQR, it is not anymore true that a bank with a high CET1 ratio is characterized by a low SF in the ST: the most informative capital indicator to predict the SF of the ST turns out to be the leverage ratio. The risk density (risk weighted assets over total assets) and, coherently with the new Basel III regulation, the leverage ratio (common equity over total exposure measured according to the Capital Requirements Regulation, CRR) turn out to be important indicators for the ST SF, with a high adjustment in case of a highly leveraged bank. This evidence confirms the outcomes provided in recent literature (see e.g. Haldane (2012), Mayes and Stremmel (2013), Estrella et al. (2012)) on the relevance of leverage rather than the risk adjusted capital ratio.
Some distinctive features of the ECB approach performing the AQR exercise emerge with respect to the one of NCA. Let us mention two of them:
i) There is some evidence of double standards depending on the country where the bank group is incorporated; it seems that the ECB performing the AQR has played bold versus non-core country banks and soft versus core country banks. ii) The AQR outcome depends on bank size: medium size banks (large but not too large) are characterized by the strongest adjustments; there is also some evidence that the SF is negatively related to an indicator of the systemic role of the bank.
As the effect is confirmed also in the ST exercise, may we conclude that very large banks are less risky and are characterized by a better asset evaluation/risk management?
The answer is not so obvious. As we have already mentioned a high adjustment is observed in case of a highly leveraged bank. Furthermore, the AQR SF is negatively affected by the use of an internal rating based (IRB) model, but this evidence is not confirmed by the analysis of the ST, in which the adoption of an internal model (marginally) increases the SF. In particular, we find that those banks with a small risk density relying on IRB models are more exposed to risks. This result confirms the analysis contained in Mariathansan and Merrouche (2014) showing risk weighted manipulation through the internal rating based model mostly in case of weakly capitalized banks. As observed by Visco (2014), the evaluation of the criteria to compute risk weighted assets and the validation of IRB models emerge as one of the main points of attention for the future supervisory activity.
Other interesting points emerge comparing the differences between the AQR and the ST. The coverage ratio of non-performing exposures negatively affects the AQR SF, but it does not affect the ST SF. A similar result holds for the incorporation in a core country versus non-core country, which does not affect the ST shortfall significantly.
What looks clear is that the AQR exercise was mainly concentrated on the traditional credit activity rather than on the assets detained by banks: as a matter of fact, only €1.4 bln of the AQR SF is due to asset evaluation adjustments, while €3.1 bln come from Credit Value Adjustments (CVA) values revision and €43 bln come from the credit adjustments.
Can we conclude that some key elements are missing from the assessment?
Could some very large banks be facilitated by balance sheet management techniques using some financial engineering tools when facing CA and especially in the AQR part of the assessment?
Perhaps. It could be possible; some more words should be spent on these (at least) relevant questions.
[To be continued]
References
La Consob ha pubblicato una comunicazione in materia di distribuzione di prodotti finanziari complessi presso la clientela al dettaglio.
L’EBA ha pubblicato un progetto di norme tecniche di regolamentazione (RTS) sui piani di risoluzione e le linee guida contenenti misure volte ad elimare gli ostacoli alla risoluzione delle crisi.
