L’Autorità europea degli strumenti finanziari e dei mercati (ESMA) ha pubblicato la propria dichiarazione annuale sulle priorità in materia di vigilanza (ECEP – European common enforcement priorities), per il 2024, relativamente alle relazioni finanziarie annuali degli emittenti (corporate reporting)…
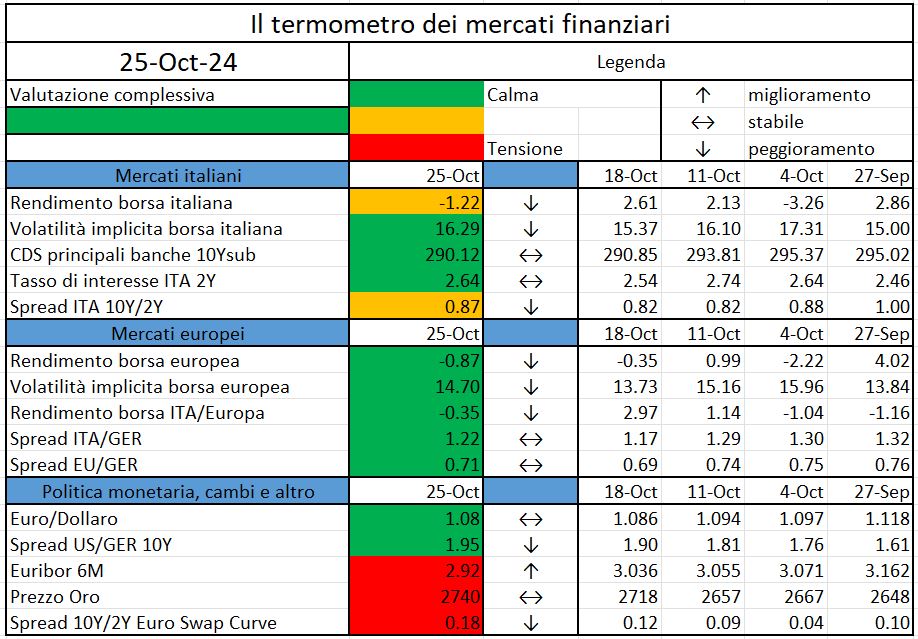
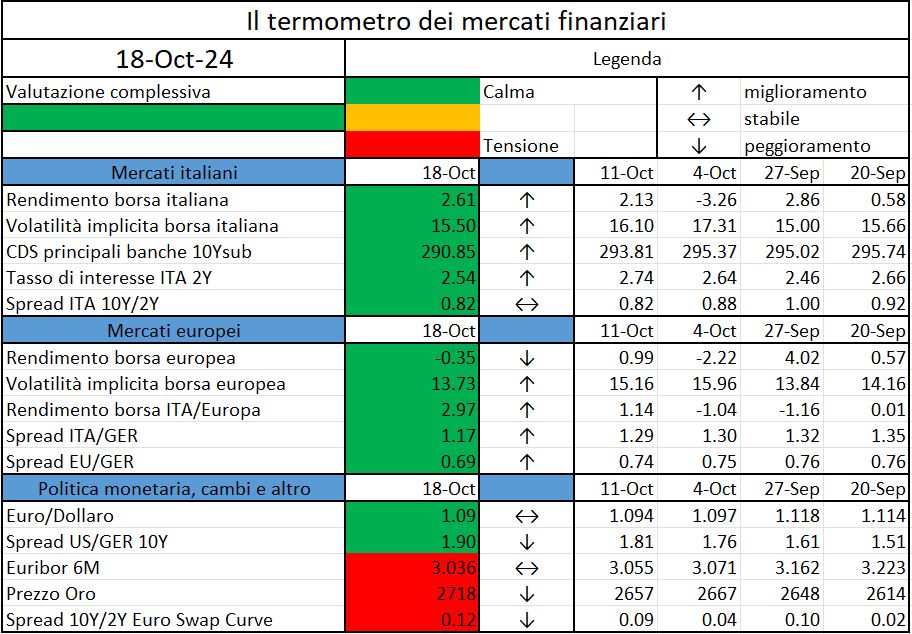
L’iniziativa di Finriskalert.it “Il termometro dei mercati finanziari” vuole presentare un indicatore settimanale sul grado di turbolenza/tensione dei mercati finanziari, con particolare attenzione all’Italia.
Rendimento borsa italiana: rendimento settimanale dell’indice della borsa italiana FTSEMIB;
Volatilità implicita borsa italiana: volatilità implicita calcolata considerando le opzioni at-the-money sul FTSEMIB a 3 mesi;
Future borsa italiana: valore del future sul FTSEMIB;
CDS principali banche 10Ysub: CDS medio delle obbligazioni subordinate a 10 anni delle principali banche italiane (Unicredit, Intesa San Paolo, MPS, Banco BPM);
Tasso di interesse ITA 2Y: tasso di interesse costruito sulla curva dei BTP con scadenza a due anni;
Spread ITA 10Y/2Y : differenza del tasso di interesse dei BTP a 10 anni e a 2 anni;
Rendimento borsa europea: rendimento settimanale dell’indice delle borse europee Eurostoxx;
Volatilità implicita borsa europea: volatilità implicita calcolata sulle opzioni at-the-money sull’indice Eurostoxx a scadenza 3 mesi;
Rendimento borsa ITA/Europa: differenza tra il rendimento settimanale della borsa italiana e quello delle borse europee, calcolato sugli indici FTSEMIB e Eurostoxx;
Spread ITA/GER: differenza tra i tassi di interesse italiani e tedeschi a 10 anni;
Spread EU/GER: differenza media tra i tassi di interesse dei principali paesi europei (Francia, Belgio, Spagna, Italia, Olanda) e quelli tedeschi a 10 anni;
Euro/dollaro: tasso di cambio euro/dollaro;
Spread US/GER 10Y: spread tra i tassi di interesse degli Stati Uniti e quelli tedeschi con scadenza 10 anni;
Prezzo Oro: quotazione dell’oro (in USD)
Euribor 6M: tasso euribor a 6 mesi.
Spread 10Y/2Y Euro Swap Curve: differenza del tasso della curva EURO ZONE IRS 3M a 10Y e 2Y;
I colori sono assegnati in un’ottica VaR: se il valore riportato è superiore (inferiore) al quantile al 15%, il colore utilizzato è l’arancione. Se il valore riportato è superiore (inferiore) al quantile al 5% il colore utilizzato è il rosso. La banda (verso l’alto o verso il basso) viene selezionata, a seconda dell’indicatore, nella direzione dell’instabilità del mercato. I quantili vengono ricostruiti prendendo la serie storica di un anno di osservazioni: ad esempio, un valore in una casella rossa significa che appartiene al 5% dei valori meno positivi riscontrati nell’ultimo anno. Per le prime tre voci della sezione “Politica Monetaria”, le bande per definire il colore sono simmetriche (valori in positivo e in negativo). I dati riportati provengono dal database Thomson Reuters. Infine, la tendenza mostra la dinamica in atto e viene rappresentata dalle frecce: ↑,↓, ↔ indicano rispettivamente miglioramento, peggioramento, stabilità rispetto alla rilevazione precedente.
The financial services industry is experiencing significant disruption as companies navigate increasing customer expectations, shifting regulations, and rising competition.
According to the latest Deloitte’s “State of Generative AI in the Enterprise Q3” report, 70% of Financial Services leaders surveyed agree that their organizations are increasing investments in AI and GenAI, having already seen substantial value from these initiatives.
In this article, we’ll explore the key trends shaping the future of financial services, with a focus on how AI is revolutionizing the sector.
1. AI-Driven Investment Strategies: A New Frontier
One of the most exciting developments in investment banking is the application of AI to create innovative investment strategies. Traditionally, banks have relied on structured data, such as historical financial metrics, to make informed decisions. However, today’s financial markets are more complex, and unstructured data—ranging from news reports to alternative data sources—is becoming critical for decision-making.
GenAI tools, particularly those focused on natural language processing (NLP), are proving invaluable in analyzing vast amounts of unstructured data. By identifying patterns and trends that humans might miss, AI can provide fresh insights, enhance risk assessments, and support portfolio optimization. As the GenAI marketplace grows, GenAI capabilities are expected to be included in the process of offering advice and guidance on investment opportunities.
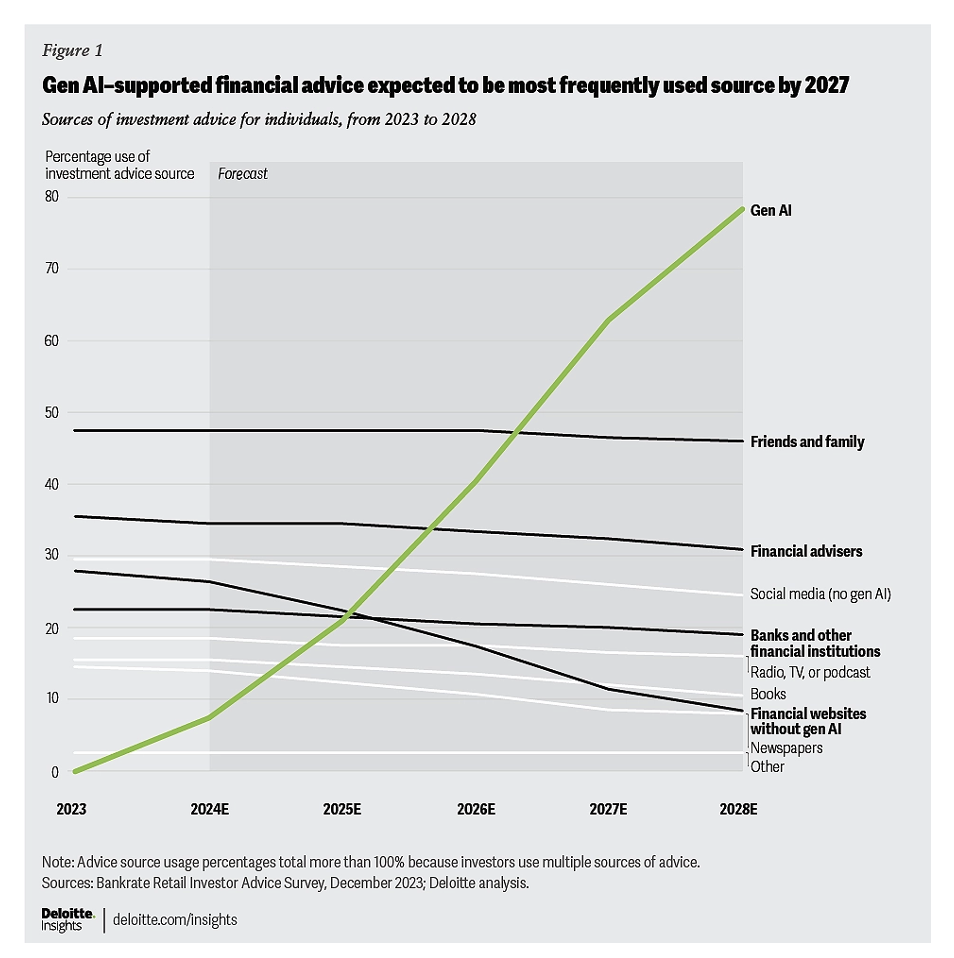
The Deloitte Center for Financial Services forecasts that GenAI-enabled applications will likely dominate the retail investment advice landscape, with usage expected to grow from its current early stage to 78% by 2028.[3] By 2027, these applications could become the primary source of investment advice for retail investors. [3] This marks a major shift in the way investment advice is delivered, as traditional methods like relying on banks and financial advisers are projected to decline and may no longer be sufficient without the integration of GenAI tools.
Figure 1. Evolution of financial advice sources over the next five years with the introduction of GenAI capabilities[3]
2. GenAI-Enabled Fraud: How Banks Can Protect Customers and Strengthen Trust
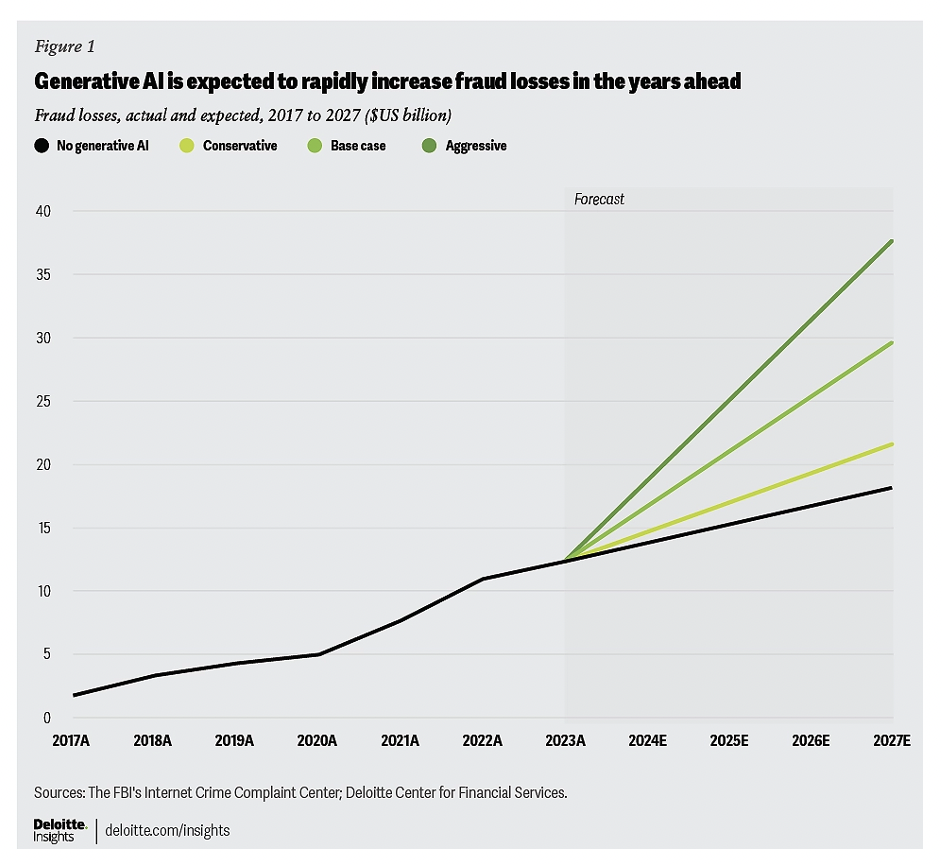
Deloitte’s Center for Financial Services predicts that generative AI could drive a 32% annual increase in fraud losses in the United States. [3] The vast potential of generative AI amplifies both the scale and complexity of fraud.
Figure 2. Expected increase in fraud losses due to the rise of GenAI[3]
The key to staying ahead of generative AI-enabled fraud is continued investment in AI technologies. Banks are now using advanced AI and machine learning tools to detect and respond to sophisticated fraud threats in real time, moving beyond outdated rule-based systems.
Customers expect security and efficiency, and failures can damage the relationship. To strengthen trust, banks should highlight their prevention efforts through proactive communication about potential threats. By integrating AI-powered tools like virtual agents, banks can deliver dynamic, personalized support that adapts to each client’s changing financial needs.
3. GenAI and Quantum Computing: Driving the Next Wave of Technology Adoption in Investment Banking
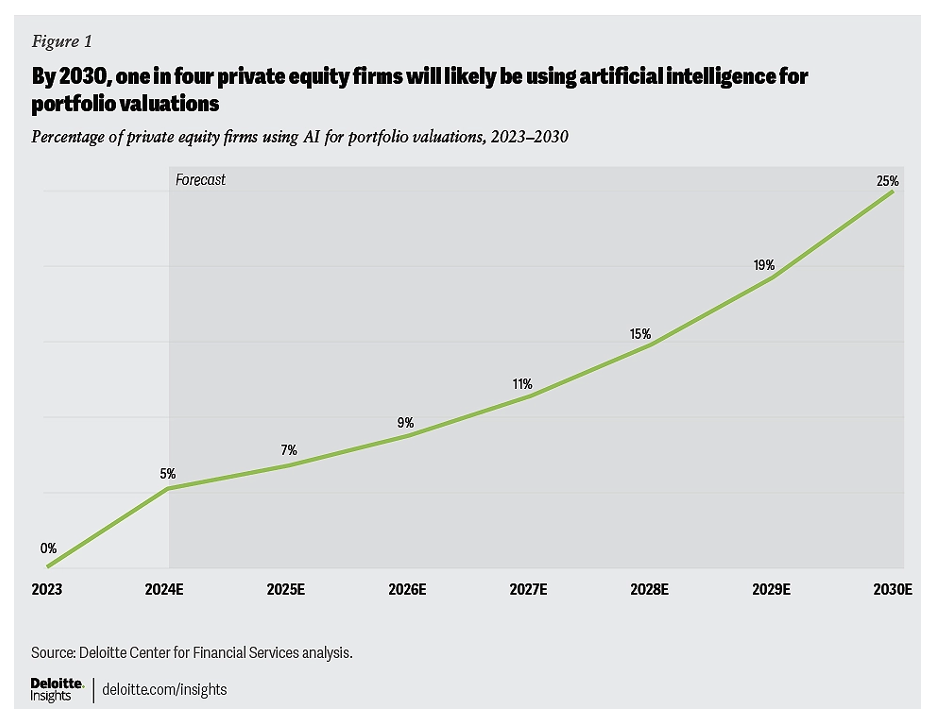
Over the next five to seven years, Deloitte predicts that up to 25% of private equity (PE) firms will adopt AI to enhance portfolio valuations, increasing both the frequency and accuracy of these assessments.[3]
Figure 3. The rise of new technologies in financial services: A case of private equity using AI for portfolio valuations[3]
The financial services sector is at the forefront of adopting new technologies to boost efficiency and performance. Innovations like generative AI (GenAI) and quantum computing are reshaping how investment banks operate.
GenAI is automating tasks such as document processing, data analysis, and report generation, allowing human talent to focus on more complex, high-value activities. AI-powered virtual assistants enhance productivity and enable faster responses to market fluctuations.
While still emerging, quantum computing offers immense potential for financial institutions. By leveraging quantum algorithms, banks can solve complex problems at extraordinary speeds, essential for tasks like risk modeling and financial forecasting. Quantum-enhanced AI also promises to strengthen cybersecurity, safeguarding sensitive financial data in an increasingly digital landscape.
Together, these technologies are paving the way for a more productive, secure, and future-ready financial services industry.
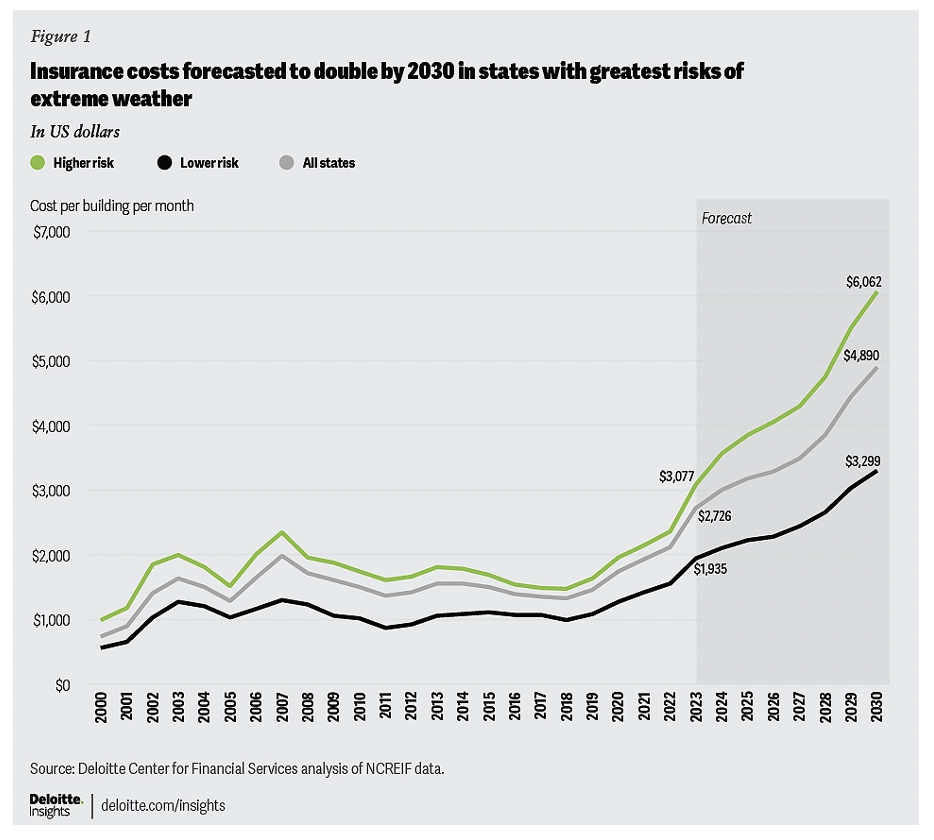
4. Adapting to Climate Change: How AI and Advanced Technologies Are Transforming Insurance Strategies and Premiums
The increasing frequency and severity of natural disasters, driven by climate change, are causing more damage to assets each year. Property and casualty insurers can adopt new strategies, such as loss prevention and mitigation, to remain viable in regions vulnerable to climate risks.
AI and advanced technologies provide them with essential tools to adapt to the growing challenges of climate change. With enhanced satellite imaging and AI-driven solutions, insurers can map high-risk areas more accurately. As climate shifts become more frequent, dynamic risk mapping with AI helps insurers stay ahead of emerging threats. AI canassess climate risks and property vulnerabilities, identifying hazard-prone zones and guiding safer construction or rebuilding efforts.
As climate risks grow, insurers are responding by raising premiums, particularly for buildings in vulnerable areas. According to Deloitte Center for Financial Services, the average monthly insurance cost for a commercial property in the U.S. could rise from $2,726 in 2023 to $4,890 by 2030, driven by an 8.7% compound annual growth rate. [3]
Figure 4. Scenarios of insurance cost increases driven by climate risk[3]
In this rapidly changing environment, AI plays a pivotal role in helping insurers anticipate risks, adjust pricing, and support risk mitigation efforts.
AI Solutions Addressing Emerging Trends in Financial Services
Conversational AI
In the financial services industry, improving customer experience and operational efficiency is crucial, and conversational AI solutions are transforming how companies interact with customers. These AI-powered systems—such as chatbots and virtual assistants—are revolutionizing the customer service journey by automating routine interactions, reducing wait times, and ensuring faster responses to inquiries.
Conversational AI can go beyond simple scripted responses and engage customers in natural, dynamic conversations. GenAI-powered chatbots can understand and process more complex queries, providing personalized answers based on customer data and past interactions.
The digitalization of customer care processes also brings substantial cost savings to financial institutions. Conversational AI systems can operate 24/7, providing continuous customer support. This accessibility not only enhances satisfaction but also allows institutions to serve a global customer base, regardless of time zones.
Enhanced Fraud Detection
AI is becoming an indispensable tool for enhancing fraud detection and security in the Financial Services industry. One of the keyways AI is being used is through the identification of unusual patterns or outliers within a bank’s databases. By analyzing large volumes of transactional and behavioral data, AI systems can spot anomalies that deviate from normal patterns of activity. This could include unusual spending behaviors, such as large withdrawals or purchases outside of a customer’s typical geographic location, as well as rapid changes in account activity, like multiple logins in short periods or from different devices.
AI-driven fraud detection systems continuously evolve, and this dynamic learning capability enables banks to improve their fraud prevention measures over time, providing more reliable alerts. As a result, AI not only strengthens the bank’s security framework but also ensures a smoother and more secure experience for customers.
AI-driven underwriting
As climate change accelerates, the financial services industry (FSI) faces mounting pressure to adapt to new, complex risks, particularly in underwriting processes. Traditionally a manual, resource-heavy task, underwriting is essential for assessing risks related to insurance policies, loans, and investments. However, with more frequent and severe climate-related events, such as floods, wildfires, and hurricanes, traditional methods are no longer sufficient.
AI and automation offer a solution by enhancing underwriting efficiency and accuracy. By integrating real-time climate data, satellite imaging, and predictive models, AI can better assess the risks associated with natural disasters and changing climate conditions allowing insurers and lenders to adjust premiums or loan terms accordingly.
Conclusion
The Financial Services Industry (FSI) is data-intensive, simultaneously representing an opportunity for business success and a challenge to operations and efficiency. Artificial intelligence is rapidly reshaping the financial services industry, driving innovation across multiple sectors. As technology continues to evolve, the full potential of AI in the financial sector is just beginning to be realized, promising a transformative impact on the way we manage money, invest, and plan.
While good progress continues in completing the Roadmap’s priority actions, it will take time for some of the priority actions to translate into tangible outcomes…
Al contrario di un approccio progettuale più tradizionale, dove requisiti, budget e tempi sono pianificati all’inizio, una metodologia più “agile” permette una migliore flessibilità e personalizzazione…
L’iniziativa di Finriskalert.it “Il termometro dei mercati finanziari” vuole presentare un indicatore settimanale sul grado di turbolenza/tensione dei mercati finanziari, con particolare attenzione all’Italia.
Rendimento borsa italiana: rendimento settimanale dell’indice della borsa italiana FTSEMIB;
Volatilità implicita borsa italiana: volatilità implicita calcolata considerando le opzioni at-the-money sul FTSEMIB a 3 mesi;
Future borsa italiana: valore del future sul FTSEMIB;
CDS principali banche 10Ysub: CDS medio delle obbligazioni subordinate a 10 anni delle principali banche italiane (Unicredit, Intesa San Paolo, MPS, Banco BPM);
Tasso di interesse ITA 2Y: tasso di interesse costruito sulla curva dei BTP con scadenza a due anni;
Spread ITA 10Y/2Y : differenza del tasso di interesse dei BTP a 10 anni e a 2 anni;
Rendimento borsa europea: rendimento settimanale dell’indice delle borse europee Eurostoxx;
Volatilità implicita borsa europea: volatilità implicita calcolata sulle opzioni at-the-money sull’indice Eurostoxx a scadenza 3 mesi;
Rendimento borsa ITA/Europa: differenza tra il rendimento settimanale della borsa italiana e quello delle borse europee, calcolato sugli indici FTSEMIB e Eurostoxx;
Spread ITA/GER: differenza tra i tassi di interesse italiani e tedeschi a 10 anni;
Spread EU/GER: differenza media tra i tassi di interesse dei principali paesi europei (Francia, Belgio, Spagna, Italia, Olanda) e quelli tedeschi a 10 anni;
Euro/dollaro: tasso di cambio euro/dollaro;
Spread US/GER 10Y: spread tra i tassi di interesse degli Stati Uniti e quelli tedeschi con scadenza 10 anni;
Prezzo Oro: quotazione dell’oro (in USD)
Euribor 6M: tasso euribor a 6 mesi.
Spread 10Y/2Y Euro Swap Curve: differenza del tasso della curva EURO ZONE IRS 3M a 10Y e 2Y;
I colori sono assegnati in un’ottica VaR: se il valore riportato è superiore (inferiore) al quantile al 15%, il colore utilizzato è l’arancione. Se il valore riportato è superiore (inferiore) al quantile al 5% il colore utilizzato è il rosso. La banda (verso l’alto o verso il basso) viene selezionata, a seconda dell’indicatore, nella direzione dell’instabilità del mercato. I quantili vengono ricostruiti prendendo la serie storica di un anno di osservazioni: ad esempio, un valore in una casella rossa significa che appartiene al 5% dei valori meno positivi riscontrati nell’ultimo anno. Per le prime tre voci della sezione “Politica Monetaria”, le bande per definire il colore sono simmetriche (valori in positivo e in negativo). I dati riportati provengono dal database Thomson Reuters. Infine, la tendenza mostra la dinamica in atto e viene rappresentata dalle frecce: ↑,↓, ↔ indicano rispettivamente miglioramento, peggioramento, stabilità rispetto alla rilevazione precedente.
Questo sito utilizza cookie tecnici e di profilazione, propri e di terze parti, per garantire la corretta navigazione, analizzare il traffico e misurare l'efficacia delle attività di comunicazione.
Questo sito Web utilizza i cookie per migliorarne l'esperienza di navigazione. I cookie classificati come necessari, sono essenziali alle funzioni di base sito e vengono sempre memorizzati nel tuo browser. I cookie di terze parti, che ci aiutano ad analizzare e capire come utilizzi questo sito, vengono memorizzati nel tuo browser solo con il tuo consenso. Di seguito hai la possibilità di disattivare questi cookie. Tieni in conto che la disattivazione di alcuni di questi cookie potrebbe influire sulla tua esperienza di navigazione.
Necessary cookies are absolutely essential for the website to function properly. These cookies ensure basic functionalities and security features of the website, anonymously.
Cookie
Durata
Descrizione
cookielawinfo-checkbox-analytics
1 year
Cookie tecnico impostato dal plugin GDPR Cookie Consent che viene utilizzato per registrare il consenso dell'utente per i cookie nella categoria "Analitici".
cookielawinfo-checkbox-necessary
1 year
Cookie tecnico impostato dal plugin GDPR Cookie Consent che viene utilizzato per registrare il consenso dell'utente ai cookie.
CookieLawInfoConsent
1 year
Cookie tecnico impostato dal plugin GDPR Cookie Consent per salvare le scelte si/no dell'utente per ciascuna categoria.
viewed_cookie_policy
1 year
Cookie tecnico impostato dal plugin GDPR Cookie Consent che registra lo stato del pulsante predefinito della categoria corrispondente.
Analytical cookies are used to understand how visitors interact with the website. These cookies help provide information on metrics the number of visitors, bounce rate, traffic source, etc.
Cookie
Durata
Descrizione
_pk_id.gV3j99y0AE.0928
1 year 27 days
Cookie analitico impostato da Matomo e utilizzato per memorizzare alcuni dettagli sull'utente come l'ID univoco del visitatore
_pk_ses.gV3j99y0AE.0928
30 minutes
Cookie analitico impostato da Matomo di breve durata e utilizzato per memorizzare temporaneamente i dati della visita