The DeFi platform was the victim of an attack shortly after launch, with 183 ETH compromised. After an initial selloff, FORCE tokens are in recovery mode Monday…
Apr
06
2021
The DeFi platform was the victim of an attack shortly after launch, with 183 ETH compromised. After an initial selloff, FORCE tokens are in recovery mode Monday…
Bitcoin price started a fresh increase and it cleared the $58,250 resistance against the US Dollar. BTC is now showing positive signs and it might soon revisit $60,000...
https://www.newsbtc.com/analysis/btc/bitcoin-settles-above-100-sma/

L’indicatore di Mahalanobis permette di evidenziare periodi di stress nei mercati finanziari. Si tratta di un indicatore che dipende dalle volatilità e dalle correlazioni di un particolare universo investimenti preso ad esame. Nello specifico ci siamo occupati dei mercati azionari europei e dei settori azionari globali.
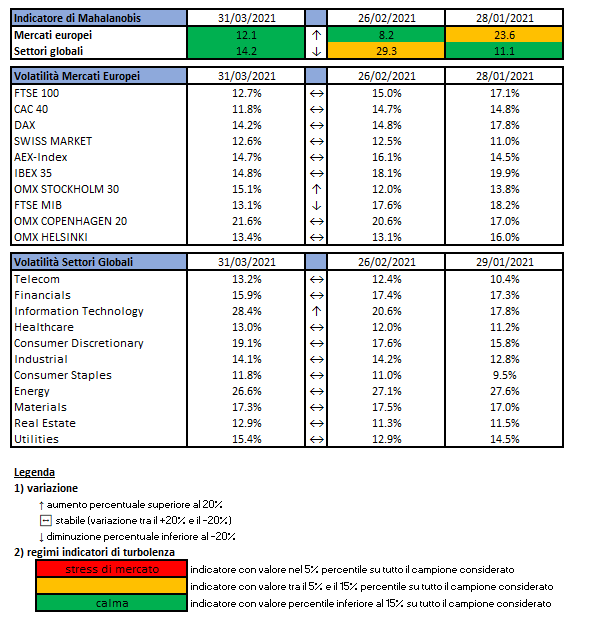
Gli indici utilizzati sono:

Le volatilità riportate sono storiche e calcolate sugli ultimi 30 trading days disponibili. Per ogni asset-class dunque sono prima calcolati i rendimenti logaritmici dei prezzi degli indici di riferimento, successivamente si procede col calcolo della deviazione standard dei rendimenti, ed infine si procede a moltiplicare la deviazione standard per il fattore di annualizzazione.
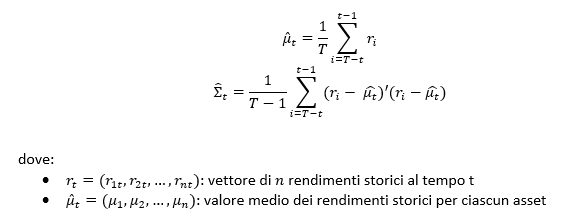
Per il calcolo della distanza di Mahalnobis si procede dapprima con la stima della matrice di covarianza tra le asset-class. Si considera l’approccio delle finestre mobili. Come con la volatilità, si procede prima con il calcolo dei rendimenti logaritmici e poi con la stima storica della matrice di covarianza, come riportato di seguito.
Supponendo una finestra mobile di T periodi, viene calcolato il valore medio e la matrice varianza covarianza al tempo t come segue:
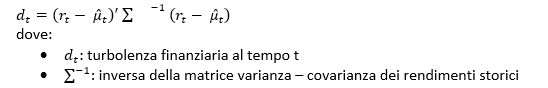
La distanza di Mahalanobis è definita formalmente come:
Le parametrizzazioni che sono state scelte sono:
Le statistiche percentili sono state calcolate a partire dalla distribuzione dell’indicatore di Mahalanobis dal Dicembre 1997 al Dicembre 2019 su rilevazioni mensili.
Ulteriori dettagli sono riportati in questo articolo.
Disclaimer: Le informazioni contenute in questa pagina sono esclusivamente a scopo informativo e per uso personale. Le informazioni possono essere modificate da finriskalert.it in qualsiasi momento e senza preavviso. Finriskalert.it non può fornire alcuna garanzia in merito all’affidabilità, completezza, esattezza ed attualità dei dati riportati e, pertanto, non assume alcuna responsabilità per qualsiasi danno legato all’uso, proprio o improprio delle informazioni contenute in questa pagina. I contenuti presenti in questa pagina non devono in alcun modo essere intesi come consigli finanziari, economici, giuridici, fiscali o di altra natura e nessuna decisione d’investimento o qualsiasi altra decisione deve essere presa unicamente sulla base di questi dati.

L’iniziativa di Finriskalert.it “Il termometro dei mercati finanziari” vuole presentare un indicatore settimanale sul grado di turbolenza/tensione dei mercati finanziari, con particolare attenzione all’Italia.
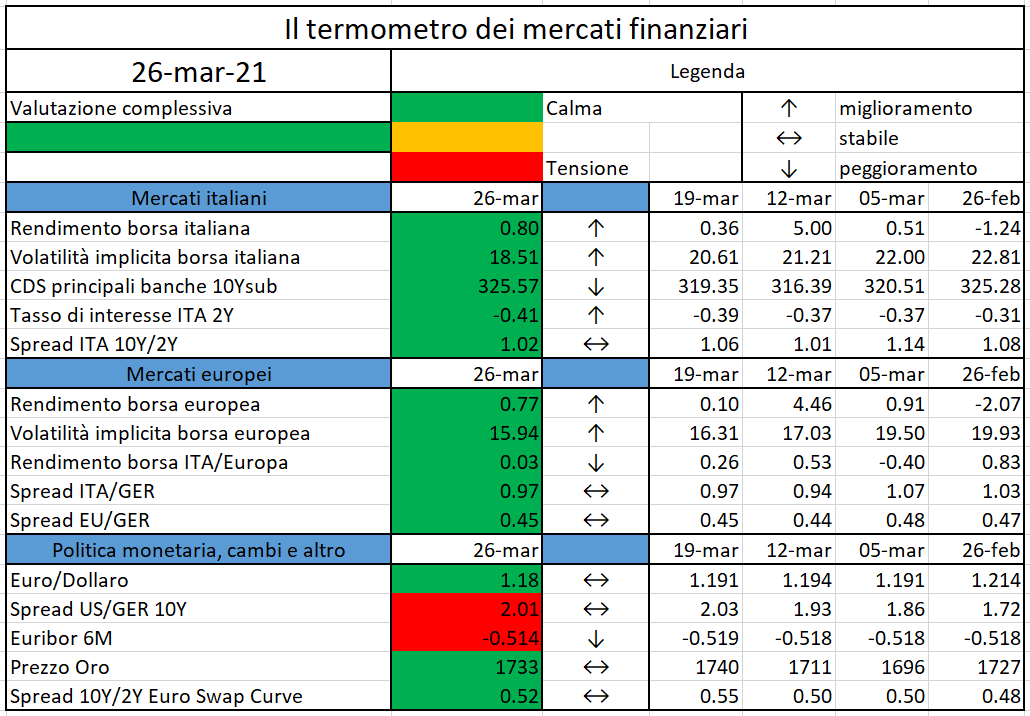
Significato degli indicatori
I colori sono assegnati in un’ottica VaR: se il valore riportato è superiore (inferiore) al quantile al 15%, il colore utilizzato è l’arancione. Se il valore riportato è superiore (inferiore) al quantile al 5% il colore utilizzato è il rosso. La banda (verso l’alto o verso il basso) viene selezionata, a seconda dell’indicatore, nella direzione dell’instabilità del mercato. I quantili vengono ricostruiti prendendo la serie storica di un anno di osservazioni: ad esempio, un valore in una casella rossa significa che appartiene al 5% dei valori meno positivi riscontrati nell’ultimo anno. Per le prime tre voci della sezione “Politica Monetaria”, le bande per definire il colore sono simmetriche (valori in positivo e in negativo). I dati riportati provengono dal database Thomson Reuters. Infine, la tendenza mostra la dinamica in atto e viene rappresentata dalle frecce: ↑,↓, ↔ indicano rispettivamente miglioramento, peggioramento, stabilità rispetto alla rilevazione precedente.
Disclaimer: Le informazioni contenute in questa pagina sono esclusivamente a scopo informativo e per uso personale. Le informazioni possono essere modificate da finriskalert.it in qualsiasi momento e senza preavviso. Finriskalert.it non può fornire alcuna garanzia in merito all’affidabilità, completezza, esattezza ed attualità dei dati riportati e, pertanto, non assume alcuna responsabilità per qualsiasi danno legato all’uso, proprio o improprio delle informazioni contenute in questa pagina. I contenuti presenti in questa pagina non devono in alcun modo essere intesi come consigli finanziari, economici, giuridici, fiscali o di altra natura e nessuna decisione d’investimento o qualsiasi altra decisione deve essere presa unicamente sulla base di questi dati.

Esattamente un anno fa l’Italia, da lì a breve seguita da tutti gli altri Paesi europei, entrava in un lockdown per cercare di arrestare una pandemia che, oltre a causare migliaia di decessi, ha generato danni all’economia mai visti negli ultimi decenni. Interi comparti produttivi, fra cui alcuni vitali per l’Italia come il turismo, hanno visto da un giorno all’altro azzerarsi i propri introiti, pur dovendo far fronte ai costi fissi e ad altri oneri. Numerosi sono stati i provvedimenti che hanno cercato di ‘tamponare’ la situazione attraverso trasferimenti statali, moratorie dei prestiti, garanzie pubbliche, in gran parte ancora in vigore.
Il tema del credito alle PMI è chiaramente al centro dell’attenzione in questa situazione. Da una parte la possibilità per le aziende di avere sostegno finanziario è stata una richiesta dominante nei mesi passati, ma dall’altra appena nei prossimi mesi verranno pubblicati i bilanci del 2020 molti si chiederanno se i debiti contratti dalle aziende potranno essere onorati.
Una fonte di finanziamento per le PMI che negli ultimi anni si è ricavata uno spazio non trascurabile è quella dei minibond, ovvero obbligazioni e titoli di debito emessi per raccogliere denaro sul mercato mobiliare. Essi rappresentano una forma di finanziamento alternativa e complementare al credito bancario per diversificare le fonti e accedere al mercato competitivo degli investitori professionali, in preparazione (come se fosse un ‘allenamento’) a successive operazioni più complesse come possono essere il private equity o la quotazione in Borsa. Sono numerose inoltre le piccole aziende che, pur avendo accesso al credito bancario, vogliono sperimentare i minibond per acquisire competenze nuove rispetto al mercato del capitale e ottenere un effetto di ‘certificazione’ e di ‘legittimazione’. Questo mercato è studiato ormai da tempo dall’Osservatorio Minibond del Politecnico di Milano, che pochi giorni fa ha presentato il suo nuovo Report annuale.
Apparentemente l’ecosistema sembra avere retto: il numero delle emissioni è leggermente sceso (ma più che altro nel primo semestre 2020), il flusso della raccolta è il più basso degli ultimi 4 anni (ma non di molto). Grazie a progetti mirati come i ‘basket bond’ regionali, è rimasto significativo il numero delle ‘nuove’ PMI emittenti che, proprio nell’annus horribilis, si sono affacciate per la prima volta sul mercato del capitale. Ciò è avvenuto anche grazie agli interventi emergenziali attuati dallo Stato, che si sono concretizzati in un programma di garanzie pubbliche che ha interessato anche il mondo dei minibond, attraverso il Fondo di Garanzia e la Garanzia Italia di SACE. Inoltre nel 2020 è diventata operativa la possibilità per i portali autorizzati di equity crowdfunding di collocare minibond di SpA a particolari categorie di investitori, a fine 2020 attuata da 3 portali che hanno raccolto € 14,7 milioni.
Le imprese emittenti
La ricerca ha identificato 671 imprese italiane che alla data del 31 dicembre 2020 avevano collocato minibond (identificati come le emissioni di importo inferiore a € 50 milioni da società non finanziarie); di queste, 409 (il 61,0%) sono PMI in base alla definizione UE. Nel 2020 le emittenti sono state 176 (di cui ben 131 si sono affacciate sul mercato per la prima volta), in lieve calo rispetto al 2019. Le emittenti del 2020 sono per il 61,3% SpA, per il 36,4% Srl (tipologia in forte aumento) e per il 2,3% società cooperative. Il volume dei ricavi delle imprese emittenti è sempre molto variabile: ben 56 emittenti (31,8%) fatturavano meno di € 10 milioni prima del collocamento. Per quanto riguarda il settore di attività, il comparto manifatturiero è in testa (36,4% del campione 2020) ma salgono il commercio e le attività professionali (entrambi al 10,8%) e le costruzioni (9,7%).
La collocazione geografica ci regala una sorpresa; nel 2020 la Campania è in testa per numero di emittenti (43) e supera Lombardia (36) e Veneto (29). Il risultato è legato al progetto Garanzia Campania Bond, un ‘basket bond’ che ha cartolarizzato le emissioni di diverse aziende in un’unica emissione, con l’intervento della Cassa Depositi e Prestiti come ‘anchor investor’.
Rispetto alle motivazioni del collocamento, si conferma come dominante l’obiettivo di finanziare la crescita interna dell’azienda (nel 60,5% dei casi dell’intero campione). Al secondo posto troviamo l’obiettivo di rifinanziare le passività finanziarie (10,4%). Seguono il bisogno di alimentare il ciclo di cassa del capitale circolante (soprattutto per le PMI) e le strategie di crescita esterna tramite acquisizioni (soprattutto per le grandi imprese).
Le emissioni
Il database dell’Osservatorio è arrivato a collezionare 1.005 emissioni di minibond effettuate dalle imprese del campione a partire da novembre 2012 (in alcuni casi le imprese hanno condotto più emissioni).
Il valore nominale totale dei minibond nel campione supera € 7,07 miliardi (€ 2,53 miliardi considerando solo le emissioni fatte da PMI). Come evidenzia la Figura 1, il 2020 ha contribuito con € 920 milioni da 194 emissioni (l’anno scorso erano state 205): il volume totale di raccolta è il più basso dal 2016 (ma non di tanto) perché si è ulteriormente ridotto il valore medio delle emissioni (nuovo minimo storico € 4,59 milioni nel secondo semestre 2020). La raccolta per le sole PMI è infatti ai massimi degli ultimi 3 anni; sono mancate soprattutto le emissioni sopra € 20 milioni.
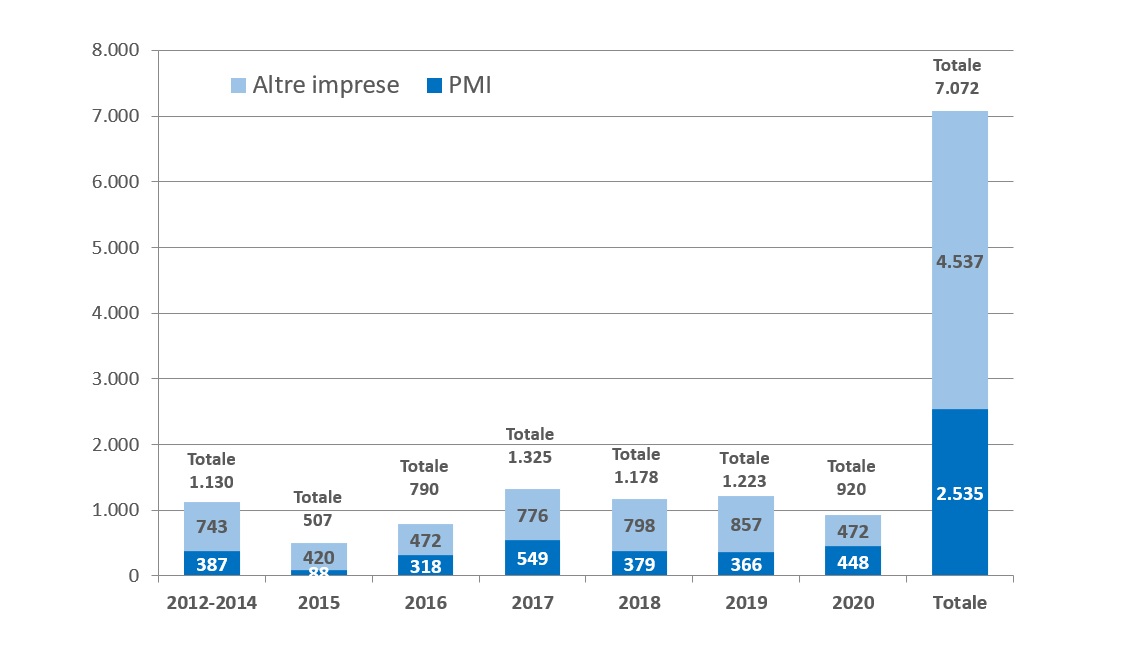
Nel campione totale, il 65% delle emissioni è sotto la soglia di € 5 milioni e nel 2020 la percentuale sale quasi al 76%.
Fra tutti i minibond, meno della metà (il 41%) sono stati quotati su un mercato borsistico; nel 2020 tale percentuale è scesa al minimo storico del 16% (l’11% su ExtraMOT PRO3 e il 5% su un listino estero). Per quanto riguarda la scadenza, la distribuzione continua ad essere molto variegata, con una serie di titoli short term con maturity a pochi mesi ed emissioni a più lunga scadenza. Il valore medio del 2020 è 6,34 anni (in aumento rispetto al 2019). Il 61,0% dei titoli prevede il rimborso del titolo a rate successive (amortizing). Nelle emissioni a breve scadenza è relativamente più frequente la modalità bullet, con un rimborso integrale alla scadenza.
Per quanto riguarda la cedola, nella maggioranza dei casi è fissa ma nel 15,6% dei casi è indicizzata. Il valore medio della cedola fissa per l’intero campione è pari a 4,48%, quello mediano è il 4,40%. Nel 2020 continua a scendere la remunerazione (la media è 3,61% rispetto a 4,34% dell’anno prima) anche grazie a numerose emissioni che prevedono garanzie pubbliche.
I minibond italiani sono associati a un rating emesso da agenzie autorizzate nel 23% dei casi. Il ricorso al rating è rimasto contenuto nel 2020 (solo il 14% delle emissioni l’ha ottenuto, stessa percentuale del 2019).
La presenza di opzioni call e put rispetto al rimborso del capitale è frequente nei minibond; nel 2020 sono aumentati quelli che presentano la sola opzione call di rimborso anticipato a discrezione dell’emittente.
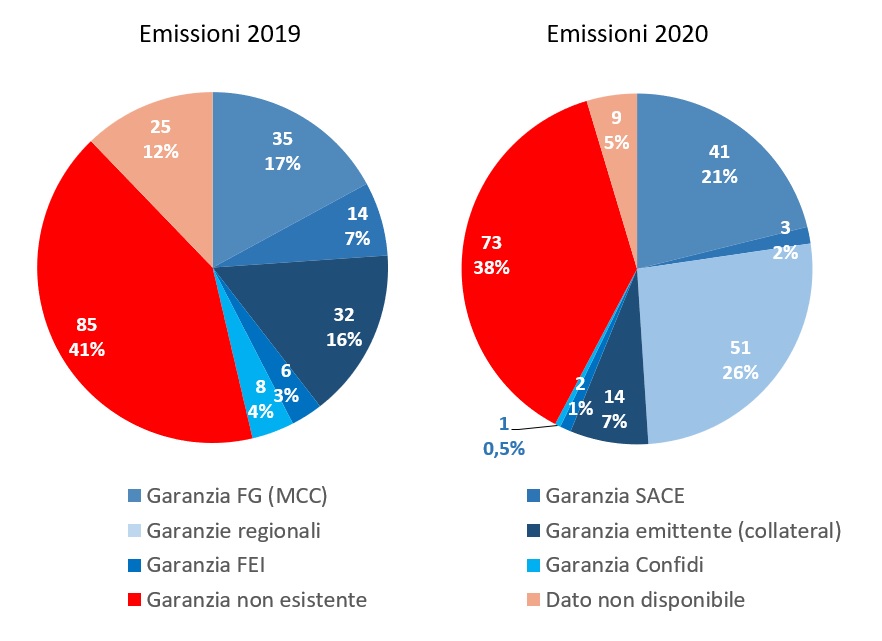
È molto interessante vedere cosa è successo rispetto alle garanzie sul rimborso del capitale, che possono dare maggiore sicurezza agli investitori. Nelle emissioni del 2020 (si veda la Figura 2) si conferma l’aumento significativo nelle adozioni della garanzia, da parte di 112 emissioni (il 58%). La più diffusa è quella rilasciata dalle Regioni (soprattutto attraverso i basket bond in Campania e Puglia) con il 26% dei casi, seguita da quella eleggibile per il Fondo di Garanzia (21%) che però è rilasciata all’investitore. Nel 7% dei casi la garanzia era offerta autonomamente dall’emittente, attraverso un pegno o fideiussione. Appare quindi che nel 2020 ci sia stata soprattutto una ‘sostituzione’ delle garanzie private con quelle pubbliche.
L’impegno a rispettare determinati covenant in funzione di ratio patrimoniali-reddituali-finanziari è pure aumentato e nel 2020 riguarda il 63% dei casi.
Per quanto riguarda gli investitori che hanno sottoscritto i minibond, il 2020 ha visto il ruolo importante delle banche italiane (hanno sottoscritto il 41% dei volumi) seguite dai fondi di private debt (20%) che in parte hanno deviato sulle operazioni di direct lending. Fondi e banche estere contribuiscono con il 15%; importante anche il ruolo della Cassa Depositi e Prestiti (12%).
Le prospettive future
In sintesi, ci sembra di poter dire che il mercato dei minibond nel 2020 abbia resistito alla pandemia; le garanzie pubbliche a nostro avviso sono state utili ma non determinanti; molto più rilevante è stato l’effetto di risorse messe a disposizione da soggetti quali la Cassa Depositi e Prestiti e il Fondo Europeo per gli Investimenti che hanno dato carburante alle sottoscrizioni.
Pure importante è stato il ruolo delle banche attraverso i minibond ‘captive’ originati e sottoscritti internamente.
I temi che nel 2021 meritano attenzione sono essenzialmente tre: (1) monitorare la qualità dei debiti su minibond sulla base dei dati di bilancio del 2020, per evitare un effetto ‘domino’ sul mercato; (2) approfittare della nuova normativa su PIR ‘alternativi’ ed ELTIF per estendere il mercato dei minibond al risparmio gestito; (3) valorizzare le emissioni orientate alle tematiche green e social, che possono tranquillamente riguardare anche le PMI e non solo le grandi imprese.
The European Securities and Markets Authority, the EU’s securities markets regulator, publishes today advice to the European Commission related to data reporting service providers (DRSP)…
On 24 March 2021 the Governing Council adopted the ECB’s Annual Report 2020, which will be presented to the Committee on Economic and Monetary Affairs of the European Parliament and made available on the ECB’s website in 22 official languages of the European Union on 14 April 2021…
https://www.ecb.europa.eu//press/govcdec/otherdec/2021/html/ecb.gc210326~400c1fdea5.en.html
MicroStrategy and its head honcho Michael Saylor have become synonymous with Bitcoin, responsible for kicking off the corporate treasury reserve trend that’s transpired ever since…
https://www.newsbtc.com/news/bitcoin/crypto-analyst-microstrategy-bitcoin/
With institutions demanding protection from inflation and dollar depreciation, historical trends could see BTC/USD 8X from current prices, says Bloomberg Intelligence…
https://cointelegraph.com/news/bitcoin-can-reach-400k-in-2021-as-risk-off-reserve-asset-bloomberg
L’iniziativa di Finriskalert.it “Il termometro dei mercati finanziari” vuole presentare un indicatore settimanale sul grado di turbolenza/tensione dei mercati finanziari, con particolare attenzione all’Italia.
Significato degli indicatori
I colori sono assegnati in un’ottica VaR: se il valore riportato è superiore (inferiore) al quantile al 15%, il colore utilizzato è l’arancione. Se il valore riportato è superiore (inferiore) al quantile al 5% il colore utilizzato è il rosso. La banda (verso l’alto o verso il basso) viene selezionata, a seconda dell’indicatore, nella direzione dell’instabilità del mercato. I quantili vengono ricostruiti prendendo la serie storica di un anno di osservazioni: ad esempio, un valore in una casella rossa significa che appartiene al 5% dei valori meno positivi riscontrati nell’ultimo anno. Per le prime tre voci della sezione “Politica Monetaria”, le bande per definire il colore sono simmetriche (valori in positivo e in negativo). I dati riportati provengono dal database Thomson Reuters. Infine, la tendenza mostra la dinamica in atto e viene rappresentata dalle frecce: ↑,↓, ↔ indicano rispettivamente miglioramento, peggioramento, stabilità rispetto alla rilevazione precedente.
Disclaimer: Le informazioni contenute in questa pagina sono esclusivamente a scopo informativo e per uso personale. Le informazioni possono essere modificate da finriskalert.it in qualsiasi momento e senza preavviso. Finriskalert.it non può fornire alcuna garanzia in merito all’affidabilità, completezza, esattezza ed attualità dei dati riportati e, pertanto, non assume alcuna responsabilità per qualsiasi danno legato all’uso, proprio o improprio delle informazioni contenute in questa pagina. I contenuti presenti in questa pagina non devono in alcun modo essere intesi come consigli finanziari, economici, giuridici, fiscali o di altra natura e nessuna decisione d’investimento o qualsiasi altra decisione deve essere presa unicamente sulla base di questi dati.
