Dispersed economic and financial market impact on countries and sectors could lead to concentration of risks in some areas…
https://www.ecb.europa.eu//press/pr/date/2020/html/ecb.pr201125~01dfca322a.en.html
Dispersed economic and financial market impact on countries and sectors could lead to concentration of risks in some areas…
https://www.ecb.europa.eu//press/pr/date/2020/html/ecb.pr201125~01dfca322a.en.html
The emergence of distributed ledger technology (DLT) and rapid advances in traditional centralised systems are moving the technological horizon of money and payments…
The European Banking Authority (EBA), the European Insurance and Occupational Pensions
Authority (EIOPA …
https://www.esma.europa.eu/file/69147/download?token=4Lolju50

L’iniziativa di Finriskalert.it “Il termometro dei mercati finanziari” vuole presentare un indicatore settimanale sul grado di turbolenza/tensione dei mercati finanziari, con particolare attenzione all’Italia.
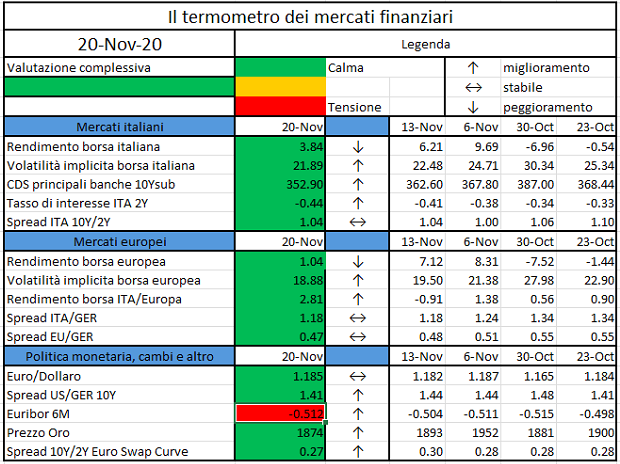
Significato degli indicatori
I colori sono assegnati in un’ottica VaR: se il valore riportato è superiore (inferiore) al quantile al 15%, il colore utilizzato è l’arancione. Se il valore riportato è superiore (inferiore) al quantile al 5% il colore utilizzato è il rosso. La banda (verso l’alto o verso il basso) viene selezionata, a seconda dell’indicatore, nella direzione dell’instabilità del mercato. I quantili vengono ricostruiti prendendo la serie storica di un anno di osservazioni: ad esempio, un valore in una casella rossa significa che appartiene al 5% dei valori meno positivi riscontrati nell’ultimo anno. Per le prime tre voci della sezione “Politica Monetaria”, le bande per definire il colore sono simmetriche (valori in positivo e in negativo). I dati riportati provengono dal database Thomson Reuters. Infine, la tendenza mostra la dinamica in atto e viene rappresentata dalle frecce: ↑,↓, ↔ indicano rispettivamente miglioramento, peggioramento, stabilità rispetto alla rilevazione precedente.
Disclaimer: Le informazioni contenute in questa pagina sono esclusivamente a scopo informativo e per uso personale. Le informazioni possono essere modificate da finriskalert.it in qualsiasi momento e senza preavviso. Finriskalert.it non può fornire alcuna garanzia in merito all’affidabilità, completezza, esattezza ed attualità dei dati riportati e, pertanto, non assume alcuna responsabilità per qualsiasi danno legato all’uso, proprio o improprio delle informazioni contenute in questa pagina. I contenuti presenti in questa pagina non devono in alcun modo essere intesi come consigli finanziari, economici, giuridici, fiscali o di altra natura e nessuna decisione d’investimento o qualsiasi altra decisione deve essere presa unicamente sulla base di questi dati.
Last July EIOPA submitted its response to the consultation the European Commission (EC) had launched regarding the sustainable finance, whose aim is promoting a sustainable financial environment by increasing private investment in sustainable projects. Here are the main outcomes:
Let us take a step back, to see where all of this began.
Everything started back to September 2015, when the leaders of 193 countries stated a list of 17 sustainable development goals, to be reached by 2030, the so-called “Agenda 2030”. The goals attained a wide range of topics, among which fighting hunger, reducing economic inequalities and promoting sustainable models of production and consumption. The unsustainability of the development model was explicitly recognized for the first time.
Three months later, on December 2015, 195 countries signed the Paris agreement, committing to determine, plan, and report on their contribution to mitigate global warming. The increase in temperature should stay well below 2°C, where 0°C is pre-industrial level.
To help to make this happen, in March 2018, the EC published its Action Plan on sustainable finance, aiming at reorienting the capital flows of the private sector towards sustainable investments. Other targets of the Action Plan were to take into proper consideration the risks stemming from climate change and to promote transparency and long-termism in the financial and economic activities of the private sector.
Later or, in August 2018, the EC asked EIOPA to which extent sustainability was considered within the SII framework. EIOPA pointed out that medium to long term impacts of climate change were not fully captured in the SII capital requirements of Pillar I, being those designed to reflect the risk over just a 1 year time horizon. Another point EIOPA made was the need of a commonly agreed “taxonomy” regarding what is sustainable and what is not (https://www.finriskalert.it/climate-change-and-sii-a-cura-di-di-silvia-dellacqua).
In June 2019, the EBA (European Banking Authority) launched a consultation among the financial institutions, which resulted in the “Guidelines on loan origination and monitoring”, where it is advised to consider ESG factors in the internal policies used to grant loans and in the credit risk management practices.
Afterwards, in December 2019, Ursula von der Leyen, president of the EC, presented the “European Green Deal”: a roadmap to make all member states carbon neutral by 2050, while reducing pollution and creating job opportunities by the development of a new economy.
Later on, in March 2020, the EC published the “EU taxonomy for sustainable activities”: a technical report to help investors assessing whether or not investments meet robust environmental standards and are compliant to the Paris agreement.
This brings us to the current situation: last April 2020 the three European supervisory authorities published a joint Consultation Paper on ESG Disclosures containing proposals of common reporting standards on the sustainability of investment products, which would allow financial consultants to take an informed choice on the main positive or adverse impacts their investments can have. EIOPA submitted its response last July 2020.
Mitsubishi UFJ Financial Group (MUFG), one of the largest banking institutions in Japan, is set to launch its high-speed blockchain payment network with the U.S.-based tech firm Akamai in 2021…
While cross-border banking sector capital flows receded significantly in the aftermath of the global financial crisis…
https://www.ecb.europa.eu//pub/pdf/scpwps/ecb.wp2489~26b7eca600.en.pdf
The European Securities and Markets Authority, the EU’s securities markets regulator, today launches a public consultation…
When corporations have too much debt and need to restructure it, creditors often end up exchanging bonds or loans for stocks…
L’iniziativa di Finriskalert.it “Il termometro dei mercati finanziari” vuole presentare un indicatore settimanale sul grado di turbolenza/tensione dei mercati finanziari, con particolare attenzione all’Italia.
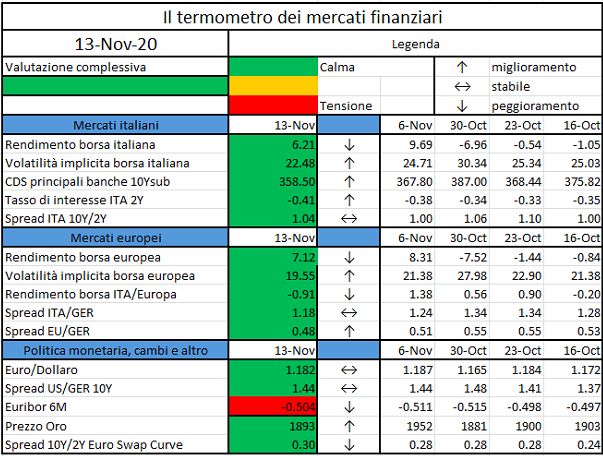
Significato degli indicatori
I colori sono assegnati in un’ottica VaR: se il valore riportato è superiore (inferiore) al quantile al 15%, il colore utilizzato è l’arancione. Se il valore riportato è superiore (inferiore) al quantile al 5% il colore utilizzato è il rosso. La banda (verso l’alto o verso il basso) viene selezionata, a seconda dell’indicatore, nella direzione dell’instabilità del mercato. I quantili vengono ricostruiti prendendo la serie storica di un anno di osservazioni: ad esempio, un valore in una casella rossa significa che appartiene al 5% dei valori meno positivi riscontrati nell’ultimo anno. Per le prime tre voci della sezione “Politica Monetaria”, le bande per definire il colore sono simmetriche (valori in positivo e in negativo). I dati riportati provengono dal database Thomson Reuters. Infine, la tendenza mostra la dinamica in atto e viene rappresentata dalle frecce: ↑,↓, ↔ indicano rispettivamente miglioramento, peggioramento, stabilità rispetto alla rilevazione precedente.
Disclaimer: Le informazioni contenute in questa pagina sono esclusivamente a scopo informativo e per uso personale. Le informazioni possono essere modificate da finriskalert.it in qualsiasi momento e senza preavviso. Finriskalert.it non può fornire alcuna garanzia in merito all’affidabilità, completezza, esattezza ed attualità dei dati riportati e, pertanto, non assume alcuna responsabilità per qualsiasi danno legato all’uso, proprio o improprio delle informazioni contenute in questa pagina. I contenuti presenti in questa pagina non devono in alcun modo essere intesi come consigli finanziari, economici, giuridici, fiscali o di altra natura e nessuna decisione d’investimento o qualsiasi altra decisione deve essere presa unicamente sulla base di questi dati.
