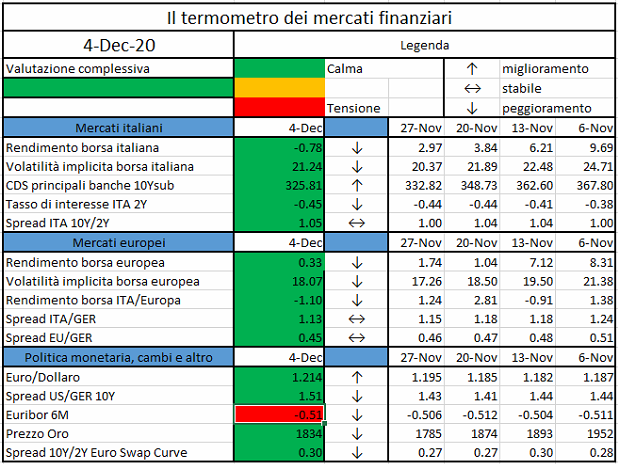
L’iniziativa di Finriskalert.it “Il termometro dei mercati finanziari” vuole presentare un indicatore settimanale sul grado di turbolenza/tensione dei mercati finanziari, con particolare attenzione all’Italia.
Significato degli indicatori
Rendimento borsa italiana: rendimento settimanale dell’indice della borsa italiana FTSEMIB;
Volatilità implicita borsa italiana: volatilità implicita calcolata considerando le opzioni at-the-money sul FTSEMIB a 3 mesi;
Future borsa italiana: valore del future sul FTSEMIB;
CDS principali banche 10Ysub: CDS medio delle obbligazioni subordinate a 10 anni delle principali banche italiane (Unicredit, Intesa San Paolo, MPS, Banco BPM);
Tasso di interesse ITA 2Y: tasso di interesse costruito sulla curva dei BTP con scadenza a due anni;
Spread ITA 10Y/2Y : differenza del tasso di interesse dei BTP a 10 anni e a 2 anni;
Rendimento borsa europea: rendimento settimanale dell’indice delle borse europee Eurostoxx;
Volatilità implicita borsa europea: volatilità implicita calcolata sulle opzioni at-the-money sull’indice Eurostoxx a scadenza 3 mesi;
Rendimento borsa ITA/Europa: differenza tra il rendimento settimanale della borsa italiana e quello delle borse europee, calcolato sugli indici FTSEMIB e Eurostoxx;
Spread ITA/GER: differenza tra i tassi di interesse italiani e tedeschi a 10 anni;
Spread EU/GER: differenza media tra i tassi di interesse dei principali paesi europei (Francia, Belgio, Spagna, Italia, Olanda) e quelli tedeschi a 10 anni;
Euro/dollaro: tasso di cambio euro/dollaro;
Spread US/GER 10Y: spread tra i tassi di interesse degli Stati Uniti e quelli tedeschi con scadenza 10 anni;
Prezzo Oro: quotazione dell’oro (in USD)
Spread 10Y/2Y Euro Swap Curve: differenza del tasso della curva EURO ZONE IRS 3M a 10Y e 2Y;
Euribor 6M: tasso euribor a 6 mesi.
I colori sono assegnati in un’ottica VaR: se il valore riportato è superiore (inferiore) al quantile al 15%, il colore utilizzato è l’arancione. Se il valore riportato è superiore (inferiore) al quantile al 5% il colore utilizzato è il rosso. La banda (verso l’alto o verso il basso) viene selezionata, a seconda dell’indicatore, nella direzione dell’instabilità del mercato. I quantili vengono ricostruiti prendendo la serie storica di un anno di osservazioni: ad esempio, un valore in una casella rossa significa che appartiene al 5% dei valori meno positivi riscontrati nell’ultimo anno. Per le prime tre voci della sezione “Politica Monetaria”, le bande per definire il colore sono simmetriche (valori in positivo e in negativo). I dati riportati provengono dal database Thomson Reuters. Infine, la tendenza mostra la dinamica in atto e viene rappresentata dalle frecce: ↑,↓, ↔ indicano rispettivamente miglioramento, peggioramento, stabilità rispetto alla rilevazione precedente.
Disclaimer: Le informazioni contenute in questa pagina sono esclusivamente a scopo informativo e per uso personale. Le informazioni possono essere modificate da finriskalert.it in qualsiasi momento e senza preavviso. Finriskalert.it non può fornire alcuna garanzia in merito all’affidabilità, completezza, esattezza ed attualità dei dati riportati e, pertanto, non assume alcuna responsabilità per qualsiasi danno legato all’uso, proprio o improprio delle informazioni contenute in questa pagina. I contenuti presenti in questa pagina non devono in alcun modo essere intesi come consigli finanziari, economici, giuridici, fiscali o di altra natura e nessuna decisione d’investimento o qualsiasi altra decisione deve essere presa unicamente sulla base di questi dati.
Sono ormai passati più di dieci anni da quando il protocollo Bitcoin è stato rilasciato, ponendo le basi per quella che sarebbe diventata l’attuale tecnologia blockchain. Il principio alla base – digitalizzazione dei dati organizzati in una struttura immutabile – si è rivelato applicabile ad innumerevoli progetti IT innovativi, come gli smart contracts o i ledger “databases”, tanto da creare, nel corso dell’ultima decade, un hype tecnologico senza precedenti. In base al Gartner 2019 Hype Cycle for Blockchain Technologies[1], la tecnologia è prossima alla cosiddetta slope of enlightment, ovvero alla fase in cui la tecnologia, a seguito delle innumerevoli sperimentazioni ed annessi ineluttabili fallimenti, comincia a consolidarsi e a trovare reale applicazione pratica.
Negli ultimi anni Deloitte si è dimostrata molto sensibile al tema, creando un network globale di laboratori di ricerca con l’obiettivo di analizzare il fenomeno. È in questo contesto che nel 2018 nasce la Global Blockchain Survey di Deloitte, attraverso cui vengono studiati i principali trend di investimento e sondate le percezioni del management aziendale nei confronti della tecnologia blockchain e dei digital assets in generale.
La ricerca condotta quest’anno ha confermato il trend positivo in relazione agli investimenti in tecnologia blockchain registrati a livello globale, in continuità rispetto ai risultati ottenuti nel 2019.[2]
Dalla survey, così come da vari studi in materia, è emerso inoltre che uno dei campi di applicazione della tecnologia blockchain che sta prendendo sempre più piede è quello delle digital currencies.[3] Tale tema si declina anche in relazione alle Central Bank Digital Currencies (CBDC), uno dei casi di sviluppo legati al mondo crypto che può rappresentare un breaktrough nel panorama FSI mondiale.
Nella prima parte del nostro articolo presenteremo alcuni risultati derivanti dalla Global Blockchain Survey 2020, mentre in seguito approfondiremo il tema delle CBDCs.
Global Blockchain Survey 2020
Dal 2018, il gruppo di lavoro Deloitte Blockchain and Digital Asset e il Deloitte Center for Integrated Research collaborano annualmente per la produzione della Global Blockchain Survey, che ha l’obiettivo di analizzare la percezione della tecnologia da parte dei vertici delle aziende e il risultante trend di investimenti. In particolare, il fine ultimo è quello di stimare in che misura le strategie di management siano influenzate dalle decisioni in relazione alla blockchain e ai digital assets[4], e quali applicazioni la tecnologia stia sperimentando.
La survey di quest’anno è stata somministrata ad un campione di 1.488 vertici aziendali, con ruoli che spaziano dai senior executives ai membri del consiglio, provenienti da società registranti guadagni annuali superiori ai 500 milioni di dollari e con sede in 14 paesi diversi. Al fine di garantire dei dati consistenti e affidabili, la selezione degli intervistati è stata ristretta al personale aziendale che possedesse un’ampia conoscenza della tecnologia blockchain, dei digital assets e della Distributed Ledger Technology (DLT), e che avesse familiarità con i piani di investimento e con la percezione nei confronti delle sopracitate tecnologie delle organizzazioni presso cui lavorano.[5]
Una prospettiva sul mercato
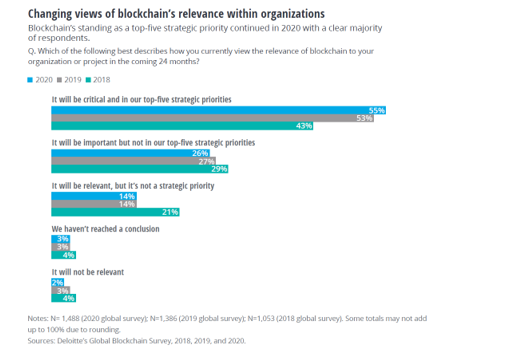
Già a partire dal 2019[6], i dati suggerivano come il mercato stesse uscendo dalla logica di mera sperimentazione per avviarsi verso una fase di applicazione concreta della tecnologia. Come illustrato in Figura 1, un numero crescente di leader ha infatti confermato la volontà di investire in blockchain come una tra le prime cinque priorità strategiche delle organizzazioni per cui lavorano.
Figura 1 – Evoluzione della rilevanza della tecnologia blockchain all’interno delle aziende
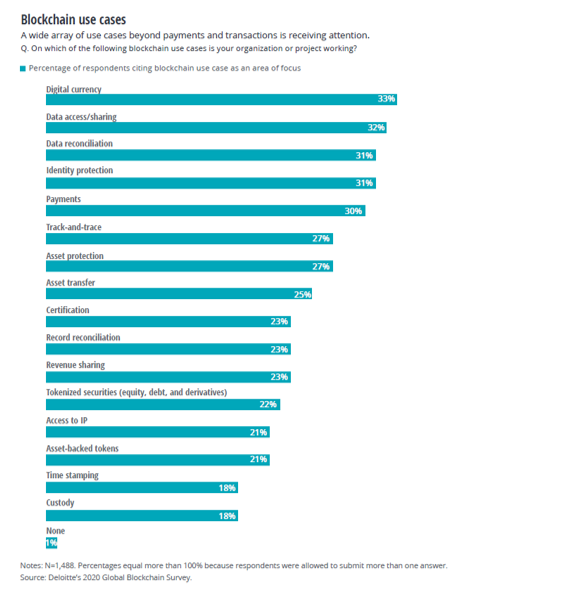
Questo sempre maggior interesse verso la blockchain ha spostato anche l’attenzione dal primigenio campo di applicazione (i.e. transazioni e pagamenti) verso nuove opportunità di impiego, prima fra tutte la possibilità di ricorrere alla tecnologia blockchain per la creazione di valute digitali (Figura 2). Circa il 33% del campione intervistato ha infatti dichiarato come le valute digitali siano una delle più interessanti e promettenti aree di utilizzo della blockchain. Sul tema delle valute digitali è in corso un ampio dibattito, poiché le possibilità di impiego, e dunque i potenziali impatti, variano dalla sfera prettamente istituzionale/ bancaria – si parla in questo caso di Wholesale Central Bank Digital Currencies (CBDCs) – a quella privata, dove il singolo cittadino avrebbe la possibilità di dotarsi di una valuta digitale di tipo retail (RetailCBDC). Questo punto verrà approfondito più in dettaglio nella seconda parte del nostro articolo.
Altri settori che stanno riscuotendo un successo pari alle valute digitali riguardano due principali gruppi di applicazione: data management, che si declina nelle più specifiche attività di data access and sharing (32%) e data reconciliation (31%), e asset management, che vanta il maggior numero di applicazioni possibili (track-and-trace e asset protection detengono il primato con il 27% delle preferenze degli intervistati).
Figura 2 – Recenti applicazioni della tecnologia Blockchain
Le sfide del presente
Nonostante la sempre maggiore attenzione verso la tecnologia blockchain, rimangono in piedi ostacoli di diversa natura che separano gli use cases illustrati in Figura 2 dal diventare mainstream adoption. Tali ostacoli influenzano trasversalmente tutti i digital assets, comprese, di conseguenza, anche le valute digitali.
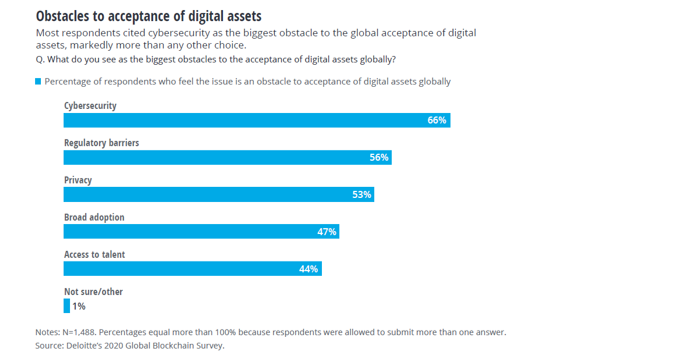
Attualmente le sfide più grandi riguardano in particolare la sicurezza informatica (secondo il 66% degli intervistati) e le barriere normative (56%), come illustrato in Figura 3.
Figura 3 – Gli ostacoli alla diffusione dei digital assets
La cybersecurity è risultata essere al primo posto tra le maggiori preoccupazioni legate al tema digitalizzazione. Come già anticipato, infatti, il 66% dei leader intervistati ha individuato la cybersecurity come elemento che può rallentare l’adozione e la diffusione dei digital assets e circa il 60% ha confermato la cybersecurity come uno degli elementi critici delle soluzioni che le varie aziende stanno al momento studiando o implementando. La tematica è principalmente legata a soluzioni private o all’integrazione di soluzioni pubbliche all’interno di architetture private.[7] Tali soluzioni risultano decisive in un’epoca in cui a livello globale viene registrato un sempre più elevato numero di tentativi di attacchi informatici o data breaches che impattano dati di valore, finanziari o altre tipologie di dati privati e informazioni personali. È in questa falla che la tecnologia blockchain si pone, soprattutto nel breve periodo, come soluzione efficace per prevenire questa tipologia di attacchi e di rischi per la sicurezza dei dati, in particolar modo nelle soluzioni legate a criptovalute pubbliche come i Bitcoin.
Non tratteremo in questa sede il tema della regolamentazione, essendo un argomento notevolmente ampio, ma è utile dire che esistono numerose dissertazioni che prendono in considerazione le possibili evoluzioni dei digital assets nel panorama italiano, europeo e globale.[8] La speranza è quella dell’uniformazione delle linee guida almeno a livello europeo. Già con la V direttiva e la regolamentazione sui cambiavalute virtuali è stato fatto un passo avanti in tal senso[9], tuttavia, si auspica un ulteriore sforzo a livello europeo per chiarire da un lato la tipologia di digital assets permessi, dall’altro il framework di riferimento per l’autorizzazione alla creazione e negoziazione delle diverse tipologie di asset (e.g. criteri di approvazione all’utilizzo da parte delle autorità sovranazionali e nazionali).
Central Bank Digital Currencies
Come già anticipato nella sezione precedente, uno tra i temi più rilevanti emersi dallo studio Deloitte è relativo alle valute digitali come principale campo di applicazione della tecnologia blockchain. Attualmente il dibattito, avviatosi ormai nel lontano 2015, si sta sviluppando intorno alle cosiddette Central Bank Digital Currencies (CBDCs).
La CBDC, almeno nella sua forma più semplice, è già oggi una realtà, poiché ogni transazione tra banche commerciali che avvenga sui depositi detenuti dalle stesse presso la Banca Centrale della propria area monetaria è interamente basata su mezzi digitali. Conseguentemente, il dibattito non è incentrato tanto sulla creazione di un CBDC, quanto più sul perseguire una necessaria evoluzione della stessa verso uno strumento più versatile, ricorrendo appunto ai risultati raggiunti nell’ambito delle analisi e delle ricerche in ambito blockchain.
Da dove deriva questa esigenza? Le criptovalute avevano già provato di essere efficaci nel ridurre i rischi di controparte legati al regolamento delle transazioni, specialmente in caso di contratti su prodotti derivati compensati e non presso le Casse di Compensazione Centrali (Central Counterparties Clearing Houses o CCPs). Già nel 2016 le pagine di FinRisk Alert avevano ospitato un estratto della risposta di Ametrano, Barucci, Marazzina e Zanero ad una consultazione dell’ESMA[10], in cui veniva segnalato che ‘for instant clearing and settlement of spot transactions it would be crucial the existence of cash on the ledger to implement effective “Delivery versus Payment”’. Se da una parte, però, le criptovalute riducono i rischi di controparte, dall’altra potrebbero dare origini ad ulteriori rischi di diversa natura, ad esempio legati alla necessità di convertire una criptovaluta di regolamento in una fiat currency, ovvero una valuta non agganciata al valore di nessuna commodity fisica[11] (quali sono, appunto, l’euro o il dollaro statunitense).
Conseguentemente, le criptovalute si mostrano come una soluzione poco efficace per fungere da cash on the ledger. È qui che entrano in gioco le CBDCs, essendo queste valute già direttamente “spendibili” verso ogni controparte di mercato senza la necessità di essere convertite.
L’idea di utilizzare una versione crypto di una CBDC destinata ai soli operatori finanziari (Wholesale CBDC)[12] è stata coltivata in questi anni, senza però adozioni di nota da nessuna delle maggiori Banche Centrali (i.e. Fed, ECB, BoE, BoJ, SNB). La ragione principale si potrebbe identificare nella mancanza di un vero vantaggio, tenuto conto dei costi realizzativi, nel creare una moneta destinata a degli operatori finanziari che già oggi regolano tra loro utilizzando denaro digitale, anche per mezzo dei depositi detenuti presso le Banche Centrali. Si pensi ad esempio al sistema di pagamento TARGET2, che consente di effettuare il regolamento dei pagamenti sui conti aperti dalle banche partecipanti presso le rispettive Banche Centrali Nazionali quasi in tempo reale.
Le recenti dichiarazioni di Yves Mersch (membro dell’executive board della BCE) supportano questa ipotesi e indicano il passaggio successivo per il vero utilizzo della CBDC: l’adozione da parte del singolo cittadino. Mersch ha infatti dichiarato che ‘a wholesale CBDC, restricted to a limited group of financial counterparties, would be largely business as usual. […] However, a retail CBDC, accessible to all, would be a game changer, so a retail CBDC is now our main focus.’[13]
Perché “a game changer”? I vantaggi dell’adozione di una soluzione basata su CBDC disponibile anche per il cittadino sono molteplici, tra i più interessanti si possono citare:
Efficienza del sistema dei pagamenti e denaro programmabile:un’unica piattaforma potrebbe sostituire sia i circuiti di pagamento Wholesale per il real-time gross settlement come TARGET2 che i circuiti retail quali carte e bancomat o servizi offerti da Fintech, riducendo costi di transazione e dell’utilizzo di intermediari. A questo vantaggio si assocerebbe la possibilità di creare denaro programmabile (ad esempio sotto forma di smart contract con cash on the ledger), che permetterebbe di estendere l’efficienza del nuovo sistema anche a diverse attività di operazioni pre- e post-regolamento, riducendo i costi legati alle attività di gestione per molte iniziative economiche che comportano un pagamento. In sintesi, una valuta digitale della Banca Centrale consentirebbe di effettuare pagamenti in tempo reale e a costi molto bassi. Le transazioni verrebbero direttamente approvate dalle controparti di una rete basata su distributed ledger technology (DLT), senza l’intermediazione delle banche.
Protezione del consumatore e riduzione liquidità bloccata presso i Sistemi di Garanzia dei Depositi (SGD):la disponibilità di denaro di Banca Centrale, essendo questa un soggetto sempre in grado di restituire quanto depositato nella valuta che essa emette – anche se resta il rischio che quanto restituito abbia solo una frazione del potere di acquisto originario in caso di shock di mercato ed effetti di iper-inflazione – renderebbe non necessario, ad esempio, creare sistemi di garanzia dei depositi obbligatori. Questi sistemi di garanzia vengono finanziati dal sistema bancario, con un totale di liquidità che entro il 2025 EBA indica pari allo 0,8% di tutti i depositi per un totale di circa 80 miliardi di euro, di cui circa 12 miliardi di euro per il solo sistema bancario italiano.[14]
Rapida trasmissione delle politiche monetarie: da alcuni anni si discute dell’opportunità di utilizzare il cosiddetto helicopter money come politica espansiva alternativa ai diversi programmi di quantitative easing per stimolare l’economia e la ripartenza dei prezzi in linea con il livello-obiettivo di inflazione della BCE e il dibattito è tornato in auge soprattutto durante la pandemia da COVID-19. Tralasciando l’opportunità o meno di applicare tali politiche, una CBDC rappresenterebbe una soluzione tecnica per i problemi di attuazione delle stesse: la Banca Centrale infatti potrebbe direttamente incrementare i saldi dei depositi denominati in CBDC dei cittadini presso la banca centrale.
Sicurezza e potenziamento dei sistemi anti-frode: una CBDC viene ritenuta utile dalle Banche Centrali anche per risolvere il problema della contraffazione di monete e banconote. L’impiego di valute digitali sfrutterebbe la crittografia applicata alla blockchain per impedire il fenomeno del double spending, ovvero l’equivalente digitale della creazione di una banconota falsa.
Per le banche centrali questi vantaggi si assocerebbero alla possibilità di conservare le rendite derivanti dall’emissione di moneta, estendendola anzi alla moneta digitale.
Negli ultimi due anni, uno stimolo importante alla creazione di una Retail CBDC è stato dato dai primi esperimenti e consorzi privati destinati alla creazione di una moneta digitale privata e largamente accettata, tra i quali il più noto al grande pubblico è Libra. In risposta alla possibilità che vedano la luce una serie di valute digitali gestite esclusivamente da organizzazioni private, dal 2017 abbiamo assistito al lancio di numerosi progetti di ricerca e sperimentazione da parte delle Banche Centrali, che ad oggi si mantengono comunque ancora caute nell’adozione di una Retail CBDC.
L’adozione da parte delle Banche Centrali di una moneta retail disponibile per il cittadino presenta infatti numerose sfide da affrontare. Attualmente il dibattito si concentra intorno a quattro principali argomenti:
Sfida tecnologica: la prima grande sfida riguarda la declinazione operativa e tecnologia di una così grande innovazione. Si pensi all’infrastruttura IT di cui una Banca Centrale – o un consorzio pubblico-privato regolamentato – dovrebbe dotarsi per sostenere anche solo parte dei volumi di transazioni cashless ad oggi effettuate sul mercato, che nel 2018 per l’EU ammontava a circa 300 milioni di transazioni al giorno.[15] Tale sistema dovrebbe inoltre gestire i conti di centinaia di milioni di cittadini e imprese, essere disponibile costantemente ad ogni ora, ogni giorno dell’anno, in modo analogo ai pagamenti basati su carte e bancomat. Tale scenario operativo è molto diverso rispetto agli attuali sistemi di gross settlement come TARGET2, che prevedono orari di apertura e sono chiusi i weekend e durante le principali festività.[16] Questa sfida tecnica è certamente superabile, ma a condizione di elevati investimenti nell’infrastruttura tecnologica. Riteniamo tuttavia che i player di mercato che hanno già iniziato questi investimenti a vantaggio di tutto il sistema bancario siano pronti ad investire ancora per contribuire alla creazione di un sistema scalabile unico.
Impatto sugli istituti bancari e sul sistema finanziario:nonostante le opportunità legate alla possibilità di dotare il cittadino di una CBDC, non possono essere trascurati i rischi di disruption del sistema bancario attuale. Ad oggi, infatti, i cittadini hanno limitato accesso alla moneta di Banca Centrale, unicamente sotto forma di monete e banconote, che comporta limiti di tesaurizzazione legati ad esempio ai volumi, al potenziale decadimento del supporto fisico e sempre di più ai limiti di impiego (e.g. riduzione dei limiti massimi di utilizzo del contante come mezzo di pagamento). Questo ha portato, de facto, i cittadini a concentrare la tesaurizzazione della propria liquidità in denaro di banca commerciale. Dobbiamo quindi chiederci se in uno scenario in cui i cittadini possano detenere un conto presso la Banca Centrale, un euro CBDC sarebbe ancora sostanzialmente fungibile rispetto ad un euro di banca commerciale. Se così non fosse, è ipotizzabile uno scenario in cui i cittadini preferiscano detenere più CBDC, causando una fuga dai conti correnti bancari? E con quali impatti sul sistema bancario? Un primo studio della Bank of England (BoE) ha evidenziato che, se l’introduzione di una CBDC segue una serie di principi fondamentali, ovvero – citiamo letteralmente –
‘[…](i) CBDC pays an adjustable interest rate; (ii) CBDC and reserves are distinct, and not convertible into each other; (iii) No guaranteed, on-demand convertibility of bank deposits into CBDC at commercial banks (and therefore by implication at the central bank); (iv) The central bank issues CBDC only against eligible securities (principally government securities). The final two principles imply that households and firms can freely trade bank deposits against CBDC in a private market, and that the private market can freely obtain additional CBDC from the central bank, at the posted CBDC interest rate and against eligible securities.’
il rischio di una fuga a livello di sistema dai depositi bancari può essere evitato.[17] Identificare gli effetti di breve e lungo termine sul settore bancario e correggere eventuali distorsioni è forse la principale sfida nel breve termine all’adozione della CBDC.
Cash Digitization o E-money? Uno dei punti da affrontare prima dell’adozione di una CBDC è sicuramente il tipo di moneta che essa dovrà rappresentare da un punto di vista funzionale. La CBDC potrebbe infatti essere declinata, alternativamente o almeno parallelamente, come moneta elettronica o contante digitale. Se l’obiettivo è la sostituzione del contante (l’unica moneta di Banca Centrale a cui il cittadino ad oggi accede direttamente), la CBDC dovrebbe conservare tutte le sue caratteristiche, tra cui, ad esempio, l’anonimato nelle transazioni. L’anonimato, per essere comparabile a quello del contante, dovrebbe essere garantito a livello di protocollo informatico, e non a livello di diritti di visibilità sulle transazioni. Tale modalità realizzativa porta con sé ulteriori sfide anche di tipo tecnologico. Si pensi ad esempio ad un’altra caratteristica intrinseca del contante, ovvero la prossimità fisica necessaria per effettuare una transazione: il regolatore potrebbe considerare questa caratteristica come necessaria al fine di evitare che la CBDC diventi una moneta digitale anonima per transazioni a distanza. Questo requisito porterebbe ad una non semplice identificazione di una modalità tecnologica non eludibile per garantire la prossimità nello scambio. Dall’altro lato, la scelta di creare una CBDC che non preservi la privacy del cittadino renderebbe di fatto la soluzione una moneta elettronica, mettendo, come già discusso, la Banca Centrale in competizione con banche e fintech invece che con l’utilizzo del contante, le cui caratteristiche conserverebbero una propria unicità.
Inclusione finanziaria: quello degli “unbanked” è un tema sempre più dibattuto negli ultimi anni. Con questo termine ci si riferisce a coloro che sono totalmente o prevalentemente esclusi dai servizi finanziari di base. La progressiva sostituzione del denaro contante a favore della moneta virtuale corrente (e.g. carte di credito e bancomat) aggraverebbe lo stato in cui versano gli unbanked, poiché l’accesso alla moneta sarebbe necessariamente condizionato al possesso di un conto corrente presso una banca commerciale. La creazione di una Retail CBDC, al contrario, garantirebbe a tali soggetti, in quanto cittadini e/o residenti all’interno di una specifica area monetaria, la possibilità di avere un conto direttamente presso le Banche Centrali, gratuitamente o a basso costo. In tal senso, la Retail CBDC si porrebbe come forte strumento di inclusione finanziaria.[18]
In conclusione, la tecnologia blockchain, in particolare per i casi d’uso legati alle valute sembra mostrare benefici interessanti sia per gli utenti finali che per il sistema Bancario. Questi benefici potranno essere raggiunti continuando il percorso già avviato da alcuni player di mercato per quanto riguarda la ricerca e l’investimento nello sviluppo di soluzioni concrete come quello di una Retail CBDC. Auspichiamo che i governi e le istituzioni continuino a promuovere un’architettura legislativa favorevole a supportare esperimenti in questa direzione.
[4]‘We define a digital asset as “something represented in a digital form that has intrinsic or acquired value.” In recent years, the term has come to include those assets that are represented, held, and transacted on a blockchain or blockchain-like network’. Deloitte’s Global Blockchain Survey 2020, p.9
La Banca d’Italia ha identificato per il 2021 i gruppi bancari UniCredit, Intesa Sanpaolo, Banco BPM e Monte dei Paschi di Siena come istituzioni a rilevanza sistemica nazionale…
The effects of the Covid crisis have been felt unevenly across sectors, and the output of customer service industries could remain well below its pre-Covid trend for some time…
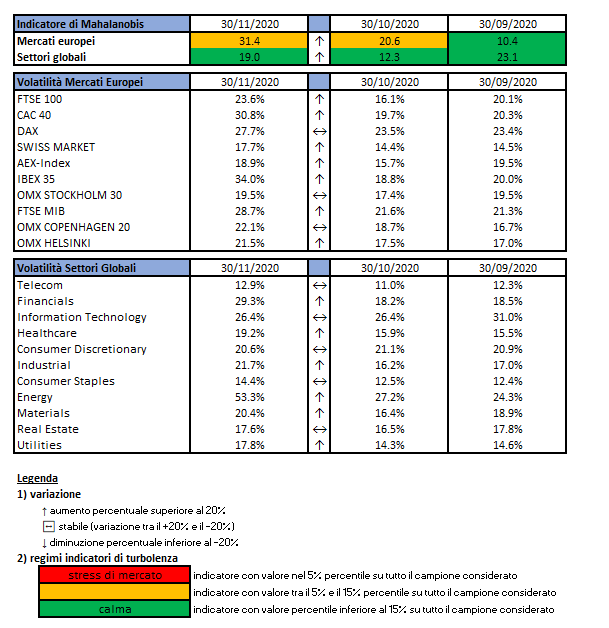
L’indicatore di Mahalanobis permette di evidenziare periodi di stress nei mercati finanziari. Si tratta di un indicatore che dipende dalle volatilità e dalle correlazioni di un particolare universo investimenti preso ad esame. Nello specifico ci siamo occupati dei mercati azionari europei e dei settori azionari globali.
Gli indici utilizzati sono:
Le volatilità riportate sono storiche e calcolate sugli ultimi 30 trading days disponibili. Per ogni asset-class dunque sono prima calcolati i rendimenti logaritmici dei prezzi degli indici di riferimento, successivamente si procede col calcolo della deviazione standard dei rendimenti, ed infine si procede a moltiplicare la deviazione standard per il fattore di annualizzazione.
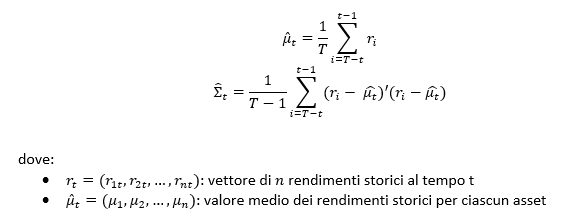
Per il calcolo della distanza di Mahalnobis si procede dapprima con la stima della matrice di covarianza tra le asset-class. Si considera l’approccio delle finestre mobili. Come con la volatilità, si procede prima con il calcolo dei rendimenti logaritmici e poi con la stima storica della matrice di covarianza, come riportato di seguito.
Supponendo una finestra mobile di T periodi, viene calcolato il valore medio e la matrice varianza covarianza al tempo t come segue:
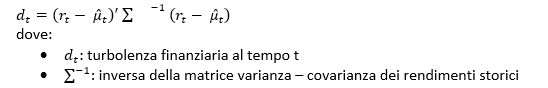
La distanza di Mahalanobis è definita formalmente come:
Le parametrizzazioni che sono state scelte sono:
Rilevazioni mensili
Tempo T della finestra mobile pari a 5 anni (60 osservazioni mensili)
Le statistiche percentili sono state calcolate a partire dalla distribuzione dell’indicatore di Mahalanobis dal Dicembre 1997 al Dicembre 2019 su rilevazioni mensili.
Disclaimer: Le informazioni contenute in questa pagina sono esclusivamente a scopo informativo e per uso personale. Le informazioni possono essere modificate da finriskalert.it in qualsiasi momento e senza preavviso. Finriskalert.it non può fornire alcuna garanzia in merito all’affidabilità, completezza, esattezza ed attualità dei dati riportati e, pertanto, non assume alcuna responsabilità per qualsiasi danno legato all’uso, proprio o improprio delle informazioni contenute in questa pagina. I contenuti presenti in questa pagina non devono in alcun modo essere intesi come consigli finanziari, economici, giuridici, fiscali o di altra natura e nessuna decisione d’investimento o qualsiasi altra decisione deve essere presa unicamente sulla base di questi dati.
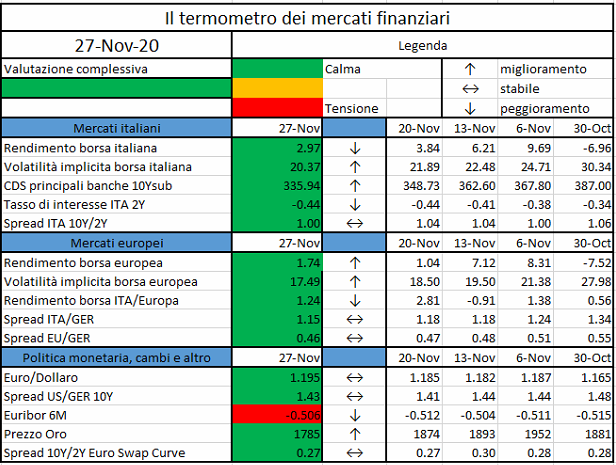
L’iniziativa di Finriskalert.it “Il termometro dei mercati finanziari” vuole presentare un indicatore settimanale sul grado di turbolenza/tensione dei mercati finanziari, con particolare attenzione all’Italia.
Significato degli indicatori
Rendimento borsa italiana: rendimento settimanale dell’indice della borsa italiana FTSEMIB;
Volatilità implicita borsa italiana: volatilità implicita calcolata considerando le opzioni at-the-money sul FTSEMIB a 3 mesi;
Future borsa italiana: valore del future sul FTSEMIB;
CDS principali banche 10Ysub: CDS medio delle obbligazioni subordinate a 10 anni delle principali banche italiane (Unicredit, Intesa San Paolo, MPS, Banco BPM);
Tasso di interesse ITA 2Y: tasso di interesse costruito sulla curva dei BTP con scadenza a due anni;
Spread ITA 10Y/2Y : differenza del tasso di interesse dei BTP a 10 anni e a 2 anni;
Rendimento borsa europea: rendimento settimanale dell’indice delle borse europee Eurostoxx;
Volatilità implicita borsa europea: volatilità implicita calcolata sulle opzioni at-the-money sull’indice Eurostoxx a scadenza 3 mesi;
Rendimento borsa ITA/Europa: differenza tra il rendimento settimanale della borsa italiana e quello delle borse europee, calcolato sugli indici FTSEMIB e Eurostoxx;
Spread ITA/GER: differenza tra i tassi di interesse italiani e tedeschi a 10 anni;
Spread EU/GER: differenza media tra i tassi di interesse dei principali paesi europei (Francia, Belgio, Spagna, Italia, Olanda) e quelli tedeschi a 10 anni;
Euro/dollaro: tasso di cambio euro/dollaro;
Spread US/GER 10Y: spread tra i tassi di interesse degli Stati Uniti e quelli tedeschi con scadenza 10 anni;
Prezzo Oro: quotazione dell’oro (in USD)
Spread 10Y/2Y Euro Swap Curve: differenza del tasso della curva EURO ZONE IRS 3M a 10Y e 2Y;
Euribor 6M: tasso euribor a 6 mesi.
I colori sono assegnati in un’ottica VaR: se il valore riportato è superiore (inferiore) al quantile al 15%, il colore utilizzato è l’arancione. Se il valore riportato è superiore (inferiore) al quantile al 5% il colore utilizzato è il rosso. La banda (verso l’alto o verso il basso) viene selezionata, a seconda dell’indicatore, nella direzione dell’instabilità del mercato. I quantili vengono ricostruiti prendendo la serie storica di un anno di osservazioni: ad esempio, un valore in una casella rossa significa che appartiene al 5% dei valori meno positivi riscontrati nell’ultimo anno. Per le prime tre voci della sezione “Politica Monetaria”, le bande per definire il colore sono simmetriche (valori in positivo e in negativo). I dati riportati provengono dal database Thomson Reuters. Infine, la tendenza mostra la dinamica in atto e viene rappresentata dalle frecce: ↑,↓, ↔ indicano rispettivamente miglioramento, peggioramento, stabilità rispetto alla rilevazione precedente.
Disclaimer: Le informazioni contenute in questa pagina sono esclusivamente a scopo informativo e per uso personale. Le informazioni possono essere modificate da finriskalert.it in qualsiasi momento e senza preavviso. Finriskalert.it non può fornire alcuna garanzia in merito all’affidabilità, completezza, esattezza ed attualità dei dati riportati e, pertanto, non assume alcuna responsabilità per qualsiasi danno legato all’uso, proprio o improprio delle informazioni contenute in questa pagina. I contenuti presenti in questa pagina non devono in alcun modo essere intesi come consigli finanziari, economici, giuridici, fiscali o di altra natura e nessuna decisione d’investimento o qualsiasi altra decisione deve essere presa unicamente sulla base di questi dati.
Earlier this month, reacting to a decision by India’s highest court, prominent comedian Kunal Kamra tweeted that India’s Supreme Court is the “most Supreme joke of this country.”…
Questo sito utilizza cookie tecnici e di profilazione, propri e di terze parti, per garantire la corretta navigazione, analizzare il traffico e misurare l'efficacia delle attività di comunicazione.
Questo sito Web utilizza i cookie per migliorarne l'esperienza di navigazione. I cookie classificati come necessari, sono essenziali alle funzioni di base sito e vengono sempre memorizzati nel tuo browser. I cookie di terze parti, che ci aiutano ad analizzare e capire come utilizzi questo sito, vengono memorizzati nel tuo browser solo con il tuo consenso. Di seguito hai la possibilità di disattivare questi cookie. Tieni in conto che la disattivazione di alcuni di questi cookie potrebbe influire sulla tua esperienza di navigazione.
Necessary cookies are absolutely essential for the website to function properly. These cookies ensure basic functionalities and security features of the website, anonymously.
Cookie
Durata
Descrizione
cookielawinfo-checkbox-analytics
1 year
Cookie tecnico impostato dal plugin GDPR Cookie Consent che viene utilizzato per registrare il consenso dell'utente per i cookie nella categoria "Analitici".
cookielawinfo-checkbox-necessary
1 year
Cookie tecnico impostato dal plugin GDPR Cookie Consent che viene utilizzato per registrare il consenso dell'utente ai cookie.
CookieLawInfoConsent
1 year
Cookie tecnico impostato dal plugin GDPR Cookie Consent per salvare le scelte si/no dell'utente per ciascuna categoria.
viewed_cookie_policy
1 year
Cookie tecnico impostato dal plugin GDPR Cookie Consent che registra lo stato del pulsante predefinito della categoria corrispondente.
Analytical cookies are used to understand how visitors interact with the website. These cookies help provide information on metrics the number of visitors, bounce rate, traffic source, etc.
Cookie
Durata
Descrizione
_pk_id.gV3j99y0AE.0928
1 year 27 days
Cookie analitico impostato da Matomo e utilizzato per memorizzare alcuni dettagli sull'utente come l'ID univoco del visitatore
_pk_ses.gV3j99y0AE.0928
30 minutes
Cookie analitico impostato da Matomo di breve durata e utilizzato per memorizzare temporaneamente i dati della visita