The report Implementation monitoring of PFMI: Level 2 assessment report
for Brazil released today by the Committee on Payments and Market
Infrastructures…
Nov
05
2020
The report Implementation monitoring of PFMI: Level 2 assessment report
for Brazil released today by the Committee on Payments and Market
Infrastructures…
Fintech in Latin America is greeting the dawn. We take stock of how it is transforming financial services in the region. First, we describe the fintech landscape in terms of investment, firms and services provided…
Wasabi Wallet, the privacy-focused bitcoin software wallet, has set a broad timeframe for the release of Wasabi Wallet 2.0…
https://www.coindesk.com/wasabi-wallet-automatic-coinjoins-default-privacy

L’indicatore di Mahalanobis permette di evidenziare periodi di stress nei mercati finanziari. Si tratta di un indicatore che dipende dalle volatilità e dalle correlazioni di un particolare universo investimenti preso ad esame. Nello specifico ci siamo occupati dei mercati azionari europei e dei settori azionari globali.
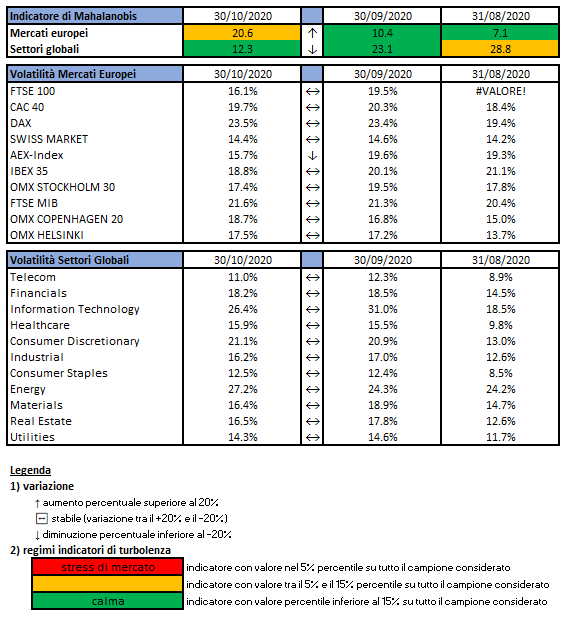
Gli indici utilizzati sono:

Le volatilità riportate sono storiche e calcolate sugli ultimi 30 trading days disponibili. Per ogni asset-class dunque sono prima calcolati i rendimenti logaritmici dei prezzi degli indici di riferimento, successivamente si procede col calcolo della deviazione standard dei rendimenti, ed infine si procede a moltiplicare la deviazione standard per il fattore di annualizzazione.
Per il calcolo della distanza di Mahalnobis si procede dapprima con la stima della matrice di covarianza tra le asset-class. Si considera l’approccio delle finestre mobili. Come con la volatilità, si procede prima con il calcolo dei rendimenti logaritmici e poi con la stima storica della matrice di covarianza, come riportato di seguito.
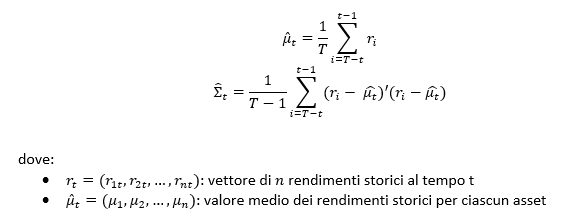
Supponendo una finestra mobile di T periodi, viene calcolato il valore medio e la matrice varianza covarianza al tempo t come segue:
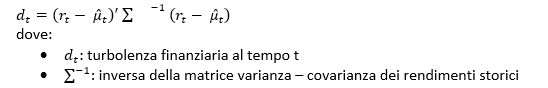
La distanza di Mahalanobis è definita formalmente come:
Le parametrizzazioni che sono state scelte sono:
Le statistiche percentili sono state calcolate a partire dalla distribuzione dell’indicatore di Mahalanobis dal Dicembre 1997 al Dicembre 2019 su rilevazioni mensili.
Ulteriori dettagli sono riportati in questo articolo.
Disclaimer: Le informazioni contenute in questa pagina sono esclusivamente a scopo informativo e per uso personale. Le informazioni possono essere modificate da finriskalert.it in qualsiasi momento e senza preavviso. Finriskalert.it non può fornire alcuna garanzia in merito all’affidabilità, completezza, esattezza ed attualità dei dati riportati e, pertanto, non assume alcuna responsabilità per qualsiasi danno legato all’uso, proprio o improprio delle informazioni contenute in questa pagina. I contenuti presenti in questa pagina non devono in alcun modo essere intesi come consigli finanziari, economici, giuridici, fiscali o di altra natura e nessuna decisione d’investimento o qualsiasi altra decisione deve essere presa unicamente sulla base di questi dati.

L’iniziativa di Finriskalert.it “Il termometro dei mercati finanziari” vuole presentare un indicatore settimanale sul grado di turbolenza/tensione dei mercati finanziari, con particolare attenzione all’Italia.
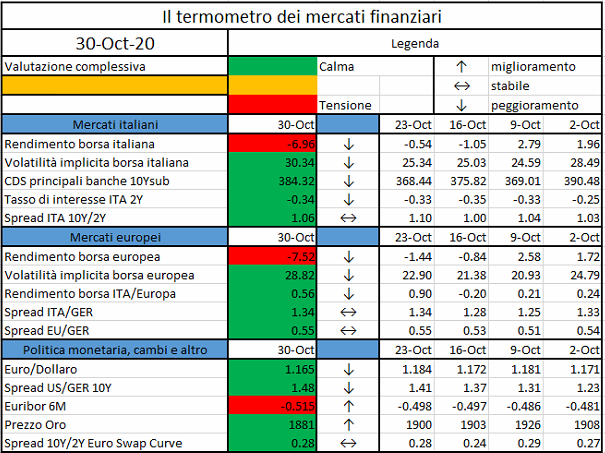
Significato degli indicatori
I colori sono assegnati in un’ottica VaR: se il valore riportato è superiore (inferiore) al quantile al 15%, il colore utilizzato è l’arancione. Se il valore riportato è superiore (inferiore) al quantile al 5% il colore utilizzato è il rosso. La banda (verso l’alto o verso il basso) viene selezionata, a seconda dell’indicatore, nella direzione dell’instabilità del mercato. I quantili vengono ricostruiti prendendo la serie storica di un anno di osservazioni: ad esempio, un valore in una casella rossa significa che appartiene al 5% dei valori meno positivi riscontrati nell’ultimo anno. Per le prime tre voci della sezione “Politica Monetaria”, le bande per definire il colore sono simmetriche (valori in positivo e in negativo). I dati riportati provengono dal database Thomson Reuters. Infine, la tendenza mostra la dinamica in atto e viene rappresentata dalle frecce: ↑,↓, ↔ indicano rispettivamente miglioramento, peggioramento, stabilità rispetto alla rilevazione precedente.
Disclaimer: Le informazioni contenute in questa pagina sono esclusivamente a scopo informativo e per uso personale. Le informazioni possono essere modificate da finriskalert.it in qualsiasi momento e senza preavviso. Finriskalert.it non può fornire alcuna garanzia in merito all’affidabilità, completezza, esattezza ed attualità dei dati riportati e, pertanto, non assume alcuna responsabilità per qualsiasi danno legato all’uso, proprio o improprio delle informazioni contenute in questa pagina. I contenuti presenti in questa pagina non devono in alcun modo essere intesi come consigli finanziari, economici, giuridici, fiscali o di altra natura e nessuna decisione d’investimento o qualsiasi altra decisione deve essere presa unicamente sulla base di questi dati.

Switching-on TVs, radios, websites and reading newspapers worldwide in the last month the first news has been the COVID-19.
According to the World Health Organization the Coronavirus disease (COVID-19 the abbreviation) is an infectious disease caused by a newly discovered coronavirus.
The best way to prevent and slow down transmission is be well informed about the COVID-19 virus, the disease it causes and how it spreads. Protect ourselves and others from infection by washing your hands or using an alcohol based rub frequently and not touching your face…
Prevent and slow down transmission are the key elements to stop the pandemic that in this moment, according to the Center for Systems Science and Engineering (CSSE) at Johns Hopkins University, has more than 5 million of confirmed cases and nearly 400 thousand victims in the world.
Beside the human tragedy the greatest implications of this virus are the financial ones: since Wuhan lockdown (23th of January 2020) the MSCI World Index[1] of global stocks lost more than the 15% while the US Treasury bond yield lost more than 1 point. Financial shortage for all size firms and workers, rather than the uncertainty for the so called Phase 2 (the lockdown end) and the recovery phase are characterizing this period and are in the middle of the economic and political debate with a focus on the central banks strategies and provisions.
In Europe, in particular, there is a huge debate – sometimes fed for political purpose – on the instrument to avoid the economic shortage of the member countries and organize a sort of Marshall Plan to recover from the financial and economic consequences of the pandemic.
One of the instrument that could bring together the different positions is the Repurchase Agreement. The open repo (a repo without a specified end-date) can provide immediately liquidity to the European Countries posting as collateral bonds issued by themselves, leaving the reverse exchange of liquidity vs collateral (the end of the contract) in a second phase that will be agreed in accordance at the evolution of the pandemic situation.
Repo Market is the short term for Repurchase Agreement Market. A borrower of cash sells securities (the collateral) to the lender and agrees to buy them back later at a pre-specified price. Typical borrowers of cash are asset managers, pension funds, banks and insurance companies. Typical lenders of cash are money market funds and corporate treasurers. A repurchase agreement is a form of short-term borrowing for dealers in government securities. In the case of a repo, a dealer sells government securities to investors, usually on an overnight basis, and buys them back the following day at a slightly higher price. That small difference in price is the implicit overnight interest rate. Repos are typically used to raise short-term capital and they are intermediated by large broker-dealers, who are also significant repo users in their own right, to finance market-making inventory, source short-term funding or invest cash.
Repo are generally considered safe investments because the security in question functions as collateral. Classified as an instrument, a repurchase agreement functions in effect as a short-term, collateral-backed, interest-bearing loan. The buyer acts as a short-term lender, while the seller acts as a short-term borrower. The securities being sold are the collateral. Thus the objects of both parties, secured funding and liquidity, are met.
Repo markets key functions:
In order to determine the true costs and benefits of a repurchase agreement, a buyer or seller interested in participating in the transaction must consider three different calculations:
1) Cash paid in the initial security sale
2) Cash to be paid in the repurchase of the security
3) Implied interest rate
The cash paid in the initial security sale and the cash paid in the repurchase will be dependent upon the value and type of security involved in the repo. In the case of a bond, for instance, both of these values will need to take into consideration the clean price and the value of the accrued interest for the bond.
There are three main types of repurchase agreements:
Essential terms to be affirmed in a Repo, are:
Repurchase transactions are quoted in terms of the repo rate, that is, the percentage per annum rate of return on the Purchase Price to be paid by the Buyer to the Seller on the Repurchase Date (or, in the case of some open repos and floating-rate repos, on interim payment dates). The repo rate should be quoted on the basis of the day count and annual basis convention (also called the day count fraction convention) prevailing in the wholesale money market in the currency of the Purchase Price (notably, in the deposit and forward foreign exchange markets). This is almost always the actual day count and 365-day annual basis (A/365F) or the actual day count and 360-day annual basis (A/360). Parties to a repurchase transaction conventionally agree the Purchase Price of fixed-income securities in terms of the dirty or gross price of the collateral (that is, including the accrued interest since the last coupon date). The Purchase Price of a repurchase transaction also incorporates any initial margin or Haircut.
Bond repo markets developed in the G10 countries at different times– in the 1920s in the United States, the 1970s in continental Europe and the 1990s in the United Kingdom.
Monetary authorities used them as a monetary policy tool to increase the depth, liquidity and price efficiency of markets. Data reported by 19 primary dealers (banks and broker-dealers that may trade in US government securities directly with the FED) and around 1,000 bank holding companies suggest that by mid-2008 the gross market capitalization of the US repo market exceeded $10 trillion (including double-counting of repos and reverse repos). The primary dealers are the most active participants, and use repos to finance much of the growth of their balance sheets, creating procyclical leverage and an exposure to refinancing risk (Adrian and Shin (2008)). The top US investment banks funded roughly half of their assets using repo markets, with additional exposure due to off-balance sheet financing of their customers. While the US repo market is dominated by trading in US Treasuries, there are also active markets in bonds issued by US government-sponsored agencies, agency mortgage-backed securities (MBS) and corporate bonds. Prior to the crisis, non-government collateral contributed significantly to the rapid growth of the US repo market.
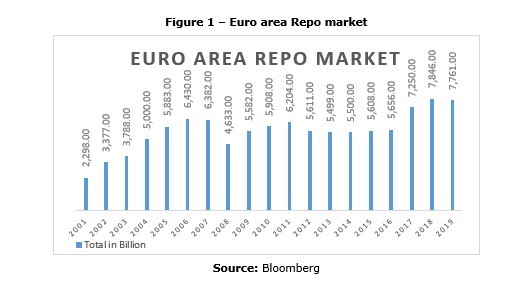
The euro area repo market (Figure 1) has also grown sharply, more than doubling in size (2002-2007) to reach more than €6 trillion outstanding (or around 65% of euro area GDP). Two thirds of the collateral is central government bonds from euro area countries, 16% from other euro area entities and 12% from other OECD countries. In terms of country of issuance, German collateral makes up one quarter of the market, followed by Italian at 13%, French at 11% and other euro area at 15%. Whereas there are more than 7,500 banking participants, activity is highly concentrated, with the top 20 banks accounting for 80% of activity.
Two thirds of repos have a maturity of one month or shorter, with the rest up to one year. Around half of euro repos are transacted directly between counterparties, while the remainder are brokered using either voice brokers or an electronic trading platform.
After years of fluctuations due to financial regulations strengthen and market seasonality in 2019 the “European repo market survey”, suggests the recovery of the market – that started in 2016 – has paused, albeit close to its record level. The slowdown in the repo market may have reflected the impact on financial markets of increased uncertainty in the global economy and the effect of inverting yield curves on fixed-income trading.
One exception to this was Italian government bonds, which continued to recover share in the repo market and performed very strongly in the first-half of 2019. Italian securities have been favored by investors in their search for yield, German securities on the other hand look to have suffered from increasingly negative yields.
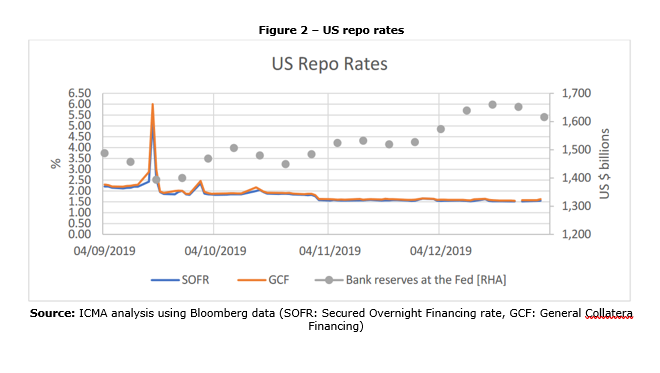
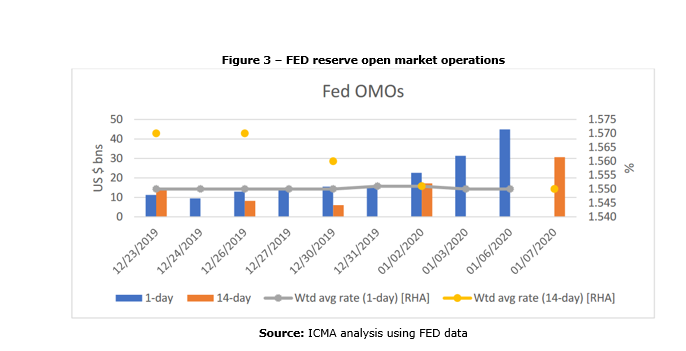
In US, following the much publicized spike in repo rates in September, there was understandably a lot of focus on how the market would behave over year-end. The extent of market nervousness was reflected in the return being priced around 4% up until a month before the date. However, the Federal Reserve’s attempts to keep bank reserves comfortably above the $1.5tn mark (Figure 5), through its open market operations and bill purchases, has proved successful in stabilizing money rates, and was further bolstered by an injection of increased liquidity over year-end (Figure 6). This also seems to have prompted a transfer of balance sheet by US banks from their European business to the US, providing for improved intermediation capacity.
In Europe the market is more fragmented than the US one: in the end of 2019, German GC for the turn (essentially the benchmark rate for year-end funding costs) was being priced in a -1.25/-1.75 range; more expensive than the -0.50 level where it has been trading normally, but notably cheaper than in advance of previous year-ends. As the year-end date rolled into spot-next (S/N), this began to cheapen through-1.00, and it soon became apparent that unlike previous year-ends, there was not the usual abundance of cash and shortage of collateral, and that banks’ balance sheets were relatively long collateral. As the date rolled into tom-next (T/N), which is the most active date for euro GC, rates cheapened further to average around-0.50, in line with the ECB Deposit Rate (Figure 7). French GC (which has very much become the substitute European ‘safe asset’) followed this pattern closely, only printing at slightly cheaper levels.
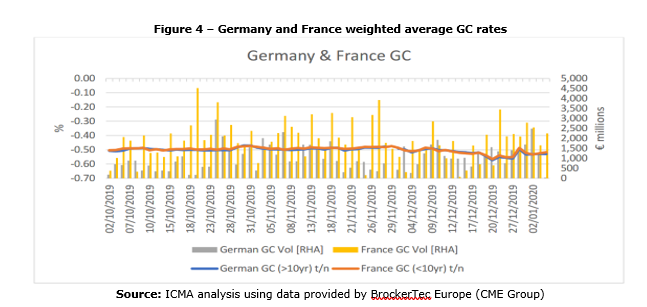
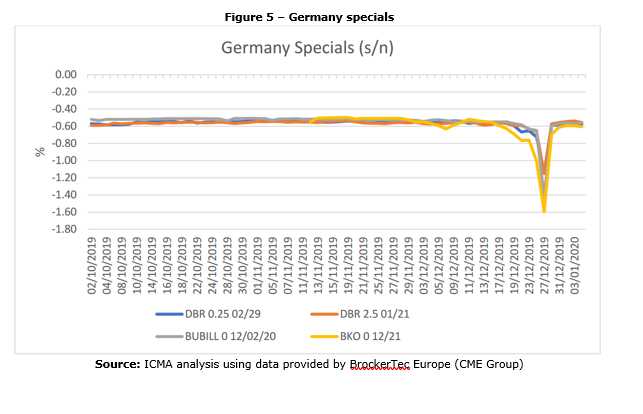
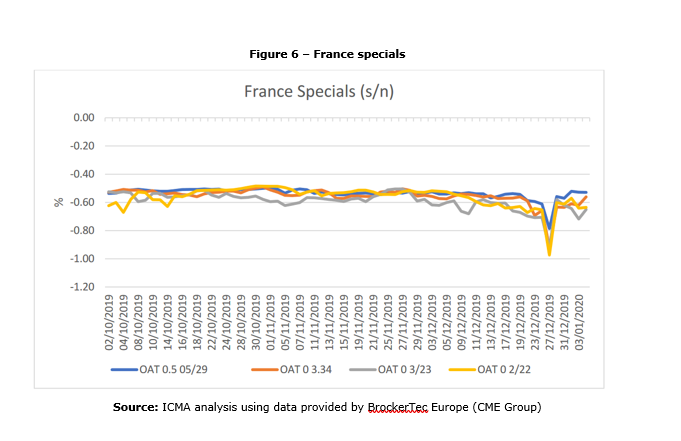
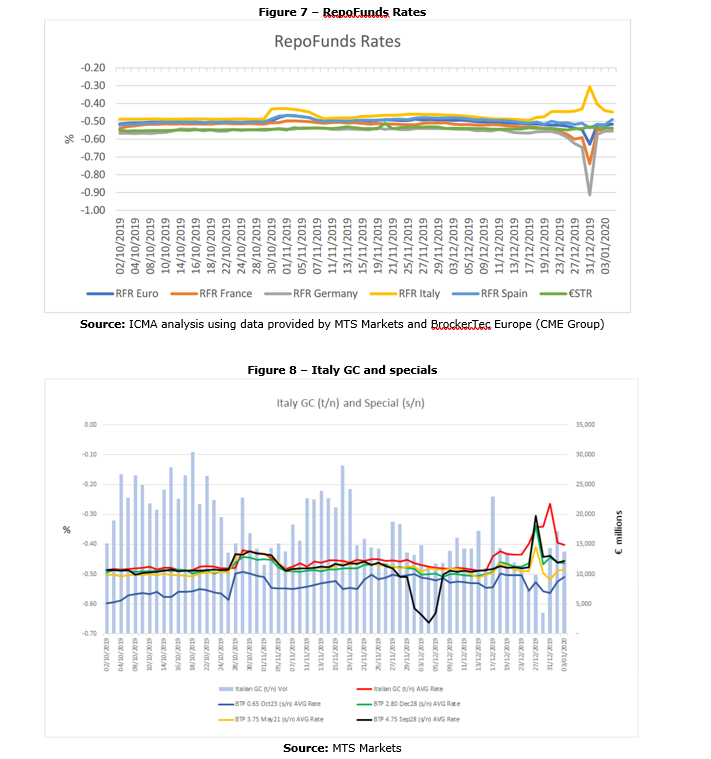
German and French specifics tracked the cheapening in GC, with the S/N levels averaging around 1% (which is reflected in the RepoFunds Rates – Figure 10). Accordingly, specials premium was much lower than previous year-ends. There was some short interest in the futures contracts’cheapest to deliver (CTD) bonds, in particular the 2yr (Schatz 0% 12/21) and 10yr (Bund 0.25% 2/29), although dealers report that the implied CTD repo rates remained relatively stable at around -0.702 which was not expensive enough to prompt significant selling. The most expensive specials levels are illustrated in Figure 8. Meanwhile the most expensive French specials (Figure 9) traded between -0.90 and -1.00.
Periphery GC rates tend to cheapen over year-end, in particular Italy, and 2019 was no exception although the moves were relatively range bound. Italy GC averaged -0.30, around 17bp cheaper than usual levels (Figure 10), with specifics around 5to 10bp more expensive (Figure 11). This relatively modest cheapening of Italian collateral was slightly surprising in light of the reserve tiering provisions, that were expected to drive more excess cash held by Italian banks out of Europe’s biggest domestic repo market and into higher yielding bank reserves, putting further upward pressure on Italian repo rates. Italian GC rates, however, have otherwise remained stubbornly close to the ECB Deposit Rate. Meanwhile, Spain GC traded around the -0.50 level (unchanged), with Spanish specifics averaging around -0.60.
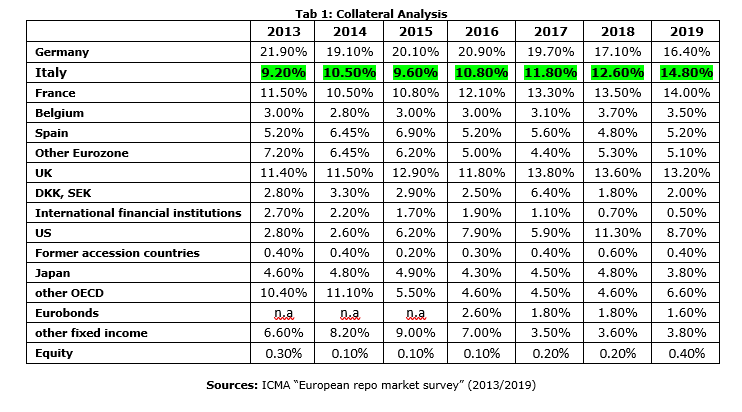
As shown in the table below since 2013 the usage of Italian collateral has increased surpassing France and reducing the gap with Germany; this positive trend has been possible thanks to the stable outlook given by the rating agencies during the last years, the higher premium paid on Italian instrument than the other paid by the other European countries and the quantitative easing program undertaken by the ECB to sustain the European economy.
At the end of 2019 the Covid-19, in a completely unexpected way, has manifested itself affecting our life in all its aspects. The global lockdown of people and countries, the global disruption of working activities, the cessation of production and consumption, in combination with other factors, are leading us towards the COVID-19 financial crisis. As seen in the last 10 years, once again the Central Banks are in the middle of the pandemic economic and financial implications management.
FED and ECB have seen the liquidity as the most crucial factor to be managed. As shown by the analyses in the previous paragraphs, the Repurchase Agreement and the Repo Market have a key function in contrasting the cyclic nature of the economy.
The Fed and ECB have already take in place some actions to face this situation.
In particular, the Federal Reserve announced various strategies, among them:
The European Central Bank itself already undertook some actions:
All the strategies mentioned share a flexibility driver and on the Repo market the instrument that represents the highest expression of flexibility is the Open Repo. The Central Banks could employ the Open Repo in an efficient way to implement the planned strategies by leveraging on the following factors:
We could continue mentioning plenty of other factors to leverage, but it is clear that these are the same factors used from 2008 financial crisis until today. The most important thing is to combine them together efficiently.
It is too early to perform detailed analysis on the benefits obtained by using these instruments and strategies, it is also early to conduct quantitative analysis about the results of these operations, but the historical evidence allows us to affirm that this could be the right way to follow, to guarantee short term liquidity and to avoid most of the problems related to the shortage of liquidity in the economic system.
Covid-19 is the invisible enemy that is affecting our life worldwide.
In this article we tried to highlight some key aspects that could help the economic system to avoid a deep recession using the Repo Market.
We analyzed the key technical aspects of the Repurchase Agreement and the logical flow behind its market functions; we also have seen which are the risks affecting the repo markets, and how the central banks and the primary dealers used this financial instrument for macroeconomic objects.
What has been highlighted with particular focus is the unquestionable strong linkage between repo market and financial system’s performance and health.
Another crucial aspect analyzed in the paper is the Repo Market primary role in the financial sector gained during the years till becoming a key instrument in particular for interbank exchanges; especially during crisis period it’s been affected by directives to prevent the collapse of the real economy thanks to stimulus by Central Banks.
Repo Market, although considered smoother and clearer than other type of financial instrument market (i.e. derivatives), plays a fundamental role especially considered the increasing importance of the Central Banks in nowadays economic and financial playground.
All the aspects highlighted converge into the possibility to use this market, and in particular the open repo, a specific product within itself, to tackle the financial implications due to Covid-19, considering also the inevitable consequences of the macroeconomic actions – taken by the Central banks – in terms of collateral segregation and market factors changes that are specific of the Repo Market.
Current Issues in Economics and Finance, September
FRBNY Current Issues in Economics and Finance, January/February
from the Libor panel”, BIS Quarterly Review, March, pp 47–58
Current Issues in Economics and Finance, September
Annalisa Izzo, Equity Partner, Consulting, Operations Transformation, aizzo@deloitte.it
Fabio Lucidi, Manager, Consulting, Operations Transformation, flucidi@deloitte.it
Simone Perego, Senior Consultant, Consulting, Operations Transformation, sperego@deloitte.it
Sergio Arcese, Analyst, Consulting, Operations Transformation, sarcese@deloitte.it
[1] MSCI World Index: The MSCI World Index is a broad global equity index that represents large and mid-cap equity performance across all 23 developed markets countries. It covers approximately 85% of the free float-adjusted market capitalization in each country.
Crypto derivatives exchange FTX has launched a novel way to trade the world’s most popular stocks…
https://www.coindesk.com/ftx-launches-bitcoin-pairs-against-amazon-apple-tokenized-stocks
This paper covers the banking crisis in Ireland that started in 2008, which stemmed from a combination of macroeconomic developments, risky bank practices and unsustainable fiscal policies. In line with the scope of this series, the paper focuses on the policy response…
The results reported in the October 2020 bank lending survey (BLS) relate to changes observed during the third quarter of 2020 and expectations for the fourth quarter of 2020…
The European Insurance and Occupational Pensions Authority has published its third annual European Insurance Overview…
https://www.eiopa.europa.eu/content/eiopa-publishes-third-annual-european-insurance-overview_en
