On August 1, it was discovered that the giant retail corporation Walmart has patented plans for a stablecoin…
https://news.bitcoin.com/banks-stopped-walmart-bank-now-the-retail-giant-hits-back-with-crypto/
On August 1, it was discovered that the giant retail corporation Walmart has patented plans for a stablecoin…
https://news.bitcoin.com/banks-stopped-walmart-bank-now-the-retail-giant-hits-back-with-crypto/
ESMA has taken product intervention measures relating to contracts for differences, imposing a temporary restriction on their marketing…
In luglio €-coin è risalito a 0,21 (da 0,14 in giugno), continuando tuttavia a segnalare – come dall’inizio del 2019 – una crescita modesta nell’area dell’euro…

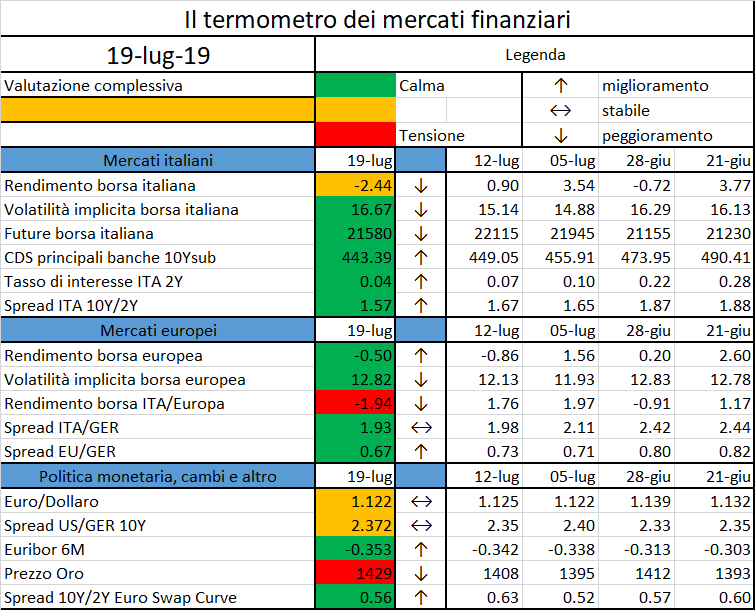
L’iniziativa di Finriskalert.it “Il termometro dei mercati finanziari” vuole presentare un indicatore settimanale sul grado di turbolenza/tensione dei mercati finanziari, con particolare attenzione all’Italia.
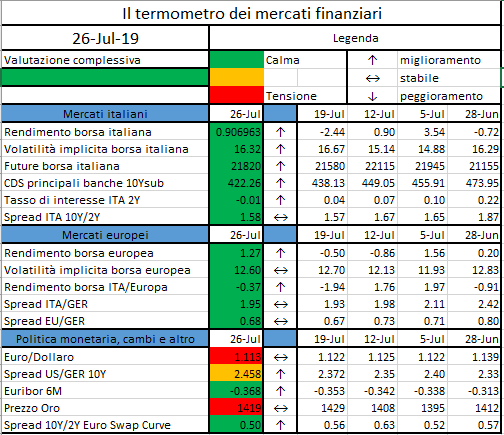
Significato degli indicatori
I colori sono assegnati in un’ottica VaR: se il valore riportato è superiore (inferiore) al quantile al 15%, il colore utilizzato è l’arancione. Se il valore riportato è superiore (inferiore) al quantile al 5% il colore utilizzato è il rosso. La banda (verso l’alto o verso il basso) viene selezionata, a seconda dell’indicatore, nella direzione dell’instabilità del mercato. I quantili vengono ricostruiti prendendo la serie storica di un anno di osservazioni: ad esempio, un valore in una casella rossa significa che appartiene al 5% dei valori meno positivi riscontrati nell’ultimo anno. Per le prime tre voci della sezione “Politica Monetaria”, le bande per definire il colore sono simmetriche (valori in positivo e in negativo). I dati riportati provengono dal database Thomson Reuters. Infine, la tendenza mostra la dinamica in atto e viene rappresentata dalle frecce: ↑,↓, ↔ indicano rispettivamente miglioramento, peggioramento, stabilità rispetto alla rilevazione precedente.
Disclaimer: Le informazioni contenute in questa pagina sono esclusivamente a scopo informativo e per uso personale. Le informazioni possono essere modificate da finriskalert.it in qualsiasi momento e senza preavviso. Finriskalert.it non può fornire alcuna garanzia in merito all’affidabilità, completezza, esattezza ed attualità dei dati riportati e, pertanto, non assume alcuna responsabilità per qualsiasi danno legato all’uso, proprio o improprio delle informazioni contenute in questa pagina. I contenuti presenti in questa pagina non devono in alcun modo essere intesi come consigli finanziari, economici, giuridici, fiscali o di altra natura e nessuna decisione d’investimento o qualsiasi altra decisione deve essere presa unicamente sulla base di questi dati.
The European Central Bank (ECB) and 21 other central banks that are signatories of the Central Bank Gold Agreement (CBGA) have decided not to renew the Agreement upon its expiry in September 2019…
https://www.ecb.europa.eu//press/pr/date/2019/html/ecb.pr190726_1~3eaf64db9d.en.html

Last 21.05.2019 EIOPA (European Insurance and Occupational Pensions Authority) published the calculation of the Ultimate Forward Rate (UFR) applicable as of 2020.
The value to apply for the EUR currency is 3.75%.
Actually, the EUR calculated value would be 3.55%, but because of both the current value (3.90%) and the limit on the maximum annual change (15 bps), the applicable UFR for the EUR currency is floored to 3.75%. The EUR UFR has been previously equal to 4.20% (2017), 4.05% (2018) and 3.90% (2019).
The methodology to derive the UFR was decided by EIOPA at the end of March 2017. EIOPA calculates the UFRs on an annual basis, by the end of March, and, if they are sufficiently different from those in place, requires an update 9 months after the announcement, at the beginning of the following year.
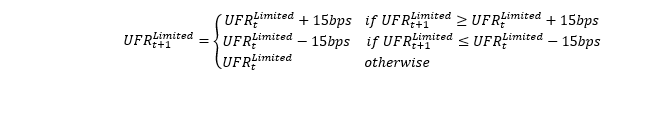
The change in the UFR is limited in such a way that either it can increase/decrease by 15bps, or it remains unchanged:
As the UFR is a target for the long-term Nominal rates, it is defined as the sum of two components:
This is the same for all currencies.
It is updated yearly, being the simple average of the past real rates since 1961 to the year before the calculation of the UFR.
Each annual real rate is derived as the simple arithmetic mean of the annual real rates of Belgium, Germany, France, Italy, the Netherlands, the United Kingdom and the United States. For each of those years and each country the annual real rate is calculated as follows:
Real rate = (short-term Nominal rate – Inflation rate) / (1+Inflation rate).
The following chart shows the Real rates time series updated at 2019 (till 2018)
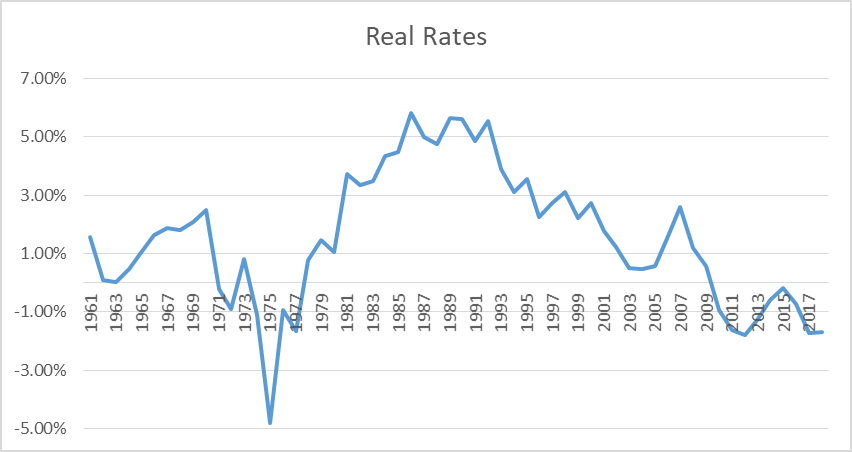
The time series is currently composed by 58 items, with the last observation, related to 2018, that enters the vector with a value of -1.68%.
The simple average gives a value of 1.51312%, rounded up to 1.55%.
Indeed, the expected real rate is rounded to full five basis points as follows:
This is currency specific.
It remains unchanged over time and it is based on the inflation targets of the central banks, assuming the values of 1%, 2%, 3% or 4% (e.g. 2% when the target is higher than 1%, but lower than 3%).
Where a central bank is not targeting a specific inflation figure but tries to keep the inflation in a specified corridor, the midpoint of that corridor is relevant for the allocation to the four inflation rate buckets.
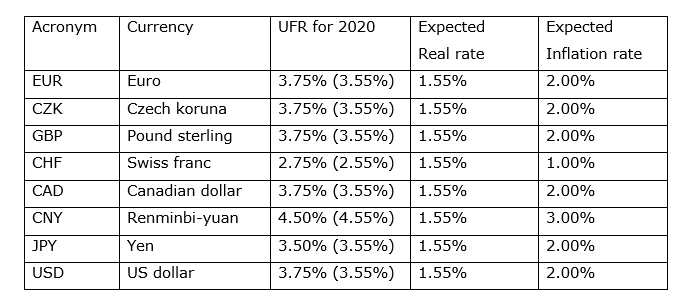
For currencies where the central bank has not announced an inflation target, the expected inflation rate is 2% by default. However, where past inflation experience and projection of inflations both clearly indicate that the inflation of a currency is expected in the long-term to be at least 1 percentage point higher or lower than 2%, the expected inflation rate will be chosen in accordance with those indications. The expected inflation rate will be rounded downwards to full percentage points. The past experience is assessed against the average of a 10 years time series and the projection is derived by the means of an ARMA model. The table below summarized the UFRs values for the major currencies.
The review focused on the effectiveness of NCAs supervisory practices to assess CCPs’ compliance with EMIR’s requirements on collateral and funding arrangements…
Mercedes Benz parent company Daimler has partnered with blockchain firm Riddle & Code to produce a hardware wallet for automobiles…

L’iniziativa di Finriskalert.it “Il termometro dei mercati finanziari” vuole presentare un indicatore settimanale sul grado di turbolenza/tensione dei mercati finanziari, con particolare attenzione all’Italia.
Significato degli indicatori
I colori sono assegnati in un’ottica VaR: se il valore riportato è superiore (inferiore) al quantile al 15%, il colore utilizzato è l’arancione. Se il valore riportato è superiore (inferiore) al quantile al 5% il colore utilizzato è il rosso. La banda (verso l’alto o verso il basso) viene selezionata, a seconda dell’indicatore, nella direzione dell’instabilità del mercato. I quantili vengono ricostruiti prendendo la serie storica di un anno di osservazioni: ad esempio, un valore in una casella rossa significa che appartiene al 5% dei valori meno positivi riscontrati nell’ultimo anno. Per le prime tre voci della sezione “Politica Monetaria”, le bande per definire il colore sono simmetriche (valori in positivo e in negativo). I dati riportati provengono dal database Thomson Reuters. Infine, la tendenza mostra la dinamica in atto e viene rappresentata dalle frecce: ↑,↓, ↔ indicano rispettivamente miglioramento, peggioramento, stabilità rispetto alla rilevazione precedente.
Disclaimer: Le informazioni contenute in questa pagina sono esclusivamente a scopo informativo e per uso personale. Le informazioni possono essere modificate da finriskalert.it in qualsiasi momento e senza preavviso. Finriskalert.it non può fornire alcuna garanzia in merito all’affidabilità, completezza, esattezza ed attualità dei dati riportati e, pertanto, non assume alcuna responsabilità per qualsiasi danno legato all’uso, proprio o improprio delle informazioni contenute in questa pagina. I contenuti presenti in questa pagina non devono in alcun modo essere intesi come consigli finanziari, economici, giuridici, fiscali o di altra natura e nessuna decisione d’investimento o qualsiasi altra decisione deve essere presa unicamente sulla base di questi dati.
