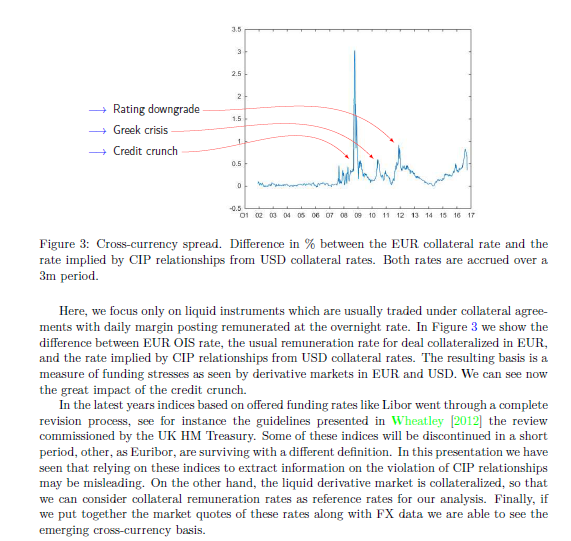
Il mondo dei pagamenti sta vivendo da alcuni anni un periodo di profonda trasformazione, che ha portato alla nascita di nuovi player nazionali ed internazionali volti a soddisfare le aspettative sempre crescenti di clienti ed esercenti sia in termini di esperienza di pagamento che di costi per transazione, con un numero sempre maggiore di nuovi servizi e modalità di gestione di spese e incassi.
Ma perché Hedge Fund, Venture Capital e Fintech continuano ad investire in un prodotto tradizionale come i pagamenti, che le Banche hanno sempre considerato poco più che una commodity e sul quale hanno detenuto per lungo tempo un monopolio? Quali fattori hanno spinto gli investimenti e l’innovazione in un campo che sembrava avere minor attrattiva di altri?
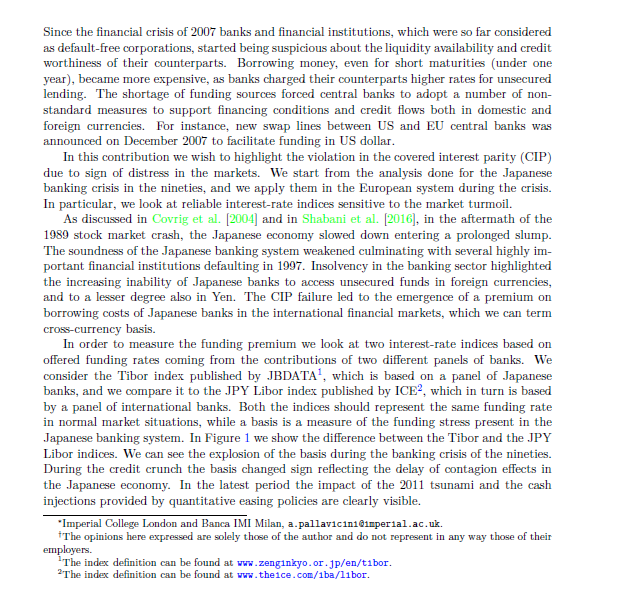
Una delle motivazioni più immediate è collegata al concetto di “data monetization” che i grandi player non bancari, in particolare quelli provenienti dal web, hanno sempre considerato quale uno dei principali asset sul quale investire con l’obiettivo di conoscere sempre meglio i comportamenti dei propri utenti. Informazioni, queste, da condividere con terze parti interessate a fare cross selling di prodotti e servizi collegabili a specifici comportamenti della clientela.
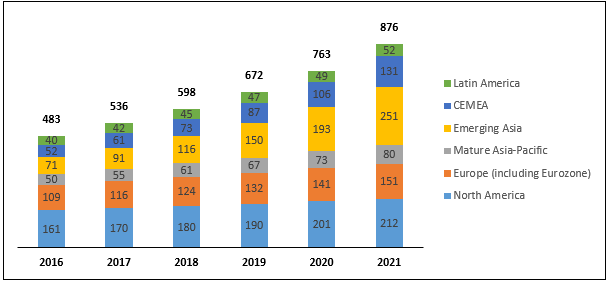
A nostro avviso tale motivazione, seppur rilevante, non può essere l’unica ad aver impresso tale accelerazione al mercato che evidenzia, ad esempio, un trend di crescita delle operazioni no-cash stimato in doppia cifra (circa 13%) fino al 2021 quando dovrebbero arrivare a sfiorare i 900 miliardi di dollari complessivi.
Infatti, diverse large corporate si sono attivate per ritagliarsi un ruolo di rilievo all’interno del mercato.
Facebook è entrata ormai nel mondo dei servizi finanziari attraverso la creazione della propria Banca e in particolare ha annunciato l’ingresso nel mondo dei pagamenti P2P grazie alla creazione di una propria moneta (Libra) con l’intento di gestire potenzialmente lo scambio di denaro fra i propri clienti (più di 1 miliardo al mondo).
Anche Apple, nel corso del 2019, ha presentato la propria carta di credito dichiarando che non utilizzerà mai i dati dei clienti come asset monetizzabile ed inserendo di fatto la “data protection” nell’alveo dei servizi a valore aggiunto rilevanti del prossimo futuro. In questo caso, Apple si è appoggiata a Goldman Sachs quale partner per gestire i servizi finanziari e gli adempimenti regolamentari fuori dalla portata di un soggetto non bancario.
Oltre ai grandi player, non vanno trascurate le realtà emergenti, nate negli ultimi anni grazie alla rinnovata attenzione per il mondo dei pagamenti, alle novità in termini regolamentari e alle nuove tecnologie che hanno rivoluzionato le esperienze e le esigenze della clientela.
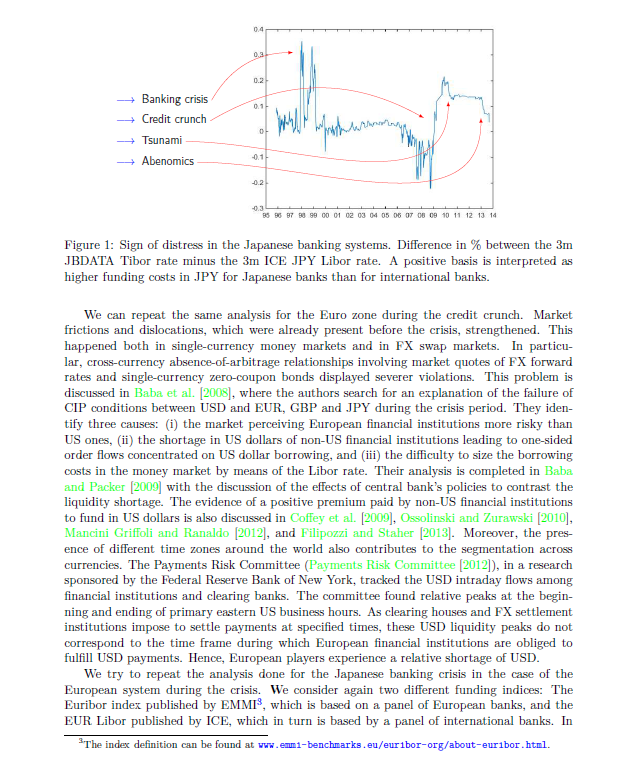
In tale contesto le grandi multinazionali del mondo retail, con rilevanti volumi di incassi e pagamenti anche di piccole dimensioni, hanno intrapreso, o stanno decidendo di farlo, un percorso di trasformazione del proprio modello operativo anche attraverso la costituzione di società “ad hoc” (IMEL o IP) al fine di gestire in autonomia una parte o la totalità del processo di collection, prima sostanzialmente demandato alle banche di riferimento. Questo trend è già presente in diversi settori (es. automotive, energy, …) dove alcuni player, nazionali ed internazionali, offrono wallet e strumenti digitali che consentono il pagamento del servizio/prodotto monitorandone l’efficacia ed efficienza durante tutto il ciclo di vita (acquisto, pagamento, consegna, utilizzo, funzionamento, …). In tal modo, l’utente finale percepisce il retailer come un canale di pagamento, consentendo a quest’ultimo, da un lato, la disintermediazione delle banche e il conseguente abbattimento delle commissioni, dall’altro il miglioramento della propria offerta attraverso nuove modalità di pagamento e nuovi servizi che rafforzano di fatto il legame con il cliente. In tale contesto, e nell’ottica di aggredire il mercato in crescita, rivestono particolare importanza le seguenti attività: definire il ruolo che il retailer vuole giocare, anche in coerenza con le opportunità offerte dalla PSD2 (es. PISP, AISP, …), in base alle proprie caratteristiche, valutare correttamente gli impatti organizzativi e di processo con particolare focus sull’order to cash, selezionare il partner tecnologico più adatto che consenta la migliore flessibilità e scalabilità.
In definitiva, gestire i pagamenti ha un valore strategico per qualsiasi realtà in quanto significa entrare nella vita di tutti i giorni delle persone costruendo di fatto un legame indissolubile in termini di utilizzo e mantenimento di device (Apple, Samsung), software (Facebook, Whatsapp, Instagram, …) o servizi (ENEL, EDISON, …).
In questo contesto per le banche tradizionali non sarà semplice trovare una collocazione che consenta di continuare a generare profitti perdendo potenzialmente la relazione diretta con il cliente finale. Per tale motivo, le istituzioni finanziarie dovranno agire celermente per rispondere in maniera efficace alle nuove esigenze dei clienti facendo leva su alcuni elementi distintivi che le contraddistinguono e rafforzando la loro posizione nei servizi innovativi anche alleandosi con le principali fintech sul mercato. Di seguito riportiamo alcune sfide che le istituzioni finanziare si troveranno ad affrontare nei prossimi 12-24 mesi:
- Request to Pay: il servizio, non ancora presente sul mercato, rivoluzionerà le modalità di pagamento tra privati e aziende;il ruolo del pagatore sarà infatti semplificato grazie alla ricezione di una richiesta di pagamento via notifica push, che potrà accettare o meno in modalità “on click” verificando che quanto richiesto sia corretto e senza il bisogno inserire ulteriori dati. Tale modalità di pagamento real-time semplificherà la fase di collection anche per i creditori, i quali potranno gestire in modalità totalmente automatica i processi di incasso;
- Instant Payments Fraud: i pagamenti istantanei non sono una vera novità ma diventeranno sempre più rilevanti nel mercato delle transazioni di pagamento sia retail che corporate. Oltre ad offrire una migliore customer experience, garantiscono un efficientamento dei processi operativi delle banche e dei processors riducendo drasticamente le attività operative di riconciliazione e i controlli manuali sulle singole transazioni non corrette. In tale contesto, il potenziale rallentamento nell’adozione dell’instant payment è da ricercarsi nella richiesta da parte degli utenti di garanzie sulla sicurezza dei loro pagamenti rispetto al rischio di frodi e di riciclaggio. In tale contesto, l’adozione di soluzioni evolute di artificial intelligence, in grado di allertare il pagatore rispetto a possibili errori nell’imputazione dei dati o bloccare la transazione in caso di rischio di riciclaggio, diventerà la chiave di evoluzione del servizio di pagamento istantaneo;
- Seamless cross-border payments: il mondo delle corporates, grandi o piccole che siano, si trova ad affrontare un crescente bisogno di gestire in modalità standard pagamenti e transazioni internazionali alla stregua di quelle domestiche al fine di semplificare i propri processi interni e garantire una modalità di gestione dei clienti e dei fornitori omogenea. In tale contesto, le attuali piattaforme di pagamento presenti sul mercato hanno ampi spazi di innovazione con l’obiettivo di offrire ai propri clienti soluzioni in grado di cogliere le opportunità offerte da un mercato sempre più globale;
Autori:
Massimo Tonassi– Partner Deloitte Consulting
Emanuel Doneda – Senior Manager Deloitte Consulting
Alessio Marras – Manager Deloitte Consulting
Alberto Comello – Senior Consultant Deloitte Consulting
Stefano Rampinelli – Senior Consultant Deloitte Consulting