L’evoluzione del contesto in cui opera l’industria bancaria
È opinione comune tra gli “addetti ai lavori”[1] che il modello di business bancario sarà impattato da alcuni macro-trend, tra i quali quelli dell’ evoluzione tecnologica e regolamentare, che porteranno progressivamente ad una scomposizione e ricomposizione della catena del valore e ad una ridefinizione delle modalità operative con cui i processi di banking saranno svolti. La value proposition dovrà, infatti, essere ripensata in ottica digitale ponendo il cliente al centro. Il percorso, indipendentemente dal modello che le banche decideranno di perseguire, passerà per un radicale cambio di mentalità e di strumenti e, se sviluppato in maniera coerente, sarà foriero di opportunità di crescita e rafforzamento del ruolo giocato nel servizio al cliente.
I macro-trend che impattano il modello di business bancario
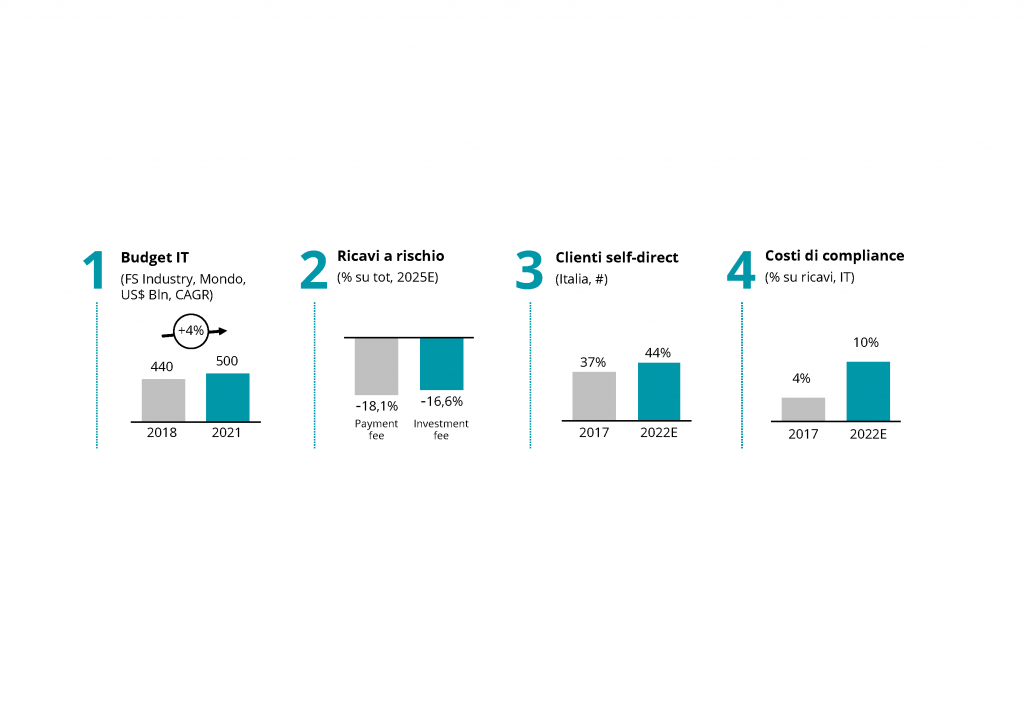
Il primo grande trend che osserviamo riguarda gli sviluppi tecnologici: soluzioni basate sull’AI, cloud computing, Internet of Things e big data analytics, che stanno ampliando la possibilità di offerta e di competizione da un lato, riducendo i costi dall’altro. A livello globale, infatti, assistiamo ad un trend di costante aumento della spesa in ambito IT da parte dell’industria finanziaria[2].
In secondo luogo, il contesto competitivo sta mutando rapidamente con l’ingresso di player da settori non finanziari, come start-up e grandi corporate tecnologiche, con il potenziale rischio di un’erosione dei margini degli istituti finanziari, soprattutto per quanto concerne i ricavi commissionali su pagamenti (-18%) e investimenti (-17%)[3].
Il terzo trend riguarda il cambiamento dei comportamenti del consumatore che diventa sempre più esigente e indipendente, tanto che in Italia si stima un aumento di circa il 7% dei clienti self-direct (che ricercano e scelgono prodotti in autonomia) tra 2017 e 2022[4].
Infine, la crescente regolamentazione ha effetti sia sui costi degli operatori il cui peso rispetto ai ricavi è previsto crescere di sei punti percentuali dal 2017 al 2022[5], sia sui loro modelli di servizio e di business come vedremo in questo articolo.
In questo contesto, l’evoluzione normativa gioca un ruolo fondamentale non solamente per gli oneri che impone ma anche per le possibilità che, in teoria, offre di evoluzione del modello di business. In tale ottica, l’entrata in vigore di nuove regolamentazioni sta segnando un punto di svolta per l’industria bancaria, che dovrà allinearsi sempre più ad un crescente grado di trasparenza (MiFID2, GDPR) e di apertura verso l’esterno (PSD2). In particolare, la Payments Service Directive 2 ha introdotto un nuovo set di regole per permettere l’accesso di operatori terzi ad alcune informazioni relative ai clienti e alle loro operazioni[6]. Come già avvenuto in altri settori e industry, i cui confini e paradigmi sono stati fortemente modificati dalla regolamentazione e dalla tecnologia, i processi e i bisogni fino a ieri prerogativa assoluta del sistema bancario, potranno essere soddisfatti da altri operatori più efficaci, e magari meno costosi, nel trasformare i prodotti e servizi in piattaforme, nel mettere in relazione i clienti tra loro e nel dare risposta alle loro esigenze in uno scenario sempre più open[7].
Questa evoluzione regolamentare, unita all’imperativo della digital transformation e ai macro trend sociali e competitivi dati dall’ingresso di challenger bank, fintech e GAFA, porterà ad una profonda revisione dei modelli di servizio e di business di molti istituti finanziari verso modelli sicuramente più customer centric e collaborativi.
Possibili nuovi modelli di business
La prospettiva di una maggiore apertura del settore bancario non solo è implicita in alcune novità regolamentari, ma è resa possibile, da una crescente diffusione di tecnologie come Infrastructure-as-a-Service (IaaS), Platform-as-a-Service (PaaS) e Software-as-a-Service (SaaS) che permettono a nuovi operatori di entrare nel settore con investimenti IT ridotti e servizi nativamente digitali. Dal punto di vista del consumatore finale, invece, il cambiamento nei modelli di fruizione dei servizi bancari è sicuramente avvantaggiato dalla sempre maggior facilità di accesso ai servizi digitali e alle informazioni (68,5% tasso di penetrazione smartphone in Italia[8]).
Molti altri settori, che hanno visto una trasformazione anche più accelerata del settore bancario, stanno sperimentando il successo delle logiche di “marketplace” in cui i clienti possono utilizzare un’unica interfaccia per accedere a prodotti e servizi offerti da una moltitudine di operatori. Questo modello-piattaforma, prevedibile anche nel settore bancario, offre ai clienti una serie completa di servizi, disegnata con un approccio olistico ai loro bisogni (i.e. finanziari e non nel caso delle banche), supportata dall’utilizzo sempre più diffuso ed efficace di big data analytics e dell’Intelligenza Artificiale.
Il settore bancario dovrà, quindi, abituarsi alla
presenza diversi modelli di business di piattaforma e marketplace, basati
quindi su meccanismi di collaborazione e co-opetition, dove offrire servizi
personalizzati anche attraverso provider esterni.
The power of platforms di John Hagel Pubblicato in Deloitte Business Trends series
Trend:
“Oggi i dirigenti aziendali più preparati sulle tematiche di innovazione e management hanno ben chiare le dinamiche che governano le piattaforme intese come nuovo modello di business. Le riconoscono laddove già emerse e comprendono il valore che generano: sia per chi le ha ideate e le gestisce, sia per chi vi partecipa come utente. […]
[Una moltitudine di business connessi attraverso una piattaforma] garantisce una risposta repentina ed efficace ai rapidi ed imprevedibili cambiamenti nella domanda. […] Le piattaforme condividono la caratteristica di essere modelli che possono essere portati a scala velocemente: con il crescere del numero di partecipanti non diventano più difficili da gestire, ma al contrario crescono in capacità di rispondere alle esigenze e aumentano di valore. […]
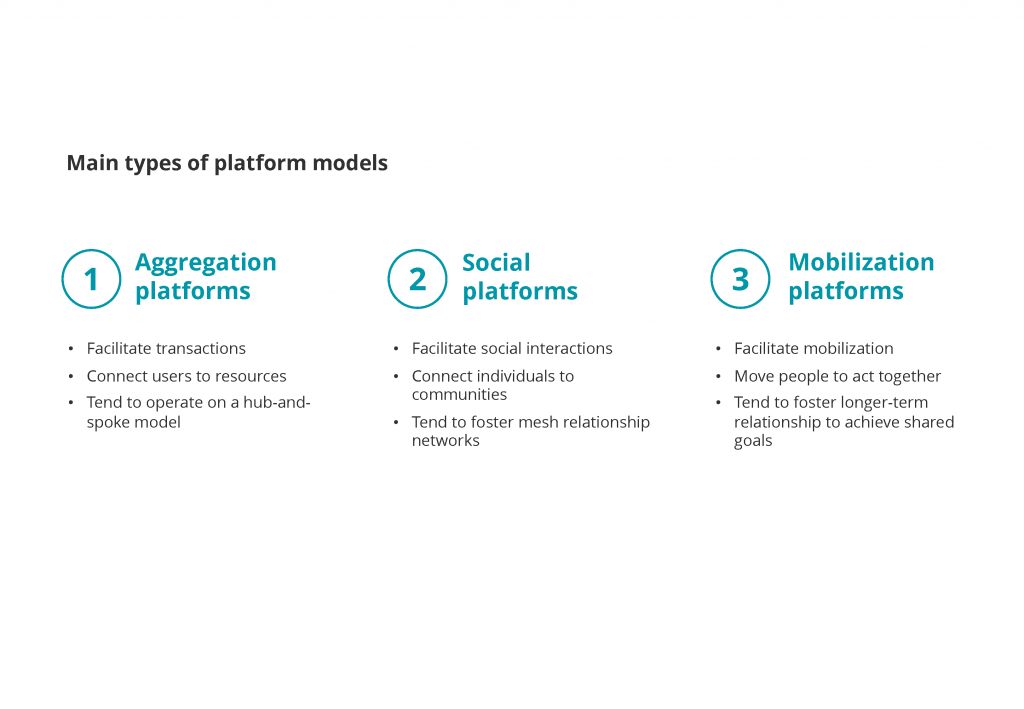
Oggi possiamo identificare tre tipologie di piattaforma che si differenziano in base al tipo di attività:
- Aggregation platform: facilita le transazioni economiche, connette utenti a risorse non immediatamente reperibili
- Social platform: favorisce le interazioni sociali, mette in relazione persone e comunità di persone
- Mobilization platform: facilita le mobilitazioni, organizza le persone per un agire comune.”
Conseguenze:
“Per i gruppi dirigenti, l’affermarsi delle piattaforme implica la necessità di considerare ed esplicitare il ruolo che intenderanno giocare in questi contesti, in quanto sono chiamati a disegnare e implementare strategie che assicurino la sopravvivenza e il successo delle loro organizzazioni nel futuro. Alcuni, ad esempio, potranno individuare idee di piattaforma ancora da sviluppare e sceglieranno se crearle unilateralmente o attraverso consorzi. Tutte le aziende dovrebbero esaminare le piattaforme che sorgono nel loro settore e considerare se e con che grado parteciparvi attivamente.
Le scelte strategiche che i leader e i manager aziendali compiono, riguardo a questo tipo di sfide, si basano su quattro principali tipi di benefici che si aspettano di ottenere dalle piattaforme. A seconda dell’enfasi relativa che viene posta sul miglioramento delle performance, sulla crescita esponenziale, sull’innovazione distribuita e sulla modellizzazione di nuove strategie[9], le aziende si orientano verso determinate tipologie di piattaforma rispetto ad altre.
Le maggiori opportunità per conquistare aree di valore generato sulle piattaforme richiedono una comprensione profonda degli elementi che possono creare e rendere sostenibili le fonti di vantaggio competitivo e permettere l’appropriazione di una quota del valore creato sulla piattaforma maggiore rispetto al contributo apportato. […]
Commento di Peter Schwartz
Peter Schwartz è Senior Vice President Global Government Relations & Strategic Planning per Salesforce.com. Prima di entrare in Salesforce, è stato co-fondatore e presidente di Global Business Network, società del Gruppo Monitor, e partner di Monitor Group (ora Monitor Deloitte): una famiglia di società di servizi professionali dedicate al miglioramento della competitività dei clienti. Futurista e business strategist di fama internazionale, Peter è specializzato nella pianificazione di scenari: collabora con aziende, governi e istituzioni per creare prospettive alternative per il futuro e sviluppare strategie solide per un mondo in evoluzione.
“Oggi le piattaforme rendono possibile l’apprendimento e l’innovazione alla velocità necessaria al business grazie all’offerta di spazi di collaborazione e talvolta anche di aumento esponenziale della produttività che creano valore aggiunto. […]”
In un mondo di ecosistemi di business, la lealtà può essere la più importante delle valute scambiate. Per Salesforce, un vivace ecosistema fatto di clienti-sviluppatori, applicazioni e servizi di supporto e che ha come linfa vitale la fedeltà e l’impegno reciproco, la lealtà è il motore di crescita. Gran parte del valore creato sulla piattaforma Salesforce è di proprietà diretta dei nostri partner e clienti, ed è esattamente come dovrebbe essere. Pensiamo al valore condiviso che viene creato collettivamente come l’adesivo che tiene connessa la piattaforma Salesforce all’ecosistema più ampio in cui il cliente, ora in co-evoluzione con Salesforce, compete e genera ritorni economici. […]”[10]
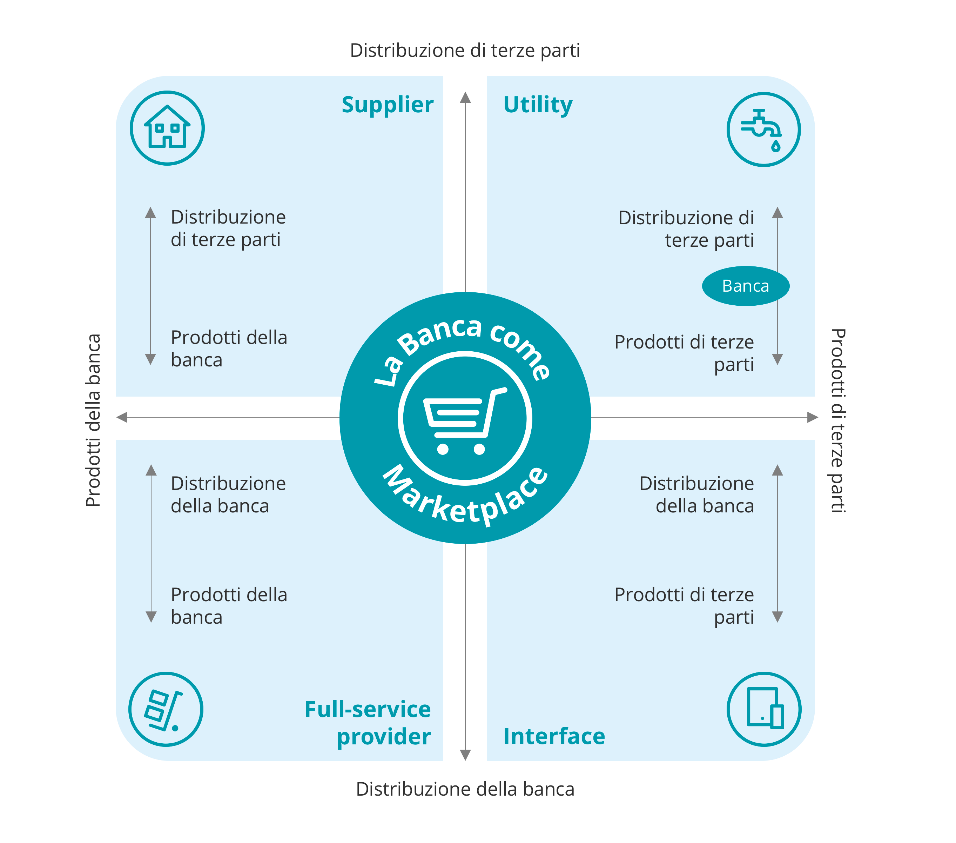
È opinione di Monitor Deloitte che nel prossimo futuro avremo quattro modelli operativi open non mutuamente esclusivi tra cui le banche potranno scegliere:
- full-service provider: mantenere lo status quo con un’offerta completa di servizi e prodotti proprietari distribuiti attraverso una rete controllata direttamente e una minima interazione e collaborazione con terze parti;
- utility: rinunciare alla creazione dei prodotti e alla loro distribuzione ma offrire servizi e infrastruttura tecnologica (es. servizi di AML/KYC, payment gateway, …) ad altri operatori finanziari che gestiranno il prodotto e la relazione con il cliente;
- supplier: focalizzarsi sulla fabbrica prodotto per offrire elevati gradi di performance e personalizzazione ma rinunciare alla distribuzione che sarà affidata a piattaforme e canali gestiti da altre banche e terze parti;
- interface: concentrarsi sulla distribuzione e sulla relazione con il cliente creando una piattaforma e un’interfaccia unica attraverso la quale offrire prodotti e servizi di terze parti.
L’open banking pone dunque le banche tradizionali difronte a nuovi quesiti strategici. Quale ruolo giocare in questo nuovo contesto? Come evolvere i propri core business e la correlata catena del valore?
L’adozione di un modello di open banking, con il passaggio da un modello più incentrato sul prodotto a uno più focalizzato sul soddisfacimento dei fabbisogni del cliente, renderà molto più labili i confini del settore, ma allo stesso tempo potrà allargare il mercato potenziale verso attori che prima, per diverse ragioni, non venivano serviti (es. unbanked, millennials); il tutto, con il coinvolgimento di attori ad oggi non percepiti come competitor dalle istituzioni non creditizie. I germogli di questo nuovo stato si stanno già osservando con accordi di collaborazione tra banche, assicurazioni, player postali, operatori della GDO e aziende tecnologiche e con l’entrata sul mercato di un numero importante di Fintech.
Il vantaggio competitivo e nuove sfide dei player tradizionali
Le nuove sfide dell’open banking porteranno le banche a confrontarsi con operatori diversi, molti dei quali fuori dai loro radar, ponendo nuove sfide manageriali alla ricerca di nuovi vantaggi competitivi. Se le Fintech e nuove “challenger bank” – banche totalmente digitali con modelli di business e di servizio “non tradizionali” e tipicamente low cost – possono contare sull’agilità di un prodotto nativo digitale, le banche tradizionali, alle prese con sistemi legacy spesso costosi, vecchi e che si dimostrano inadeguati a offrire customer experience al livello dei nuovi competitor, dovranno necessariamente trovare nuove dimensioni di competitività. Come infatti si evidenzia da un’indagine demoscopica condotta in UK da Deloitte, i clienti risultano maggiormente disposti (nel 58% dei casi[11]) ad usare servizi offerti da new entrant, come banche mobile-only, a fronte di una più vasta offerta di funzionalità banking-related.
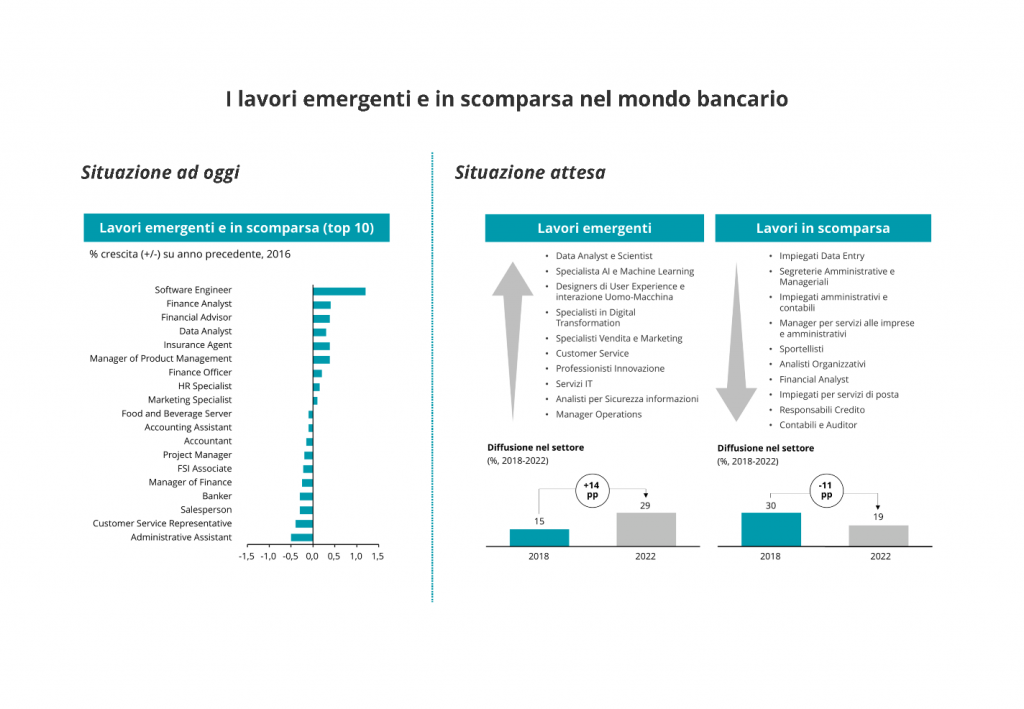
Per rispondere a queste sfide, le banche dovranno puntare su quattro principali elementi di forza rispetto a fintech, challenger bank e, potenzialmente, giganti del web: la fiducia di cui godono, le loro expertise industriali, la disponibilità di risorse umane e finanziarie (i.e. di investimento) e la capacità di offrire una vasta e profonda scala di servizi bancari. Ma probabilmente questi vantaggi da soli non basteranno. Dovrà affiancarsi un profondo cambio di mentalità nel modo di fare banca e quindi dalla valorizzazione del capitale umano, vero asset a disposizione delle istituzioni finanziarie. Le competenze necessarie per vincere oggi sono ovviamente diverse rispetto al passato e cambiano ad una velocità mai vista (da 30 a 5 anni a partire dagli anni ’80 ad oggi). Le banche, quindi, non solo dovranno ricercare nuovi profili e formarli in una logica di continuo apprendimento, ma dovranno considerare che nel mondo dell’open banking le soft-skill conteranno come, se non di più, delle hard skill. Stiamo già assistendo infatti al passaggio dal modello STEM (Science, Technology, Engineering & Mathematics) a quello STEAM con l’aggiunta del concetto di Arts: capacità di pensiero critico ed analitico, attitudine al continuo apprendimento, intelligenza emotiva, ma anche capacità di analisi e gestione dei dati, conoscenza dell’informatica e del digitale, comunicazione e service design sono i tratti distintivi delle nuove professionalità necessarie alle banche per prosperare.
Le soluzioni e i prodotti del futuro saranno disegnati attorno all’uomo e alle sue caratteristiche, non più soltanto al singolo bisogno: pertanto, accanto alla tecnicalità (es. caratteristiche del mutuo), il comportamento umano e il percorso cognitivo delle persone guideranno la realizzazione di nuove soluzioni. I nuovi profili dei dipendenti bancari non saranno quindi solo ingegneri informatici e specialisti finanziari, ma anche data scientist e UX (User eXperience) designer, psicologi comportamentali[12].
I punti di forza dell’industria bancaria
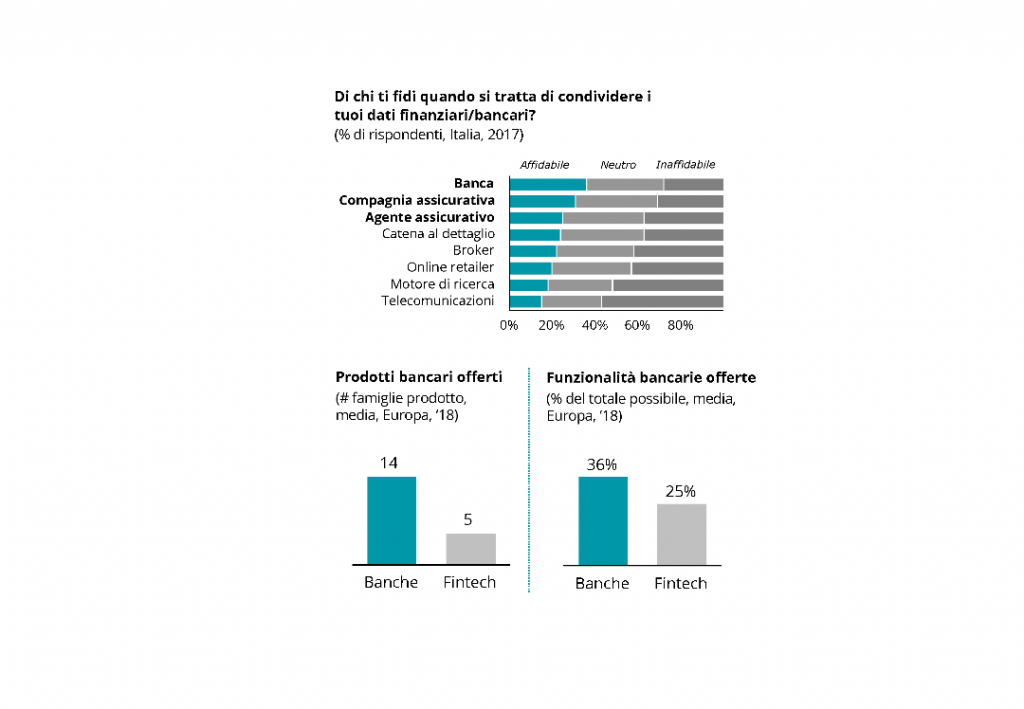
Il primo elemento di vantaggio competitivo per le banche è la fiducia di cui godono presso i consumatori e che costituisce elemento fondante del business stesso. In Italia, ad esempio, circa il 60%[13] della popolazione non ritiene affidabili le cosiddette terze parti per la gestione dei propri dati finanziari.
In secondo luogo, le stesse fintech riconoscono alle banche tradizionali una conoscenza di settore ad oggi impareggiabile, sia in termini di expertise industriale che di dati e relazione con la clientela.
Terzo elemento da considerare è la massa critica degli istituti più grandi che possono contare su una vasta e stabile base clienti, oltre che su una notevole capacità di investimento e disponibilità di risorse.
Ultimo, ma solo in ordine di esposizione, l’ampiezza e la profondità dell’offerta delle banche tradizionali che, seppur non onnicomprensiva e in parte da rivedere in ottica digitale, risulta circa tre volte maggiore in termini di numero di famiglie prodotto offerte rispetto alle fintech, come evidenziato da un’indagine Deloitte a livello EMEA[14].
Conclusioni
Le banche saranno chiamate ad evolvere lo status quo e condividere la titolarità esclusiva della relazione con il cliente, dell’infrastruttura e del prodotto, ed individuare un ruolo in cui eccellere e vincere all’interno di un sistema di condivisione.
Dal nostro punto di vista, l’evoluzione dei modelli di business dell’industria bancaria, abilitati dalle tecnologie digitali e dall’open banking, si caratterizza come opportunità per le banche di sviluppare ancora più in profondità la propria relazione con i loro clienti e di diventarne ancora di più punto di riferimento: capirne i bisogni, sia funzionali che emotivi e non solo finanziari, sarà dunque fondamentale per aumentare la propria base clienti e la loro lealtà al brand.
In ultima istanza, non si tratta solo di normativa, tecnologia, prodotto o modello di servizio. È necessario guardare all’open banking come filosofia: un nuovo approccio basato sulla condivisione dei dati in primis, ma anche di sistemi, servizi industriali, canali distributivi e soprattutto di clienti, attorno ai quali sviluppare nuovi standard di prodotto e servizio.
Nella nostra visione le banche dispongono di vantaggi competitivi
importanti, ad oggi forse non pienamente sviluppati, per rimanere al top e
abbracciare le logiche di marketplace. Dovranno
evolvere i loro modelli di leadership in ottica digitale, modificare le loro
strutture interne rendendole più agili, rivedere l’allocazione del budget IT
verso progetti di trasformazione, selezionare e formare personale non solo con
profili diversi, ma anche pronto a cimentarsi in sfide nuove, imparare continuamente
e adattarsi. Al contrario, se resteranno legate a logiche passate si
troveranno a difendere un vantaggio competitivo le cui barriere all’ingresso cadranno
e daranno ragione a chi afferma: “a bank is a fax machine”, che come sappiamo
sono cadute nel dimenticatoio.
Contatti
Carlo Murolo, Senior Partner, Head of FS Industry, Deloitte Consulting, cmurolo@deloitte.it
Manuel Pincetti, Senior Executive, Monitor Deloitte Strategy Consulting, mpincetti@deloitte.it
Gabriele Falcone, Executive, Monitor Deloitte Strategy Consulting, gfalcone@deloitte.it
Giacomo Gabrieletto, Senior Associate, Monitor Deloitte Strategy Consulting, ggabrieletto@deloitte.it
Ringraziamenti
Un
ringraziamento speciale a E. Zanchetta
e A. Brusasco per il contributo di
valore apportato nella scrittura dell’articolo.
[1] “Rapid technological disruption will break apart the banking oligopoly and the majors’ business models. […] To survive, banks will need to partner more with start-ups and global tech giants. And potentially sell others’ financial products”. Shayne Elliott, CEO dell’australiana ANZ
[2] Elaborazioni Monitor Deloitte su dati IDC
[3] Elaborazioni Monitor Deloitte su dati BCE, Banca d’Italia, Eurostat e dati proprietari
[4] Banking online e pricing | Finisce l’era a zero spese – https://www2.deloitte.com/content/dam/Deloitte/it/Documents/strategy/Monitor_Deloitte_Banche_Online_2018.pdf
[5] Elaborazioni Monitor Deloitte su dati Banca d’Italia e dati proprietari
[6] Payments Service Directive 2 (PSD2) https://www2.deloitte.com/content/dam/Deloitte/it/Documents/technology/B_Payment%20Service%20Directive-new.pdf
[7] Deloitte University Press, Patterns of Disruption series tra cui Impact on wholesale banking https://www2.deloitte.com/insights/us/en/focus/disruptive-strategy-patterns-case-studies/wholesale-banking.html
[8] eMarketer Data
[9] https://hbr.org/2008/10/shaping-strategy-in-a-world-of-constant-disruption
[10] The power of platforms: https://www2.deloitte.com/insights/us/en/focus/business-trends/2015/platform-strategy-new-level-business-trends.html
[11] How to flourish in an uncertain future open banking, Deloitte, https://www2.deloitte.com/uk/en/pages/financial-services/articles/future-banking-open-banking-psd2-flourish-in-uncertainty.html – https://www2.deloitte.com/content/dam/Deloitte/uk/Documents/financial-services/deloitte-uk-open-banking-how-to-flourish-in-an-uncertain-future.pdf
[12] The future of Jobs, World Economic Forum: https://www.weforum.org/agenda/2018/09/future-of-jobs-2018-things-to-know/
[13] Monitor Deloitte survey on more that 1k respondents
[14] Monitor Deloitte on Deloitte EMEA Digital Maturity 2018 report and proprietary data