Robotic Process Automation – Challenges of Implementation in the Financial Services Industry
a cura di Deloitte Italia

Lug 15 2018
Robotic Process Automation – Challenges of Implementation in the Financial Services Industry  a cura di Deloitte Italia

Robotic Process Automation – Challenges of Implementation in the Financial Services Industry

In more established industries, finding new ways of increasing internal efficiency while maintaining a high level of customer satisfaction is persistently becoming more crucial not just to achieve success, but also to survive in an ever-competitive environment.

The Financial Service Industry (from now on, FSI) belongs to this category of slowly increasing markets and shows several characteristics that make it one of the best subjects for the application of Robotic Process Automation.

Robotic Process Automation (from now on, RPA), often referred to as “robotics” or “robots”, is defined as the automation of rule-based processes with software integrated at user interface level that can interact with the internal information technology landscape or external web application simulating a human. In other terms, RPA is a software solution that mimics a variety of rule-based, repeatable processes that do not require real-time creativity or judgment.

Classic processes that can benefit from RPA typically have repeatable and predictable interactions with IT applications, including those that may require toggling between multiple applications. These peculiar characteristics can be easily found in almost all of the totality of FSI middle and back-office processes.

In essence, a robot can perform activities like opening emails and attachments, logging into web/enterprise applications, moving files and folders, filling in forms, reading/writing from databases, scraping data from the web, connecting to system API, extracting structured data from documents and following “if/then” decision rules. On the other hand, a robot is not designed to: read hand-written documents, understand the meaning of documents, self-adapt to variations of the underlying applications, produce physical outputs, perform complex tasks requiring human interaction, cognitive systems or artificial intelligence.

Benefits

The main results of a successful RPA implementation are identifiable in significantly faster (payback at less than 12 months[1]) and higher ROI, achievable with a limited investment compared to a traditional IT project and tangible efficiency improvements (about 20% of FTE capacity coverable by robots on average[1]).

Nonetheless, organizations adopting RPA solutions typically experience benefits beyond mere cost reduction and speed of implementation:

  • Decreased cycle times: usually robots are faster than humans in work execution and can run 24/7;
  • Flexible cost structure: robots can be scheduled and reassigned depending on the current needs of the organizations (e.g. by dynamically allocating more robots to more cumbersome or urgent processes);
  • Improved accuracy: as long as any exception is properly mapped, robots cannot fail in the standard execution (e.g. they do not make typos);
  • Improved organizational structure: RPA can free staff from the more repetitive and alienating tasks and enables a more valuable personnel allocation;
  • Detailed data capture: robotic solutions are designed to provide users and controllers with a wide set of reports and logs, useful for supporting further process improvements, auditing and bolstering regulatory compliances.

Challenges

These are just some of the examples of the benefits that a robotic solution can yield to a financial service provider, which well explains why nowadays RPA has become a key topic of the business jargon of this industry.

Yet there are several challenges that may emerge when implementing a RPA solution, whose nature can span from mere technical and infrastructural issues to strategic and behavioural matters.

First, RPA is so effective in the short time that it incurs in the risk of being considered as a simple “patch” solution, only able to quickly solve a temporary issue, with the result that Proof of Concepts and Technologies take precedence over a cohesive, end-to-end strategy that considers also people change management implications. Moreover, organizations often take a de-centralized approach to RPA, testing the capability across multiple functions with uncoordinated initiatives. This short sighted approach eventually leads to an ineffective scaling of RPA throughout the organization.

On the other hand, a successful pilot implementation may create a misconception of what RPA is actually capable of, overestimating its possible applications also on processes that do not comply with the automation basic requirements. More commonly, organizations perform an RPA transformation without considering broader value propositions comprehensive of complementary technologies, which drastically reduce the possibilities of an effective implementation.

In some cases, employees may turn to be apprehensive about the potential impacts of service automation on their jobs, and executives cannot neglect this aspect. Indeed, where one side sees an opportunity for better allocation of resources to more valuable activities, the other side perceives a threat to their role in the organization. In the worst case, staff members might panic and even sabotage new initiatives.

Finally, even though RPA is designed to mimic human behaviour, a minimum of process reengineering is required in order to effectively automate the activities. This fact adds to the basket all the possible issues that may occur whenever a change is brought to a consolidated procedure, and the complexity is further increased if we consider that the change involves both the business and the IT functions.

The largest threat that all these elements bring together is the concrete possibility of a stand-alone RPA implementation, as showed in a research conducted by Deloitte in 2017[1] over 400 firms spread across the world. Indeed, while 53% of the interviewed sample had started an RPA initiative, only 3% was able to scale such activities and reach a steady productivity state.

Solutions

Therefore, despite the easiness of implementation of an RPA solution compared to a traditional IT change, a concretely effective process automation is far from being a simple task.

Indeed, the correct adoption of RPA in the organization requires executives and users to take into account several aspects, not just IT-related, such as:

  • A strong commitment from management to help deliver the service automation vision. This can be achieved by steering internal communications to inform staff about the service automation strategy and timing and its effects on employees;
  • An early involvement of IT professionals to avoid risks to the organization, such as exposing sensitive data, and to plan a comprehensive automation roadmap, which is crucial to ensure a proper development of RPA aligned with traditional systems evolution;
  • A direct engagement of employees in the design and implementation of the RPA solution, which can also be very effective in reducing resistance and can lead to further positive impacts including higher job satisfaction.

The result of these considerations is the creation of a centralized Center of Excellence inclusive of the organizational layers involved in the initial implementation. The CoE will represent the unit that, by applying a sound governance framework, will be in charge of the evolution of robotics in the organization.

Under a strategic perspective, to successfully start and maintain an RPA initiative, an organization should:

  • Adopt a different mind-set that considers a new category of digital workforce, inclusive of users and robots as well. This novel perception requires first to start with a bold ambition for the digital workforce, which is then translated in a continuous transformation programme. In turn, this needs continuous and apt investments: RPA should not be considered as an one-off cost, but its effective implementation and improvement has to be sustained over time;
  • Be aware that RPA actually represents only the first step of the automation spectrum. Indeed, RPA can get more effective if it is connected with other supporting/enabling technologies, such as BPM, OCR and Machine Learning. The development of further, “smarter” technologies with RPA tools enables the real paradigm shift towards the Intelligent Enterprise;
  • Manage RPA issues that can emerge in aligning the new solution with the current IT architecture, by having a strong checklist in place regarding infrastructure and compliance requirements. This point is crucial in order to ensure that the correct infrastructure is in place and compliance requirements have been met early on in the project. The proper architectural alignment comes first with the targeted selection of the RPA vendor that best meets the business needs.

Maximizing the impact of RPA requires a committed shift in mind-set and an approach switch from experimentation oriented to transformation oriented.

Conclusion

The recent developments of the Financial Services Industry are shifting the focus on efficiency. Thanks to its ability to deliver quick and concrete results with a limited investment, RPA appears to be the right solution for such emerging needs.

Yet, despite the several benefits provided, RPA comes also with some potential issues that may halt its development. Elements like poor planning, employees’ resistance and change aversion may indeed represent a critical obstacle to a proper scaling of RPA in the organization, which would lay-off many of the potential benefits.

Therefore, for an organization resolving to this kind of implementation it is essential to adopt a strategic approach inclusive of both the organizational and technical aspects that considers RPA as the starting element towards the realization of the digital enterprise run by the digital workforce.


Alessandra Ceriani – Partner Deloitte Consulting

Alberto D’Elicio – Manager Deloitte Consulting

Giuseppe Scotti – Analyst Deloitte Consulting


Notes

[1] Deloitte, The robots are ready. Are you? Untapped advantage in your digital workforce, 2017

Il termometro dei mercati finanziari (13 luglio 2018)
a cura di Emilio Barucci e Daniele Marazzina

Lug 14 2018
Il termometro dei mercati finanziari (13 luglio 2018)  a cura di Emilio Barucci e Daniele Marazzina

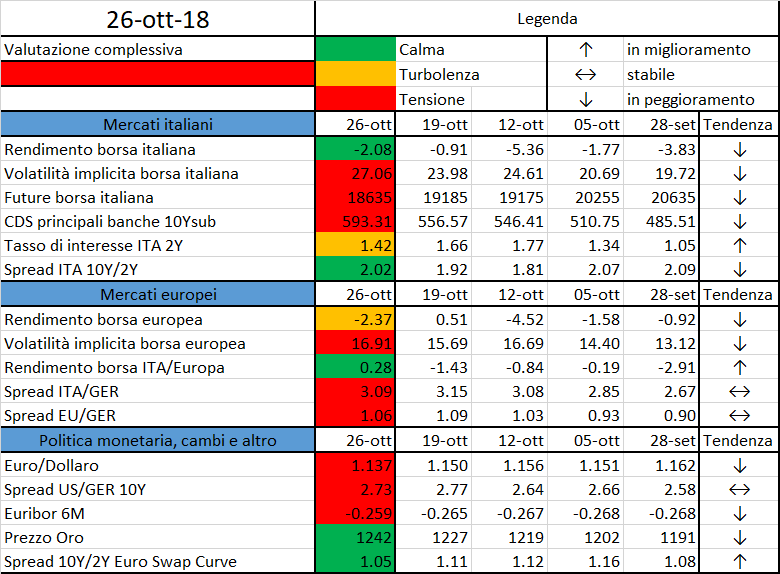
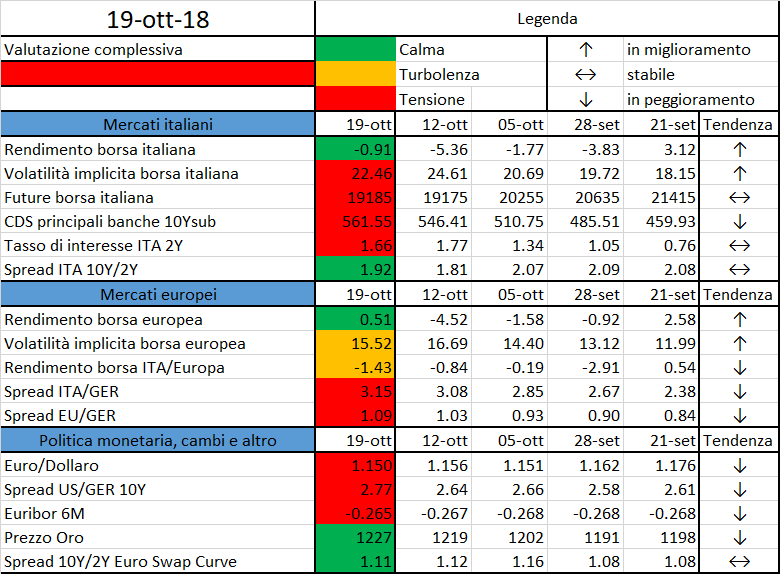
Continua l’iniziativa di Finriskalert.it “Il termometro dei mercati finanziari”. Questa rubrica vuole presentare un indicatore settimanale sul grado di turbolenza/tensione dei mercati finanziari con particolare attenzione all’Italia.

Significato degli indicatori

  • Rendimento borsa italiana: rendimento settimanale dell’indice della borsa italiana FTSEMIB;
  • Volatilità implicita borsa italiana: volatilità implicita calcolata considerando le opzioni at-the-money sul FTSEMIB a 3 mesi;
  • Future borsa italiana: valore del future sul FTSEMIB;
  • CDS principali banche 10Ysub: CDS medio delle obbligazioni subordinate a 10 anni delle principali banche italiane (Unicredit, Intesa San Paolo, MPS, Banco BPM);
  • Tasso di interesse ITA 2Y: tasso di interesse costruito sulla curva dei BTP con scadenza a due anni;
  • Spread ITA 10Y/2Y : differenza del tasso di interesse dei BTP a 10 anni e a 2 anni;
  • Rendimento borsa europea: rendimento settimanale dell’indice delle borse europee Eurostoxx;
  • Volatilità implicita borsa europea: volatilità implicita calcolata sulle opzioni at-the-money sull’indice Eurostoxx a scadenza 3 mesi;
  • Rendimento borsa ITA/Europa: differenza tra il rendimento settimanale della borsa italiana e quello delle borse europee, calcolato sugli indici FTSEMIB e Eurostoxx;
  • Spread ITA/GER: differenza tra i tassi di interesse italiani e tedeschi a 10 anni;
  • Spread EU/GER: differenza media tra i tassi di interesse dei principali paesi europei (Francia, Belgio, Spagna, Italia, Olanda) e quelli tedeschi a 10 anni;
  • Euro/dollaro: tasso di cambio euro/dollaro;
  • Spread US/GER 10Y: spread tra i tassi di interesse degli Stati Uniti e quelli tedeschi con scadenza 10 anni;
  • Prezzo Oro: quotazione dell’oro (in USD)
  • Spread 10Y/2Y Euro Swap Curve: differenza del tasso della curva EURO ZONE IRS 3M a 10Y e 2Y;
  • Euribor 6M: tasso euribor a 6 mesi.

I colori sono assegnati in un’ottica VaR: se il valore riportato è superiore (inferiore) al quantile al 15%, il colore utilizzato è l’arancione. Se il valore riportato è superiore (inferiore) al quantile al 5% il colore utilizzato è il rosso. La banda (verso l’alto o verso il basso) viene selezionata, a seconda dell’indicatore, nella direzione dell’instabilità del mercato. I quantili vengono ricostruiti prendendo la serie storica di un anno di osservazioni: ad esempio, un valore in una casella rossa significa che appartiene al 5% dei valori meno positivi riscontrati nell’ultimo anno. Per le prime tre voci della sezione “Politica Monetaria”, le bande per definire il colore sono simmetriche (valori in positivo e in negativo). I dati riportati provengono dal database Thomson Reuters. Infine, la tendenza mostra la dinamica in atto e viene rappresentata dalle frecce: ↑,↓, ↔  indicano rispettivamente miglioramento, peggioramento, stabilità.

Disclaimer: Le informazioni contenute in questa pagina sono esclusivamente a scopo informativo e per uso personale. Le informazioni possono essere modificate da finriskalert.it in qualsiasi momento e senza preavviso. Finriskalert.it non può fornire alcuna garanzia in merito all’affidabilità, completezza, esattezza ed attualità dei dati riportati e, pertanto, non assume alcuna responsabilità per qualsiasi danno legato all’uso, proprio o improprio delle informazioni contenute in questa pagina. I contenuti presenti in questa pagina non devono in alcun modo essere intesi come consigli finanziari, economici, giuridici, fiscali o di altra natura e nessuna decisione d’investimento o qualsiasi altra decisione deve essere presa unicamente sulla base di questi dati.

FSB: Cyber Lexicon Consultative Document

Lug 07 2018

The Financial Stability Board (FSB) launched a draft version of a Cyber Lexicon that is intended to support the work of the FSB and others to address financial sector cyber resilience. This consultation seeks input on a draft Cyber Lexicon which comprises a set of 50 core terms related to cyber security and cyber resilience in the financial sector.

The Cyber Lexicon is intended to support the work of the FSB, standard-setting bodies, authorities and private sector participants, e.g. financial institutions and international standards organisations. A lexicon could be useful to support work in the following areas:

  • Cross-sector common understanding of relevant cyber security and cyber resilience terminology;
  • Work to assess and monitor financial stability risks of cyber risk scenarios;
  • Information sharing as appropriate; and
  • Work by the FSB and/or standard-setting bodies to provide guidance related to cyber security and cyber resilience, including identifying effective practices.

The FSB developed the lexicon in response to a request from G20 Finance Ministers and Central Bank Governors at their October 2017 meeting.

The FSB delivered a stocktake report to that meeting on existing publicly available regulations and supervisory practices with respect to cyber security in the financial sector.

Ministers and Governors asked that the FSB continue its work to protect financial stability against the malicious use of Information and Communication Technologies, noting that this work could be supported by a common lexicon of terms that are important in the work.

Cyber Lexicon – Consultative Document (PDF)

BIS: Financial stability implications of a prolonged period of low interest rates

Lug 07 2018

The Committee on the Global Financial System (CGFS) mandated a Working Group co-chaired by Ulrich Bindseil (European Central Bank) and Steven B Kamin (Federal Reserve Board of Governors) to identify and provide evidence for the channels through which a “low-for-long” scenario might affect financial stability, focusing on the impact of low rates on banks and on insurance companies and private pension funds (ICPFs).

Interest rates have been low in the aftermath of the Global Financial Crisis, raising concerns about financial stability. In particular, the profitability and strength of financial firms may suffer in an environment of prolonged low interest rates. Additional vulnerabilities may arise if financial firms respond to “low-for-long” interest rates by increasing risk-taking. The study resulted in a report which presents the Group’s conclusions about whether prolonged low rates induce fragility in the financial system because of repercussions on banks and ICPFs.

The first message is that while banks should generally be able to cope with solvency challenges in a low-for-long scenario, ICPFs would do less well. Banks can undertake a number of adjustments to shield profitability from low rates, whereas ICPFs are characterised by negative duration gaps that make them vulnerable to falling interest rates.

The second message is that even though the Working Group identified only a relatively limited amount of additional risk-taking by banks and ICPFs in response to low rates, a low-for-long scenario could still engender material risks to financial stability.

For example, even in the absence of greater risk-taking, a future snapback in interest rates could be challenging for financial institutions. Banks without sufficient capital buffers could face solvency issues, driven by both valuation and credit losses. ICPFs, instead, could face liquidity problems, driven either by additional collateral demands linked to losses on derivative positions or by spikes in early liquidations.

The adjustment of financial firms to a low interest rate environment warrants further investigation, especially when low rates are associated with a generalised overvaluation of risky assets. I hope that this reports provides both a sound rationale for ongoing monitoring efforts and a useful starting point for future analysis.

Financial stability implications of a prolonged period of low interest rates (PDF)

G-SIB: revised assessment methodology and the higher loss absorbency requirement

Lug 07 2018

The Basel Committee on Banking Supervision published today the Global systemically important banks: revised assessment methodology and the higher loss absorbency requirement. The revised methodology is expected to be implemented in member jurisdictions by 2021.

The Committee has reconfirmed the fundamental structure of the global systemically important bank (G-SIB) framework. The framework is meeting its primary objective of requiring G-SIBs to hold higher capital buffers and providing incentives for such firms to reduce their systemic importance.

The decision to maintain the core elements of the G-SIB framework will further contribute to the stability of the regulatory environment after the recent finalisation of the Basel IIII post-crisis reforms.

The Committee agreed to the following enhancements to the G-SIB framework:

  • Amending the definition of cross-jurisdictional indicators consistent with the definition of BIS consolidated statistics;
  • Introducing a trading volume indicator and modifying the weights in the substitutability category;
  • Extending the scope of consolidation to insurance subsidiaries;
  • Revising the disclosure requirements;
  • Providing further guidance on bucket migration and associated higher loss absorbency (HLA) surcharge when a G-SIB moves to a lower bucket; and
  • Adopting a transitional schedule for the implementation of these enhancements to the G-SIB framework.

The Committee also reconfirmed the importance of the three-year review cycle. In particular, the Committee will pay attention to alternative methodologies for the substitutability category, so as to allow the cap to be removed at that time.


Global systemically important banks: revised assessment methodology and the higher loss absorbency requirement (PDF)

Decisions taken by the Governing Council of the ECB

Lug 07 2018

Monetary policy:

Non-standard monetary policy measures

On 14 June 2018 the Governing Council decided that net purchases under the asset purchase programme (APP) would continue at the current monthly pace of €30 billion until the end of September 2018 and announced that it anticipated that, after that date – and subject to incoming data confirming the Governing Council’s medium-term inflation outlook – the monthly pace of net asset purchases would be reduced to €15 billion until the end of December 2018, and that net purchases would then end. The Governing Council also announced its intention to maintain its policy of reinvesting the principal payments from maturing securities purchased under the APP for an extended period of time after the end of the net asset purchases, and in any case for as long as necessary to maintain favourable liquidity conditions and an ample degree of monetary accommodation. More detailed information on the background to these decisions can be found in the introductory statement available on the ECB’s website and in the press release published on that day.

Market operations:

Methodology for calculating the euro short-term rate (ESTER)

On 25 June 2018 the Governing Council approved the methodology for calculating the euro short-term rate (ESTER) – the overnight unsecured rate based entirely on money market statistical reporting (MMSR) – publication of which will begin by October 2019. The Governing Council also decided to release, before then, historical daily rate, volume and dispersion data based on the main methodological features of ESTER. The methodology and a related press release are available on the ECB’s website.

Financial stability and supervision:

Eurosystem response to ESMA consultation on securitisation transparency requirements

On 18 May 2018 the Governing Council approved the Eurosystem’s response to the European Securities and Markets Authority (ESMA) consultation on application requirements for securitisation repositories. The Eurosystem’s response expresses support for ESMA’s goals of transparency in the securitisation market and a pivotal role for securitisation repositories in fostering transparency as collectors and centralisers of data. The Eurosystem’s response to the ESMA consultation is available on the ECB’s website.

Market infrastructure and payments:

Updated Eurosystem assessment methodology for payment systems

On 7 June 2018 the Governing Council approved an updated version of the Eurosystem assessment methodology for payment systems and authorised its publication on the ECB’s website. The methodology initially approved in 2014 has been updated to take into account the requirements introduced by the revised ECB Regulation on oversight requirements for systemically important payment systems (or “SIPS Regulation”) which entered into force in December 2017. It also includes references to the Eurosystem’s Cyber Resilience Oversight Expectations, which are based on the CPMI-IOSCO Guidance on cyber resilience for financial market infrastructures published in June 2016. The updated methodology is available on the ECB’s website.

Amended TARGET2-Securities pricing policy

On 21 June 2018 the Governing Council approved a change to the TARGET2-Securities (T2S) pricing policy whereby the settlement fee for a delivery versus payment (DvP) instruction will increase from 15 euro cents to 23.5 euro cents as from 1 January 2019. This adjustment reflects the current T2S revenue and costs position, in particular the extension of the cost-recovery period, updated projections on growth in volumes and evolution of operational costs, and additional costs related to enhancing T2S’s cyber resilience. As for the pricing structure approved in 2010 and the fees for information services, these remain unchanged. More detailed information on the pricing policy and financial situation of T2S can be found on the ECB’s website.

Advice on legislation:

ECB Opinion on the establishment of a framework for the security of network and information systems of general interest in Belgium

On 18 May 2018 the Governing Council adopted Opinion CON/2018/27 at the request of the Belgian Minister for Finance.

ECB Opinion on various financial law provisions in Belgium

On 8 June 2018 the Governing Council adopted Opinion CON/2018/29 at the request of the Belgian Minister for Finance.

ECB Opinion on mortgage amortisation requirements in Sweden

On 15 June 2018 the Governing Council adopted Opinion CON/2018/30 at the request of Finansinspektionen (the Swedish financial supervisory authority).

Corporate governance:

ECB Recommendation to the Council of the European Union on the external auditors of Lietuvos bankas

On 18 May 2018 the Governing Council adopted Recommendation ECB/2018/15 to the Council of the European Union on the external auditors of Lietuvos bankas. The Recommendation has been published in the Official Journal of the European Union and on the ECB’s website.

Statistics:

New ECB Guideline on the Register of Institutions and Affiliates Data and amended Guideline on monetary and financial statistics

On 1 June 2018 the Governing Council adopted Guideline (EU) 2018/876 on the Register of Institutions and Affiliates Data (ECB/2018/16) or “RIAD”, the shared dataset of reference data on legal and other statistical institutional units. On the same day, the Governing Council also adopted Guideline (EU) 2018/877 amending Guideline ECB/2014/15 on monetary and financial statistics (ECB/2018/17). The new ECB Guideline on RIAD provides details on the obligations of national central banks (NCBs) to report to the ECB reference data on entities, as well as on obligations related to the maintenance and quality management of such information. To ensure legal certainty and clarity, all rules and procedures specifying how NCBs report the required data to the ECB using RIAD have been deleted from the ECB Guideline amending Guideline ECB/2014/15. Both ECB Guidelines are available on the ECB’s website.

ESCB Statistics Committee’s annual progress report on the collection of granular credit data

On 23 May 2018 the Governing Council took note of the 2017 annual progress report on the preparatory measures for the long-term framework for the collection of granular credit data, prepared in accordance with Article 3(2) of Decision ECB/2014/6 on the organisation of preparatory measures for the collection of granular credit data by the European System of Central Banks (ESCB). The report concludes that progress is ongoing and according to plan, allowing a timely start to the AnaCredit data transmission scheduled for November 2018.

International and European cooperation:

17th annual review of the international role of the euro

On 25 May 2018 the Governing Council approved the 17th annual review of the international role of the euro and authorised its publication. In line with the biennial cycle for publication of this report series decided on in 2016, this year’s release is an interim version without special features or analytical boxes. The review presents a concise overview of developments in the use of the euro by non-euro area residents and provides updated statistical information on the main indicators of the euro’s international status considered to be of interest to the general public. The report is available on the ECB’s website.

Banking supervision:

Compliance with EBA Guidelines on internal governance and Joint ESMA and EBA Guidelines on the assessment of suitability of members of the management body and key function holders

On 22 May 2018 the Governing Council did not object to two proposals by the Supervisory Board to notify that, for the significant institutions under its direct supervision, the ECB complies with the European Banking Authority (EBA) Guidelines on internal governance (EBA/GL/2017/11), as well as with the Joint ESMA and EBA Guidelines on the assessment of the suitability of members of the management body and key function holders (EBA/GL/2017/12). The notifications – addressed, respectively, to the EBA and to ESMA and the EBA jointly – clarify that the ECB’s compliance is to be interpreted as operating within the limits of, and without prejudice to, national provisions implementing the CRD IV. To ensure full compliance with these Joint ESMA and EBA Guidelines, the ECB has implemented changes to its policies on fit and proper assessments and has updated its Guide to fit and proper assessments accordingly.

Compliance with EBA Guidelines on probability-of-default (PD) estimation, loss-given-default (LGD) estimation and the treatment of defaulted exposures

On 20 June 2018 the Governing Council did not object to a proposal by the Supervisory Board to notify the EBA that, for the significant institutions under its direct supervision, the ECB will comply with the EBA Guidelines on probability-of-default (PD) estimation, loss-given-default (LGD) estimation and the treatment of defaulted exposures (EBA/GL/2017/16) as from the date they become applicable, which is currently specified by the EBA to be 1 January 2021. The guidelines are one of the initiatives undertaken by the EBA to reduce unjustified variability of risk parameters and own funds requirements, and are part of a broader review of the internal ratings-based (IRB) approach being carried out by the EBA.

Compliance with EBA Recommendations on outsourcing to cloud service providers

On 20 June 2018 the Governing Council did not object to a proposal by the Supervisory Board to notify the EBA that, for the significant institutions under its direct supervision, the ECB intends to comply with the EBA Recommendations on outsourcing to cloud service providers (EBA/REC/2017/03) by the end of 2018. These recommendations, addressed to credit institutions and investment firms, as well as to competent authorities, aim to clarify how the principles of the Guidelines on outsourcing published by the Committee of European Banking Supervisors (CEBS) in 2006 should be interpreted when outsourcing to cloud service providers, and stipulate how certain of these principles should be observed.

Publication of booklet on SREP methodology for less significant institutions

On 25 June 2018 the Governing Council did not object to a proposal by the Supervisory Board to publish the booklet on SREP methodology for less significant institutions (LSIs). This booklet, which provides a high-level overview of the SREP methodology for LSIs, will be published in due course on the ECB’s banking supervision website.

Curva dei rendimenti invertita? Questione di aspettative
di Cosimo Zangari e Federico Bartolozzi

Lug 07 2018
Curva dei rendimenti invertita? Questione di aspettative  di Cosimo Zangari e Federico Bartolozzi

«Thanks to Fed, an Inverted Yiled Curve is imminent» titolava, con toni allarmistici, pochi giorni fa un articolo di Brian Chappatta su Bloomberg [1], a seguito della recente decisione del FED Open Market Committee – FOMC – di rivedere al rialzo i tassi a breve [2].

La paura di un’inversione della curva non è tema nuovo oltreoceano; già in passato, al meeting di Dicembre 2017 del FOMC, Evans e Kashkari votarono contro un rialzo dei tassi proprio per timori legati a questa eventualità.

Che cos’è che spaventa in una curva dei rendimenti invertita? Ma soprattutto, quali sono le dinamiche dietro la sua formazione?

Con curva dei rendimenti (risk-free) invertita s’intende una situazione di mercato in cui i rendimenti offerti, per scadenze più lunghe, sono minori rispetto ai rendimenti della parte a breve della curva (in questo caso solitamente si considera il “breve” come i tassi fino a 2 anni). Si tratta di una situazione a prima vista contro-intuitiva. Chi ha studiato Finanza ricorderà certamente il mantra per cui 1 euro oggi è meglio di 1 euro domani; una curva invertita, invece, dice esattamente l’opposto: meglio 1 euro domani. Questo comporta che gli investitori, in media, si orientino verso investimenti di lungo periodo, nonostante i rendimenti inferiori agli investimenti di breve.

A questo punto una domanda sorge spontanea: quali sono i drivers che spingono l’investitore ad accettare tempi più lunghi per il rientro del proprio capitale nonostante il minor rendimento?

Per rispondere a questa domanda mettiamoci nei panni di un investitore che abbia una disponibilità e un orizzonte di investimento di 10 anni. Egli può, idealmente, comprare direttamente un bond decennale, accettando il rendimento implicito [3] o investire di anno in anno in un bond annuale (facendo il così detto rolling).

La prima strategia d’investimento non presenta alcun elemento di aleatorietà, poiché l’investitore non deve far altro che mettere il suo capitale nel bond al tempo iniziale (t = 0) e riscuotere a scadenza(in questo caso t = 10). La seconda strategia d’investimento, invece, ha un risultato incognito dato dal fatto che i tassi futuri con scadenza un anno non sono noti al tempo in cui si inizia la strategia.

La scelta fra le due sarà dunque guidata dalle aspettative che l’investitore elabora sulla futura evoluzione dei tassi ad un anno. Se l’investitore si aspetta un rialzo futuro dei tassi ad un anno, egli preferirà investire nella strategia di rolling, in modo da poter investire a scadenza (t = 1) il proprio capitale in titoli con rendimento maggiore (sempre che l’aspettativa si realizzi). In caso di aspettative ribassiste, invece, un investitore razionale sarà più propenso ad immobilizzare il proprio capitale direttamente nel bond decennale.

Un po’ come accade nella scelta di un mutuo: se l’aspettativa è quella di un ribasso dei tassi è buona norma scegliere un mutuo a tasso variabile, altrimenti si opta per un tasso fisso. Nel nostro esempio il bond decennale ricopre il ruolo del mutuo a tasso fisso, in quanto ci permette di bloccare il rendimento in maniera sicura, mentre la strategia di rolling è paragonabile al mutuo a tasso variabile.

Estendendo il ragionamento alla generalità degli investitori è facile intuire che i rendimenti delle due strategie (uno certo, l’altro atteso) devono tendere, in equilibrio, ad equivalersi. Se così non fosse gli investitori avrebbero tutto l’incentivo a spostare il proprio capitale da una strategia all’altra.

In sostanza, denotando con l’aspettativa al tempo zero del tasso annuale futuro al tempo t, si può supporre che in equilibrio:

dove l’argomento a sinistra dell’uguale rappresenta il rendimento (atteso) dalla strategia di rolling, mentre l’argomento a destra rappresenta il rendimento (certo) dato dall’investire tutto e subito nel bond decennale.

Affinché nel mercato si realizzi una curva invertita, bisogna che le aspettative degli agenti di mercato siano tali che l’uguaglianza si trasformi, temporaneamente, in una disuguaglianza:

In tal caso la maggioranza degli investitori è spinta a investire nel bond a 10 anni piuttosto che nella strategia di rolling: questa, come si vede dalla disuguaglianza, restituisce infatti un rendimento complessivo inferiore.

Una maggiore domanda orientata verso il bond decennale porta ad un incremento del suo prezzo e conseguentemente ad una riduzione del suo rendimento, fintanto che l’uguaglianza non è ristabilita per un tasso più basso. Se questa diminuzione è consistente, il risultato ottenuto è un’inversione della curva.

La condizione che determina il crearsi di tale disequilibrio, e di conseguenza l’inversione della curva, è essenzialmente una: l’affermarsi di un’aspettativa ribassista sui tassi a breve futuri.

Ma come si genera un’aspettativa dominante di tassi a breve in declino? La risposta sembra essere un’altra aspettativa: quella di una recessione economica. La prima reazione da parte delle banche centrali ad una recessione è infatti, da sempre, l’abbassamento dei tassi a breve. Di conseguenza, un’aspettativa di recessione si traduce in un’aspettativa di tassi a breve futuri minori, ovvero nella disuguaglianza che origina l’inversione della curva.

Ma cosa provoca allora la diffusione di questa seconda aspettativa di recessione economica? La risposta sta nell’azione della Fed, come citato a inizio articolo. Qualora l’azione delle banche centrali di alzare i tassi a breve venga mal percepita dal mercato, questa sarà la premessa logica per un’aspettativa di caduta in recessione nel futuro (cui seguono tassi bassi futuri per contrastare la recessione). Una curva invertita è dunque conseguenza dell’azione di una banca centrale che alza i tassi a breve termine (facendo dunque salire la parte sinistra della curva) e di un’interpretazione del mercato che porta la parte lunga della curva a scendere sotto il livello della parte a breve.

Ricapitolando: da un’azione della FED, ritenuta sbagliata o “precoce” dalla maggior parte degli operatori, può generarsi un’aspettativa di recessione futura, che si traduce a sua volta in un’aspettativa di tassi a breve futuri in ribasso. Tutto ciò finisce per incrementare la domanda rivolta ai bond di lungo termine con conseguente abbassamento dei rendimenti di lungo termine sotto quelli di breve.

Proprio a causa di questo forte nesso logico, l’inversione della curva è sovente usata in letteratura come predittore di crisi economiche. Basti pensare che le ultime sette recessioni economiche sono tutte state precedute da un’inversione della curva.

Estrella e Mishkin (1996) utilizzano un semplice approccio di regressione probit per stimare la probabilità di recessione 12 mesi avanti usando lo spread nei rendimenti a 10 anni e 3 mesi.

Al 22 Giugno 2018 lo spread 10Y-3M sulla curva americana è di 97 bps, quindi ancora in una sorta di confort zone, se ci basiamo sulla tabella di Estrella e Mishkin. Tuttavia ciò che conta spesso in Economia è anche la dinamica del fenomeno che, come si vede dalla Figura 2, è caratterizzata da un trend in netto peggioramento.


Note:

[1] https://www.bloomberg.com/view/articles/2018-06-13/fed-decision-an-inverted-yield-curve-is-imminent

[2] Federal Fund Rates e Discount Rates

[3] il pedice rappresenta il momento temporale di riferimento a cui è definito il tasso di rendimento, l’argomento fra parentesi rappresenta la maturity dell’investimento.

Il termometro dei mercati finanziari (6 luglio 2018)
a cura di Emilio Barucci e Daniele Marazzina

Lug 07 2018
Il termometro dei mercati finanziari (6 luglio 2018)  a cura di Emilio Barucci e Daniele Marazzina

Continua l’iniziativa di Finriskalert.it “Il termometro dei mercati finanziari”. Questa rubrica vuole presentare un indicatore settimanale sul grado di turbolenza/tensione dei mercati finanziari con particolare attenzione all’Italia.

Significato degli indicatori

  • Rendimento borsa italiana: rendimento settimanale dell’indice della borsa italiana FTSEMIB;
  • Volatilità implicita borsa italiana: volatilità implicita calcolata considerando le opzioni at-the-money sul FTSEMIB a 3 mesi;
  • Future borsa italiana: valore del future sul FTSEMIB;
  • CDS principali banche 10Ysub: CDS medio delle obbligazioni subordinate a 10 anni delle principali banche italiane (Unicredit, Intesa San Paolo, MPS, Banco BPM);
  • Tasso di interesse ITA 2Y: tasso di interesse costruito sulla curva dei BTP con scadenza a due anni;
  • Spread ITA 10Y/2Y : differenza del tasso di interesse dei BTP a 10 anni e a 2 anni;
  • Rendimento borsa europea: rendimento settimanale dell’indice delle borse europee Eurostoxx;
  • Volatilità implicita borsa europea: volatilità implicita calcolata sulle opzioni at-the-money sull’indice Eurostoxx a scadenza 3 mesi;
  • Rendimento borsa ITA/Europa: differenza tra il rendimento settimanale della borsa italiana e quello delle borse europee, calcolato sugli indici FTSEMIB e Eurostoxx;
  • Spread ITA/GER: differenza tra i tassi di interesse italiani e tedeschi a 10 anni;
  • Spread EU/GER: differenza media tra i tassi di interesse dei principali paesi europei (Francia, Belgio, Spagna, Italia, Olanda) e quelli tedeschi a 10 anni;
  • Euro/dollaro: tasso di cambio euro/dollaro;
  • Spread US/GER 10Y: spread tra i tassi di interesse degli Stati Uniti e quelli tedeschi con scadenza 10 anni;
  • Prezzo Oro: quotazione dell’oro (in USD)
  • Spread 10Y/2Y Euro Swap Curve: differenza del tasso della curva EURO ZONE IRS 3M a 10Y e 2Y;
  • Euribor 6M: tasso euribor a 6 mesi.

I colori sono assegnati in un’ottica VaR: se il valore riportato è superiore (inferiore) al quantile al 15%, il colore utilizzato è l’arancione. Se il valore riportato è superiore (inferiore) al quantile al 5% il colore utilizzato è il rosso. La banda (verso l’alto o verso il basso) viene selezionata, a seconda dell’indicatore, nella direzione dell’instabilità del mercato. I quantili vengono ricostruiti prendendo la serie storica di un anno di osservazioni: ad esempio, un valore in una casella rossa significa che appartiene al 5% dei valori meno positivi riscontrati nell’ultimo anno. Per le prime tre voci della sezione “Politica Monetaria”, le bande per definire il colore sono simmetriche (valori in positivo e in negativo). I dati riportati provengono dal database Thomson Reuters. Infine, la tendenza mostra la dinamica in atto e viene rappresentata dalle frecce: ↑,↓, ↔  indicano rispettivamente miglioramento, peggioramento, stabilità.

Disclaimer: Le informazioni contenute in questa pagina sono esclusivamente a scopo informativo e per uso personale. Le informazioni possono essere modificate da finriskalert.it in qualsiasi momento e senza preavviso. Finriskalert.it non può fornire alcuna garanzia in merito all’affidabilità, completezza, esattezza ed attualità dei dati riportati e, pertanto, non assume alcuna responsabilità per qualsiasi danno legato all’uso, proprio o improprio delle informazioni contenute in questa pagina. I contenuti presenti in questa pagina non devono in alcun modo essere intesi come consigli finanziari, economici, giuridici, fiscali o di altra natura e nessuna decisione d’investimento o qualsiasi altra decisione deve essere presa unicamente sulla base di questi dati.

ECB: methodology for calculating Euro Short-Term Rate (ESTER)

Giu 29 2018

The Governing Council of the European Central Bank (ECB) has decided on the final methodology for calculating the Euro Short-Term Rate (ESTER) – an overnight unsecured rate based entirely on money market statistical reporting (MMSR), which will start to be published by October 2019. We report here the main features of ESTER computation; the complete methodology can be found on the ECB website (see link below).

ESTER is exclusively based on borrowing transactions in euro conducted with financial counterparties that banks report in accordance with EU Regulation (MMSR Regulation)

ESTER is calculated using overnight unsecured fixed rate deposit transactions over €1 million. Unsecured deposits are standardised and are the most frequent means of conducting arm’s length transactions on the basis of a competitive
procedure, thereby limiting idiosyncratic factors potentially influencing the volatility of the rate.

ESTER is calculated for each TARGET2 day as a volume-weighted trimmed mean rounded to the third decimal. The volume-weighted trimmed mean is calculated by:

  1. ordering transactions from the lowest rate to the highest rate;
  2. aggregating the transactions occurring at each rate level;
  3. removing the top and bottom 25% in volume terms; and
  4. calculating the mean of the remaining 50% of the volume-weighted distribution of rates

A pro rata calculation is applied to volumes that span the thresholds for trimming to ensure that exactly 50% of the total eligible volume is used in the calculation of the volume-weighted mean.

The ECB publishes ESTER with three decimal places no later than 09:00 CET on the next TARGET2 business day. Together with ESTER, the following related information is published:

  • total nominal value of transactions before trimming in EUR millions;
  • number of banks reporting transactions before trimming;
  • number of transactions before trimming;
  • percentage of total nominal amount reported by the five largest contributing banks that day, as a whole number;
  • calculation method: normal or contingency;
  • rates at the 25th and 75th percentiles with two decimal places.

ECB: ESTER Methodology (PDF)

FSB Europe: recovery and resolution, interest rate benchs and market-based finance

Giu 29 2018

The Financial Stability Board (FSB) Regional Consultative Group (RCG) for Europe met in Florence today. RCG members began by discussing current financial vulnerabilities, including global and regional macroeconomic and financial market developments.

Members received an update on the work of the FSB, including the outcomes of the FSB’s recent Plenary meeting. The FSB’s 2018 workplan focuses on:

  • monitoring the financial system to identify emerging risks, including those related to crypto-assets;
  • completing the G20’s financial reform priorities;
  • evaluating policies that have been implemented to ensure the reform programme is efficient, coherent, effective and addressing any unintended consequences
  • optimising how the FSB works to maximise its effectiveness.

Interest-rate benchmarks in individual jurisdictions within the RCG Europe were the next topic for discussion. Members of the group discussed the reforms put in place across Europe. Members discussed the implementation of EU benchmark legislation and the issues authorities face to ensure the transparency, reliability and improved governance and supervision of benchmark rates.

Members then discussed progress in work to transform shadow banking into resilient market-based finance. Members noted that market-based finance provides a valuable alternative to bank funding and helps to support real economic activity, but it may also pose risks for financial stability.

European authorities are currently developing legislation to implement the FSB’s standard on Total Loss-Absorbing Capacity that is designed to ensure that a failing bank has sufficient loss-absorbing and recapitalisation capacity available.