La letteratura economica ha posto un focus maggiore sui problemi connessi con il rischio di credito, ponendo dall’altro lato una minore attenzione al rischio di mercato. Al riguardo va anche ricordato che il primo Accordo di Basilea si focalizzava esclusivamente sulla prima tipologia di rischio. Seguendo questa linea di pensiero, la vigilanza bancaria europea si è concentrata maggiormente sull’analisi del rischio di credito e sulle sue determinanti, con particolare interesse ai non-performing loan (NPL).
Esemplificative sono le dichiarazioni di Danièle Nouy, presidente del consiglio di vigilanza della BCE, di fronte al Parlamento Europeo: “Level 2 and Level 3 positions consist, to a large degree, of hedging and client-related transactions providing financial services to the real economy and satisfying a demand from various economic agents”. In altri termini, i rischi sottesi da queste forme di attività finanziaria non sono ritenuti eccessivi. Ma qual è il giudizio dei mercati al riguardo?
Una possibile risposta è stata fornita nel Rapporto Banche CER 1/2018. Per misurare il grado di rischio di una banca è stato considerato un indicatore molto diffuso nella letteratura economica, ovvero lo Z-score. Quest’indice misura quanto una banca è distante dal default. Ciò che si nota, nel periodo compreso tra il 2001 e il 2016, è che le banche che appartengono al cluster a basso rischio hanno, sia nel periodo pre-crisi che post-crisi, una maggior concentrazione delle loro attività nel tradizionale business creditizio, mentre di converso hanno una minore incidenza delle attività finanziarie (tavola 1). Le banche con rischio medio sono invece quelle meno attive sul credito e più propense ad investire in attività finanziarie, anche con finalità di trading. Le banche ad alto rischio si situano a metà degli altri due cluster per quanto riguarda la specializzazione sul mercato del credito e la dotazione del portafoglio finanziario. Rispetto agli altri due gruppi, però, l’incidenza dei non-performing loan è ben più elevata, sia nel periodo pre-crisi sia ancor più nel post-crisi.
Tavola 1. Banche europee quotate (distribuzione del rischio in base al modello di business)
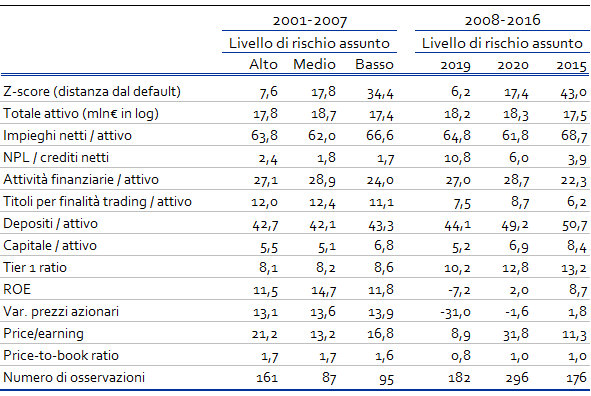
Note: cluster analysis basata sui valori mediani.
Fonte: elaborazioni CER su dati Thomson-Reuters.
Da questa prima analisi emerge, quindi, come problemi sulla stabilità finanziaria delle banche possono nascere anche, e soprattutto, dal rischio di mercato e non prevalentemente dal rischio di credito.
Tra le attività finanziarie che possono determinare elevati rischi per le banche europee ci sono le cosiddette attività di 2° e 3° livello (level 2 e 3 asset), tipologie di attività finanziarie caratterizzate da una forte opacità e complessità. I level 2 e 3 asset non possono infatti essere valutati direttamente osservando prezzi di mercato ma il loro valore deve essere desunto analizzando l’andamento di asset similari e/o mediante l’utilizzo di articolati modelli interni di autovalutazione. Guardando ai dati raccolti da Mediobanca relativamente alle banche europee di maggior dimensione, emerge come Deutsche Bank sia la banca con maggiore presenza di level 2 e 3 asset in portafoglio (42% del totale attivo nel 2016). Seguono RBS, e Barclays. Le banche italiane non sono particolarmente propense ad investire in strumenti finanziari complessi. Sia Unicredit che Intesa-SanPaolo ne detengono un percentuale sul totale attivo tra le più basse del campione.
Le banche europee hanno continuato ad investire in titoli finanziari speculativi. Le attività complesse hanno infatti permesso di generare un risultato positivo dal trading, ma non tale da compensare la flessione del margine d’interesse. Il risultato finale è dunque una perdita di redditività per le banche che hanno investito in attività finanziarie speculative.
L’approccio tenuto dalle grandi banche europee, soprattutto francesi e tedesche, non è stato difforme da quello intrapreso nel periodo pre-crisi, con una sola importante differenza. Se nel periodo pre-crisi la speculazione finanziaria, attuata prevalentemente dalle banche americane, aveva lo scopo di accrescere oltremisura le fonti di reddito, e conseguentemente i bonus dei manager bancari, nel periodo più recente gli investimenti in attività finanziarie ad alto rischio hanno lo scopo di limitare la caduta del conto economico. In altri termini, se in passato era una speculazione “aggressiva”, ad oggi invece constatiamo una speculazione “difensiva”, volta cioè a far fronte ai bassi tassi d’interesse e a contrastare la concorrenza del fintech.
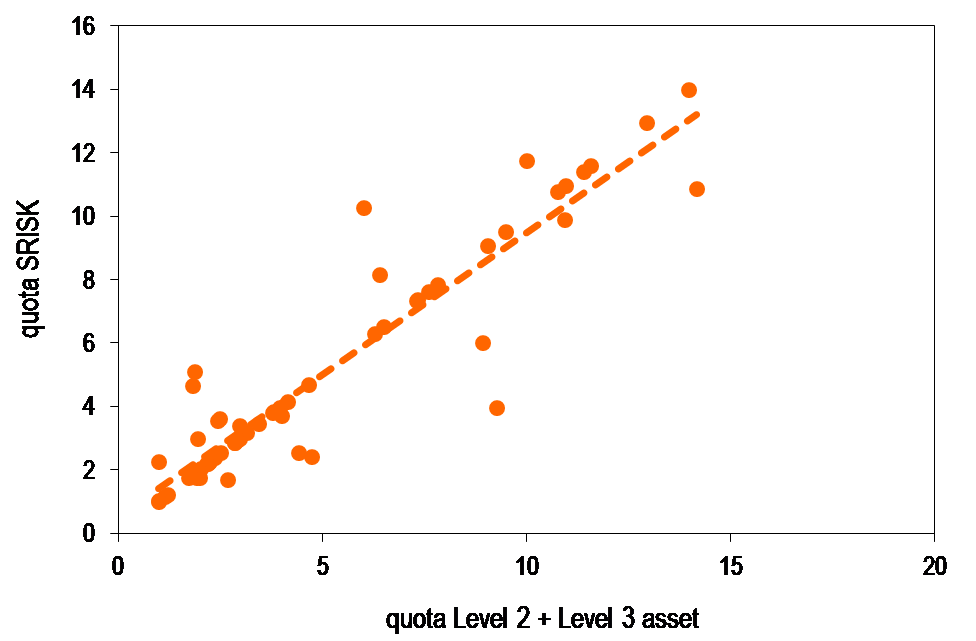
A livello sistemico questo approccio sta contribuendo all’instabilità finanziaria globale. Una misura del rischio sistemico è offerta dalla New York University Stern Volatility Lab attraverso l’SRISK, un indicatore che misura l’ammontare di capitale richiesto dalle società quotate per far fronte ad uno scenario di stress che prevede una riduzione del 40%, nell’arco di 6 mesi, dei mercati finanziari globali. Analizzando la relazione tra attività rischiose, connesse alla finanza e al credito, con l’SRISK si riscontra che il maggior contributo all’instabilità finanziaria globale è correlato al rischio di mercato. L’incidenza dei non-performing loan non sembra invece avere effetti di rilievo sul rischio sistemico (grafico 1).
Grafico 1. Rischio sistemico, asset finanziari complessi e NPL (dati relativi al periodo 2014-2016)
 |
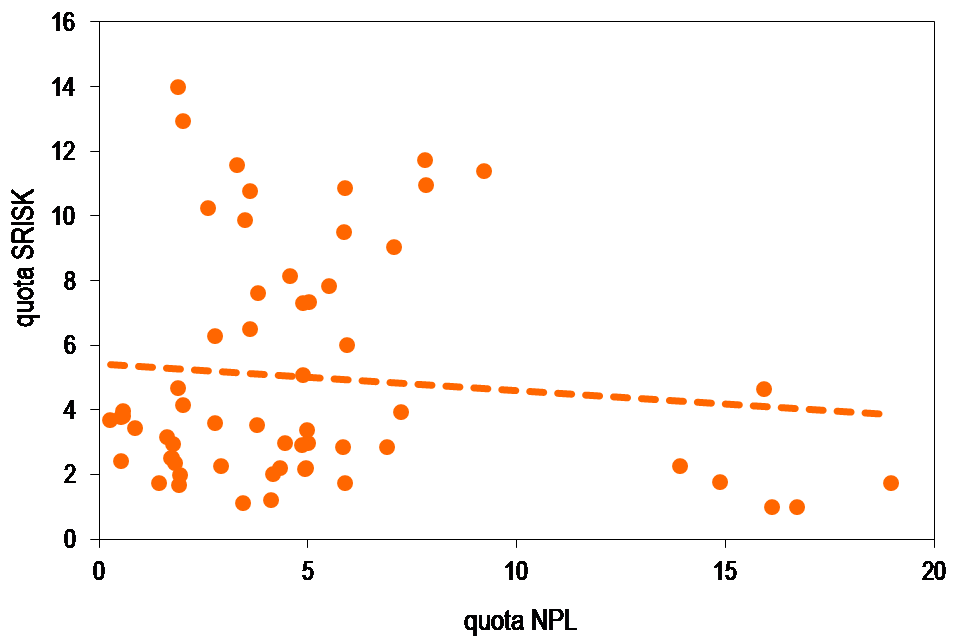 |
Note: campione delle prime 20 banche significative in Europa. Dati espressi in % del totale campione.
Fonte: elaborazioni CER su dati Mediobanca.
La sottovalutazione del rischio di mercato potrebbe avere effetti rilevanti sul sistema finanziario. Il maggior rischio sistemico non spinge infatti i manager bancari a detenere più capitale, anzi avviene paradossalmente l’esatto contrario: chi ha più rischio sistemico detiene una minore proporzione di capitale di buona qualità rispetto al totale attivo (grafico 2).
Grafico 2. Rischio sistemico e dotazione di capitale (dati relativi al periodo 2014-2016)
 |
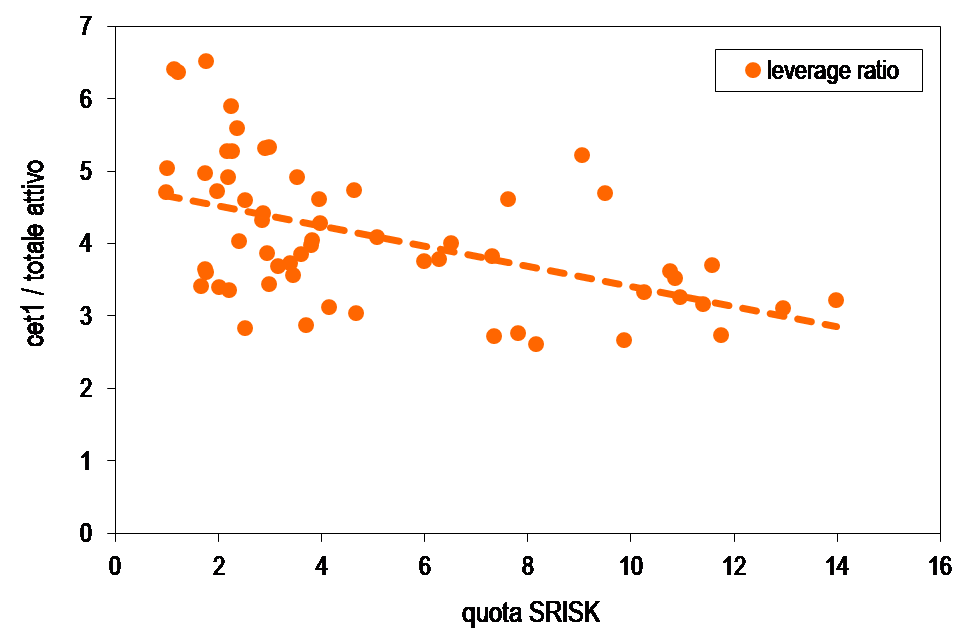 |
Note: campione delle prime 20 banche significative in Europa. SRISK espresso in % del totale campione.
Fonte: elaborazioni CER su dati Mediobanca.
Questo contesto dovrebbe destare ancor più preoccupazione se si considera che i mercati finanziari internazionali stanno segnalando da diverso tempo la presenza di un certo surriscaldamento. Tra le diverse concause possono citarsi l’aggressiva politica commerciale di Trump, l’inversione dell’intonazione delle politiche monetarie, l’eccessivo ricorso al debito da parte dei paesi emergenti (soprattutto attraverso il canale dello shadow banking system) e, da ultimo, i timori legati all’Italexit, ovvero l’uscita dell’Italia dall’Area euro.
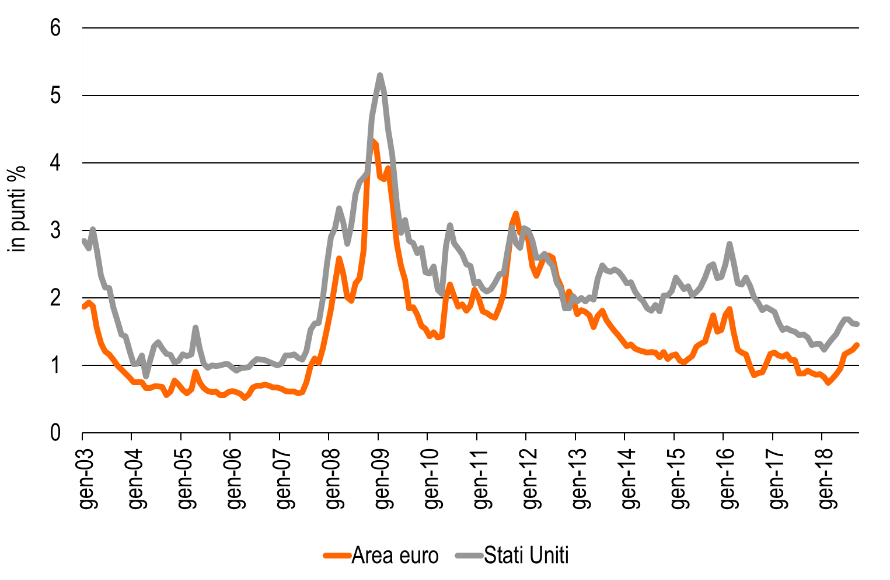
Guardando alla volatilità di Borsa negli Stati Uniti e nell’Area euro si nota come questa sia ancora contenuta, attestandosi su livelli osservati nella fase precedente alla crisi del 2007-2008, ma come allo stesso tempo segnali da alcuni mesi una forte tendenza crescente (grafico 3). Anche lo spread tra i corporate bond con rating BBB e i titoli governativi da indicazioni analoghe, con livelli storicamente molto bassi sia negli Usa che in Europa ma con una rapida inversione di tendenza nel periodo recente (grafico 4).
Grafico 3. Volatilità di Borsa
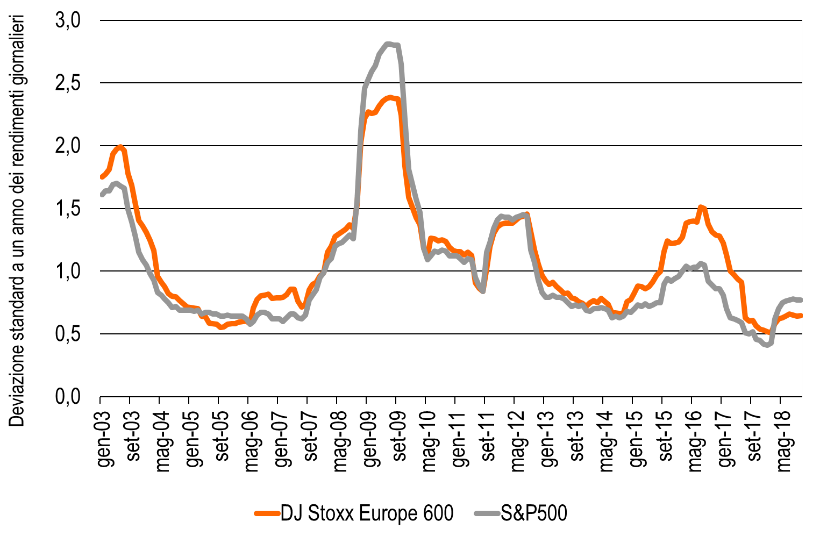
Fonte: elaborazioni CER su dati Thomson-Reuters.
Grafico 4. Spread tra i rendimenti dei corporate bond con rating BBB e dei titoli governativi
Fonte: elaborazioni CER su dati Thomson-Reuters.
In definitiva, aver trascurato il rischio di mercato, focalizzandosi prevalentemente su quello di credito, potrebbe nuovamente rivelarsi un problema per la stabilità finanziaria. Data l’insufficiente dotazione di capitale delle banche più esposte con le attività finanziarie, soprattutto se misurata attraverso coefficienti di patrimonializzazione non manipolabili (si veda Barucci e Milani, 2018), in caso di crisi sarebbe inevitabile chiedere nuovamente l’intervento degli Stati nazionali.
Bibliografia
– Barucci E., Milani C., Do European banks manipulate risk weights?, International Review of Financial Analysis, Volume 59, pp. 47-57, North-Holland, 2018.
– CER, Rapporto Banche 1/2018.