G-SIB: revised assessment methodology and the higher loss absorbency requirement

Lug 07 2018

The Basel Committee on Banking Supervision published today the Global systemically important banks: revised assessment methodology and the higher loss absorbency requirement. The revised methodology is expected to be implemented in member jurisdictions by 2021.

The Committee has reconfirmed the fundamental structure of the global systemically important bank (G-SIB) framework. The framework is meeting its primary objective of requiring G-SIBs to hold higher capital buffers and providing incentives for such firms to reduce their systemic importance.

The decision to maintain the core elements of the G-SIB framework will further contribute to the stability of the regulatory environment after the recent finalisation of the Basel IIII post-crisis reforms.

The Committee agreed to the following enhancements to the G-SIB framework:

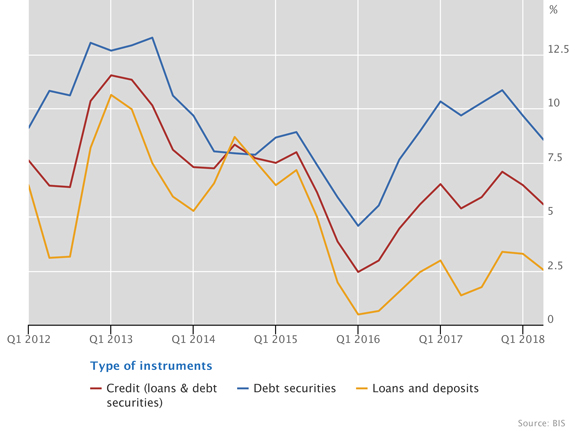
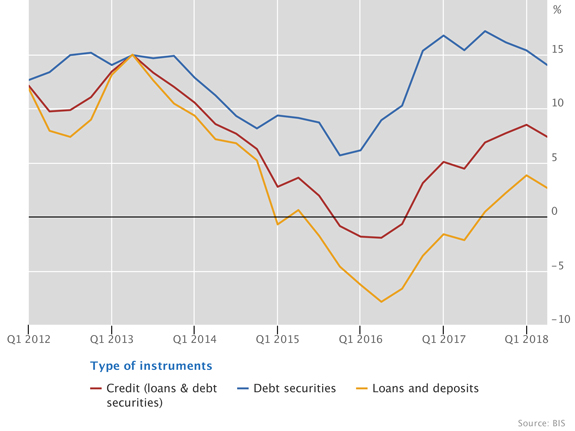
  • Amending the definition of cross-jurisdictional indicators consistent with the definition of BIS consolidated statistics;
  • Introducing a trading volume indicator and modifying the weights in the substitutability category;
  • Extending the scope of consolidation to insurance subsidiaries;
  • Revising the disclosure requirements;
  • Providing further guidance on bucket migration and associated higher loss absorbency (HLA) surcharge when a G-SIB moves to a lower bucket; and
  • Adopting a transitional schedule for the implementation of these enhancements to the G-SIB framework.

The Committee also reconfirmed the importance of the three-year review cycle. In particular, the Committee will pay attention to alternative methodologies for the substitutability category, so as to allow the cap to be removed at that time.


Global systemically important banks: revised assessment methodology and the higher loss absorbency requirement (PDF)

Decisions taken by the Governing Council of the ECB

Lug 07 2018

Monetary policy:

Non-standard monetary policy measures

On 14 June 2018 the Governing Council decided that net purchases under the asset purchase programme (APP) would continue at the current monthly pace of €30 billion until the end of September 2018 and announced that it anticipated that, after that date – and subject to incoming data confirming the Governing Council’s medium-term inflation outlook – the monthly pace of net asset purchases would be reduced to €15 billion until the end of December 2018, and that net purchases would then end. The Governing Council also announced its intention to maintain its policy of reinvesting the principal payments from maturing securities purchased under the APP for an extended period of time after the end of the net asset purchases, and in any case for as long as necessary to maintain favourable liquidity conditions and an ample degree of monetary accommodation. More detailed information on the background to these decisions can be found in the introductory statement available on the ECB’s website and in the press release published on that day.

Market operations:

Methodology for calculating the euro short-term rate (ESTER)

On 25 June 2018 the Governing Council approved the methodology for calculating the euro short-term rate (ESTER) – the overnight unsecured rate based entirely on money market statistical reporting (MMSR) – publication of which will begin by October 2019. The Governing Council also decided to release, before then, historical daily rate, volume and dispersion data based on the main methodological features of ESTER. The methodology and a related press release are available on the ECB’s website.

Financial stability and supervision:

Eurosystem response to ESMA consultation on securitisation transparency requirements

On 18 May 2018 the Governing Council approved the Eurosystem’s response to the European Securities and Markets Authority (ESMA) consultation on application requirements for securitisation repositories. The Eurosystem’s response expresses support for ESMA’s goals of transparency in the securitisation market and a pivotal role for securitisation repositories in fostering transparency as collectors and centralisers of data. The Eurosystem’s response to the ESMA consultation is available on the ECB’s website.

Market infrastructure and payments:

Updated Eurosystem assessment methodology for payment systems

On 7 June 2018 the Governing Council approved an updated version of the Eurosystem assessment methodology for payment systems and authorised its publication on the ECB’s website. The methodology initially approved in 2014 has been updated to take into account the requirements introduced by the revised ECB Regulation on oversight requirements for systemically important payment systems (or “SIPS Regulation”) which entered into force in December 2017. It also includes references to the Eurosystem’s Cyber Resilience Oversight Expectations, which are based on the CPMI-IOSCO Guidance on cyber resilience for financial market infrastructures published in June 2016. The updated methodology is available on the ECB’s website.

Amended TARGET2-Securities pricing policy

On 21 June 2018 the Governing Council approved a change to the TARGET2-Securities (T2S) pricing policy whereby the settlement fee for a delivery versus payment (DvP) instruction will increase from 15 euro cents to 23.5 euro cents as from 1 January 2019. This adjustment reflects the current T2S revenue and costs position, in particular the extension of the cost-recovery period, updated projections on growth in volumes and evolution of operational costs, and additional costs related to enhancing T2S’s cyber resilience. As for the pricing structure approved in 2010 and the fees for information services, these remain unchanged. More detailed information on the pricing policy and financial situation of T2S can be found on the ECB’s website.

Advice on legislation:

ECB Opinion on the establishment of a framework for the security of network and information systems of general interest in Belgium

On 18 May 2018 the Governing Council adopted Opinion CON/2018/27 at the request of the Belgian Minister for Finance.

ECB Opinion on various financial law provisions in Belgium

On 8 June 2018 the Governing Council adopted Opinion CON/2018/29 at the request of the Belgian Minister for Finance.

ECB Opinion on mortgage amortisation requirements in Sweden

On 15 June 2018 the Governing Council adopted Opinion CON/2018/30 at the request of Finansinspektionen (the Swedish financial supervisory authority).

Corporate governance:

ECB Recommendation to the Council of the European Union on the external auditors of Lietuvos bankas

On 18 May 2018 the Governing Council adopted Recommendation ECB/2018/15 to the Council of the European Union on the external auditors of Lietuvos bankas. The Recommendation has been published in the Official Journal of the European Union and on the ECB’s website.

Statistics:

New ECB Guideline on the Register of Institutions and Affiliates Data and amended Guideline on monetary and financial statistics

On 1 June 2018 the Governing Council adopted Guideline (EU) 2018/876 on the Register of Institutions and Affiliates Data (ECB/2018/16) or “RIAD”, the shared dataset of reference data on legal and other statistical institutional units. On the same day, the Governing Council also adopted Guideline (EU) 2018/877 amending Guideline ECB/2014/15 on monetary and financial statistics (ECB/2018/17). The new ECB Guideline on RIAD provides details on the obligations of national central banks (NCBs) to report to the ECB reference data on entities, as well as on obligations related to the maintenance and quality management of such information. To ensure legal certainty and clarity, all rules and procedures specifying how NCBs report the required data to the ECB using RIAD have been deleted from the ECB Guideline amending Guideline ECB/2014/15. Both ECB Guidelines are available on the ECB’s website.

ESCB Statistics Committee’s annual progress report on the collection of granular credit data

On 23 May 2018 the Governing Council took note of the 2017 annual progress report on the preparatory measures for the long-term framework for the collection of granular credit data, prepared in accordance with Article 3(2) of Decision ECB/2014/6 on the organisation of preparatory measures for the collection of granular credit data by the European System of Central Banks (ESCB). The report concludes that progress is ongoing and according to plan, allowing a timely start to the AnaCredit data transmission scheduled for November 2018.

International and European cooperation:

17th annual review of the international role of the euro

On 25 May 2018 the Governing Council approved the 17th annual review of the international role of the euro and authorised its publication. In line with the biennial cycle for publication of this report series decided on in 2016, this year’s release is an interim version without special features or analytical boxes. The review presents a concise overview of developments in the use of the euro by non-euro area residents and provides updated statistical information on the main indicators of the euro’s international status considered to be of interest to the general public. The report is available on the ECB’s website.

Banking supervision:

Compliance with EBA Guidelines on internal governance and Joint ESMA and EBA Guidelines on the assessment of suitability of members of the management body and key function holders

On 22 May 2018 the Governing Council did not object to two proposals by the Supervisory Board to notify that, for the significant institutions under its direct supervision, the ECB complies with the European Banking Authority (EBA) Guidelines on internal governance (EBA/GL/2017/11), as well as with the Joint ESMA and EBA Guidelines on the assessment of the suitability of members of the management body and key function holders (EBA/GL/2017/12). The notifications – addressed, respectively, to the EBA and to ESMA and the EBA jointly – clarify that the ECB’s compliance is to be interpreted as operating within the limits of, and without prejudice to, national provisions implementing the CRD IV. To ensure full compliance with these Joint ESMA and EBA Guidelines, the ECB has implemented changes to its policies on fit and proper assessments and has updated its Guide to fit and proper assessments accordingly.

Compliance with EBA Guidelines on probability-of-default (PD) estimation, loss-given-default (LGD) estimation and the treatment of defaulted exposures

On 20 June 2018 the Governing Council did not object to a proposal by the Supervisory Board to notify the EBA that, for the significant institutions under its direct supervision, the ECB will comply with the EBA Guidelines on probability-of-default (PD) estimation, loss-given-default (LGD) estimation and the treatment of defaulted exposures (EBA/GL/2017/16) as from the date they become applicable, which is currently specified by the EBA to be 1 January 2021. The guidelines are one of the initiatives undertaken by the EBA to reduce unjustified variability of risk parameters and own funds requirements, and are part of a broader review of the internal ratings-based (IRB) approach being carried out by the EBA.

Compliance with EBA Recommendations on outsourcing to cloud service providers

On 20 June 2018 the Governing Council did not object to a proposal by the Supervisory Board to notify the EBA that, for the significant institutions under its direct supervision, the ECB intends to comply with the EBA Recommendations on outsourcing to cloud service providers (EBA/REC/2017/03) by the end of 2018. These recommendations, addressed to credit institutions and investment firms, as well as to competent authorities, aim to clarify how the principles of the Guidelines on outsourcing published by the Committee of European Banking Supervisors (CEBS) in 2006 should be interpreted when outsourcing to cloud service providers, and stipulate how certain of these principles should be observed.

Publication of booklet on SREP methodology for less significant institutions

On 25 June 2018 the Governing Council did not object to a proposal by the Supervisory Board to publish the booklet on SREP methodology for less significant institutions (LSIs). This booklet, which provides a high-level overview of the SREP methodology for LSIs, will be published in due course on the ECB’s banking supervision website.

Curva dei rendimenti invertita? Questione di aspettative
di Cosimo Zangari e Federico Bartolozzi

Lug 07 2018
Curva dei rendimenti invertita? Questione di aspettative  di Cosimo Zangari e Federico Bartolozzi

«Thanks to Fed, an Inverted Yiled Curve is imminent» titolava, con toni allarmistici, pochi giorni fa un articolo di Brian Chappatta su Bloomberg [1], a seguito della recente decisione del FED Open Market Committee – FOMC – di rivedere al rialzo i tassi a breve [2].

La paura di un’inversione della curva non è tema nuovo oltreoceano; già in passato, al meeting di Dicembre 2017 del FOMC, Evans e Kashkari votarono contro un rialzo dei tassi proprio per timori legati a questa eventualità.

Che cos’è che spaventa in una curva dei rendimenti invertita? Ma soprattutto, quali sono le dinamiche dietro la sua formazione?

Con curva dei rendimenti (risk-free) invertita s’intende una situazione di mercato in cui i rendimenti offerti, per scadenze più lunghe, sono minori rispetto ai rendimenti della parte a breve della curva (in questo caso solitamente si considera il “breve” come i tassi fino a 2 anni). Si tratta di una situazione a prima vista contro-intuitiva. Chi ha studiato Finanza ricorderà certamente il mantra per cui 1 euro oggi è meglio di 1 euro domani; una curva invertita, invece, dice esattamente l’opposto: meglio 1 euro domani. Questo comporta che gli investitori, in media, si orientino verso investimenti di lungo periodo, nonostante i rendimenti inferiori agli investimenti di breve.

A questo punto una domanda sorge spontanea: quali sono i drivers che spingono l’investitore ad accettare tempi più lunghi per il rientro del proprio capitale nonostante il minor rendimento?

Per rispondere a questa domanda mettiamoci nei panni di un investitore che abbia una disponibilità e un orizzonte di investimento di 10 anni. Egli può, idealmente, comprare direttamente un bond decennale, accettando il rendimento implicito [3] o investire di anno in anno in un bond annuale (facendo il così detto rolling).

La prima strategia d’investimento non presenta alcun elemento di aleatorietà, poiché l’investitore non deve far altro che mettere il suo capitale nel bond al tempo iniziale (t = 0) e riscuotere a scadenza(in questo caso t = 10). La seconda strategia d’investimento, invece, ha un risultato incognito dato dal fatto che i tassi futuri con scadenza un anno non sono noti al tempo in cui si inizia la strategia.

La scelta fra le due sarà dunque guidata dalle aspettative che l’investitore elabora sulla futura evoluzione dei tassi ad un anno. Se l’investitore si aspetta un rialzo futuro dei tassi ad un anno, egli preferirà investire nella strategia di rolling, in modo da poter investire a scadenza (t = 1) il proprio capitale in titoli con rendimento maggiore (sempre che l’aspettativa si realizzi). In caso di aspettative ribassiste, invece, un investitore razionale sarà più propenso ad immobilizzare il proprio capitale direttamente nel bond decennale.

Un po’ come accade nella scelta di un mutuo: se l’aspettativa è quella di un ribasso dei tassi è buona norma scegliere un mutuo a tasso variabile, altrimenti si opta per un tasso fisso. Nel nostro esempio il bond decennale ricopre il ruolo del mutuo a tasso fisso, in quanto ci permette di bloccare il rendimento in maniera sicura, mentre la strategia di rolling è paragonabile al mutuo a tasso variabile.

Estendendo il ragionamento alla generalità degli investitori è facile intuire che i rendimenti delle due strategie (uno certo, l’altro atteso) devono tendere, in equilibrio, ad equivalersi. Se così non fosse gli investitori avrebbero tutto l’incentivo a spostare il proprio capitale da una strategia all’altra.

In sostanza, denotando con l’aspettativa al tempo zero del tasso annuale futuro al tempo t, si può supporre che in equilibrio:

dove l’argomento a sinistra dell’uguale rappresenta il rendimento (atteso) dalla strategia di rolling, mentre l’argomento a destra rappresenta il rendimento (certo) dato dall’investire tutto e subito nel bond decennale.

Affinché nel mercato si realizzi una curva invertita, bisogna che le aspettative degli agenti di mercato siano tali che l’uguaglianza si trasformi, temporaneamente, in una disuguaglianza:

In tal caso la maggioranza degli investitori è spinta a investire nel bond a 10 anni piuttosto che nella strategia di rolling: questa, come si vede dalla disuguaglianza, restituisce infatti un rendimento complessivo inferiore.

Una maggiore domanda orientata verso il bond decennale porta ad un incremento del suo prezzo e conseguentemente ad una riduzione del suo rendimento, fintanto che l’uguaglianza non è ristabilita per un tasso più basso. Se questa diminuzione è consistente, il risultato ottenuto è un’inversione della curva.

La condizione che determina il crearsi di tale disequilibrio, e di conseguenza l’inversione della curva, è essenzialmente una: l’affermarsi di un’aspettativa ribassista sui tassi a breve futuri.

Ma come si genera un’aspettativa dominante di tassi a breve in declino? La risposta sembra essere un’altra aspettativa: quella di una recessione economica. La prima reazione da parte delle banche centrali ad una recessione è infatti, da sempre, l’abbassamento dei tassi a breve. Di conseguenza, un’aspettativa di recessione si traduce in un’aspettativa di tassi a breve futuri minori, ovvero nella disuguaglianza che origina l’inversione della curva.

Ma cosa provoca allora la diffusione di questa seconda aspettativa di recessione economica? La risposta sta nell’azione della Fed, come citato a inizio articolo. Qualora l’azione delle banche centrali di alzare i tassi a breve venga mal percepita dal mercato, questa sarà la premessa logica per un’aspettativa di caduta in recessione nel futuro (cui seguono tassi bassi futuri per contrastare la recessione). Una curva invertita è dunque conseguenza dell’azione di una banca centrale che alza i tassi a breve termine (facendo dunque salire la parte sinistra della curva) e di un’interpretazione del mercato che porta la parte lunga della curva a scendere sotto il livello della parte a breve.

Ricapitolando: da un’azione della FED, ritenuta sbagliata o “precoce” dalla maggior parte degli operatori, può generarsi un’aspettativa di recessione futura, che si traduce a sua volta in un’aspettativa di tassi a breve futuri in ribasso. Tutto ciò finisce per incrementare la domanda rivolta ai bond di lungo termine con conseguente abbassamento dei rendimenti di lungo termine sotto quelli di breve.

Proprio a causa di questo forte nesso logico, l’inversione della curva è sovente usata in letteratura come predittore di crisi economiche. Basti pensare che le ultime sette recessioni economiche sono tutte state precedute da un’inversione della curva.

Estrella e Mishkin (1996) utilizzano un semplice approccio di regressione probit per stimare la probabilità di recessione 12 mesi avanti usando lo spread nei rendimenti a 10 anni e 3 mesi.

Al 22 Giugno 2018 lo spread 10Y-3M sulla curva americana è di 97 bps, quindi ancora in una sorta di confort zone, se ci basiamo sulla tabella di Estrella e Mishkin. Tuttavia ciò che conta spesso in Economia è anche la dinamica del fenomeno che, come si vede dalla Figura 2, è caratterizzata da un trend in netto peggioramento.


Note:

[1] https://www.bloomberg.com/view/articles/2018-06-13/fed-decision-an-inverted-yield-curve-is-imminent

[2] Federal Fund Rates e Discount Rates

[3] il pedice rappresenta il momento temporale di riferimento a cui è definito il tasso di rendimento, l’argomento fra parentesi rappresenta la maturity dell’investimento.

Il termometro dei mercati finanziari (6 luglio 2018)
a cura di Emilio Barucci e Daniele Marazzina

Lug 07 2018
Il termometro dei mercati finanziari (6 luglio 2018)  a cura di Emilio Barucci e Daniele Marazzina

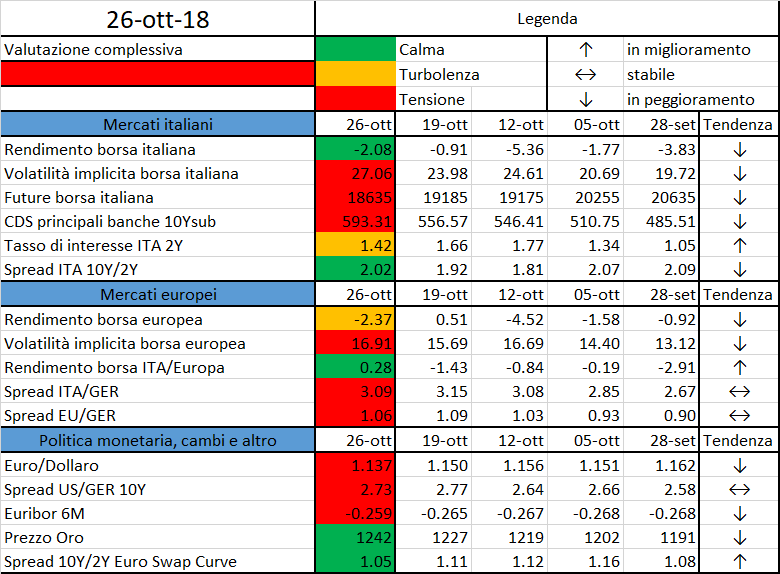
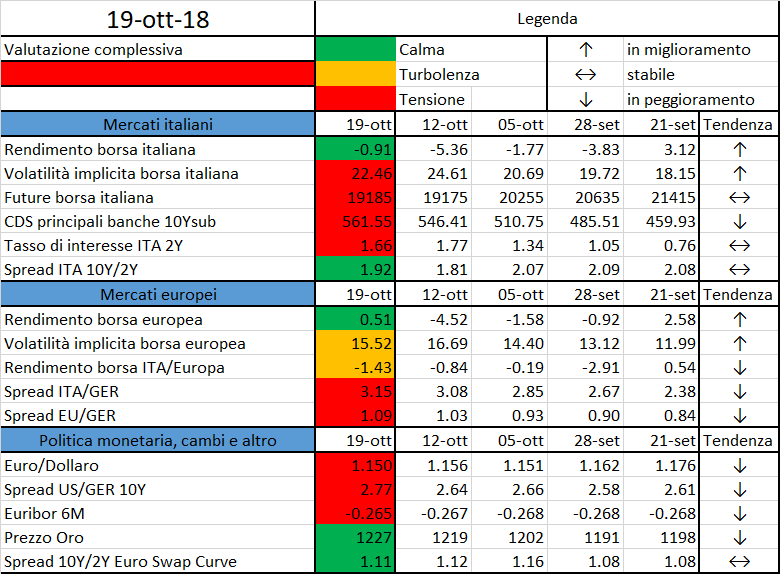
Continua l’iniziativa di Finriskalert.it “Il termometro dei mercati finanziari”. Questa rubrica vuole presentare un indicatore settimanale sul grado di turbolenza/tensione dei mercati finanziari con particolare attenzione all’Italia.

Significato degli indicatori

  • Rendimento borsa italiana: rendimento settimanale dell’indice della borsa italiana FTSEMIB;
  • Volatilità implicita borsa italiana: volatilità implicita calcolata considerando le opzioni at-the-money sul FTSEMIB a 3 mesi;
  • Future borsa italiana: valore del future sul FTSEMIB;
  • CDS principali banche 10Ysub: CDS medio delle obbligazioni subordinate a 10 anni delle principali banche italiane (Unicredit, Intesa San Paolo, MPS, Banco BPM);
  • Tasso di interesse ITA 2Y: tasso di interesse costruito sulla curva dei BTP con scadenza a due anni;
  • Spread ITA 10Y/2Y : differenza del tasso di interesse dei BTP a 10 anni e a 2 anni;
  • Rendimento borsa europea: rendimento settimanale dell’indice delle borse europee Eurostoxx;
  • Volatilità implicita borsa europea: volatilità implicita calcolata sulle opzioni at-the-money sull’indice Eurostoxx a scadenza 3 mesi;
  • Rendimento borsa ITA/Europa: differenza tra il rendimento settimanale della borsa italiana e quello delle borse europee, calcolato sugli indici FTSEMIB e Eurostoxx;
  • Spread ITA/GER: differenza tra i tassi di interesse italiani e tedeschi a 10 anni;
  • Spread EU/GER: differenza media tra i tassi di interesse dei principali paesi europei (Francia, Belgio, Spagna, Italia, Olanda) e quelli tedeschi a 10 anni;
  • Euro/dollaro: tasso di cambio euro/dollaro;
  • Spread US/GER 10Y: spread tra i tassi di interesse degli Stati Uniti e quelli tedeschi con scadenza 10 anni;
  • Prezzo Oro: quotazione dell’oro (in USD)
  • Spread 10Y/2Y Euro Swap Curve: differenza del tasso della curva EURO ZONE IRS 3M a 10Y e 2Y;
  • Euribor 6M: tasso euribor a 6 mesi.

I colori sono assegnati in un’ottica VaR: se il valore riportato è superiore (inferiore) al quantile al 15%, il colore utilizzato è l’arancione. Se il valore riportato è superiore (inferiore) al quantile al 5% il colore utilizzato è il rosso. La banda (verso l’alto o verso il basso) viene selezionata, a seconda dell’indicatore, nella direzione dell’instabilità del mercato. I quantili vengono ricostruiti prendendo la serie storica di un anno di osservazioni: ad esempio, un valore in una casella rossa significa che appartiene al 5% dei valori meno positivi riscontrati nell’ultimo anno. Per le prime tre voci della sezione “Politica Monetaria”, le bande per definire il colore sono simmetriche (valori in positivo e in negativo). I dati riportati provengono dal database Thomson Reuters. Infine, la tendenza mostra la dinamica in atto e viene rappresentata dalle frecce: ↑,↓, ↔  indicano rispettivamente miglioramento, peggioramento, stabilità.

Disclaimer: Le informazioni contenute in questa pagina sono esclusivamente a scopo informativo e per uso personale. Le informazioni possono essere modificate da finriskalert.it in qualsiasi momento e senza preavviso. Finriskalert.it non può fornire alcuna garanzia in merito all’affidabilità, completezza, esattezza ed attualità dei dati riportati e, pertanto, non assume alcuna responsabilità per qualsiasi danno legato all’uso, proprio o improprio delle informazioni contenute in questa pagina. I contenuti presenti in questa pagina non devono in alcun modo essere intesi come consigli finanziari, economici, giuridici, fiscali o di altra natura e nessuna decisione d’investimento o qualsiasi altra decisione deve essere presa unicamente sulla base di questi dati.

ECB: methodology for calculating Euro Short-Term Rate (ESTER)

Giu 29 2018

The Governing Council of the European Central Bank (ECB) has decided on the final methodology for calculating the Euro Short-Term Rate (ESTER) – an overnight unsecured rate based entirely on money market statistical reporting (MMSR), which will start to be published by October 2019. We report here the main features of ESTER computation; the complete methodology can be found on the ECB website (see link below).

ESTER is exclusively based on borrowing transactions in euro conducted with financial counterparties that banks report in accordance with EU Regulation (MMSR Regulation)

ESTER is calculated using overnight unsecured fixed rate deposit transactions over €1 million. Unsecured deposits are standardised and are the most frequent means of conducting arm’s length transactions on the basis of a competitive
procedure, thereby limiting idiosyncratic factors potentially influencing the volatility of the rate.

ESTER is calculated for each TARGET2 day as a volume-weighted trimmed mean rounded to the third decimal. The volume-weighted trimmed mean is calculated by:

  1. ordering transactions from the lowest rate to the highest rate;
  2. aggregating the transactions occurring at each rate level;
  3. removing the top and bottom 25% in volume terms; and
  4. calculating the mean of the remaining 50% of the volume-weighted distribution of rates

A pro rata calculation is applied to volumes that span the thresholds for trimming to ensure that exactly 50% of the total eligible volume is used in the calculation of the volume-weighted mean.

The ECB publishes ESTER with three decimal places no later than 09:00 CET on the next TARGET2 business day. Together with ESTER, the following related information is published:

  • total nominal value of transactions before trimming in EUR millions;
  • number of banks reporting transactions before trimming;
  • number of transactions before trimming;
  • percentage of total nominal amount reported by the five largest contributing banks that day, as a whole number;
  • calculation method: normal or contingency;
  • rates at the 25th and 75th percentiles with two decimal places.

ECB: ESTER Methodology (PDF)

FSB Europe: recovery and resolution, interest rate benchs and market-based finance

Giu 29 2018

The Financial Stability Board (FSB) Regional Consultative Group (RCG) for Europe met in Florence today. RCG members began by discussing current financial vulnerabilities, including global and regional macroeconomic and financial market developments.

Members received an update on the work of the FSB, including the outcomes of the FSB’s recent Plenary meeting. The FSB’s 2018 workplan focuses on:

  • monitoring the financial system to identify emerging risks, including those related to crypto-assets;
  • completing the G20’s financial reform priorities;
  • evaluating policies that have been implemented to ensure the reform programme is efficient, coherent, effective and addressing any unintended consequences
  • optimising how the FSB works to maximise its effectiveness.

Interest-rate benchmarks in individual jurisdictions within the RCG Europe were the next topic for discussion. Members of the group discussed the reforms put in place across Europe. Members discussed the implementation of EU benchmark legislation and the issues authorities face to ensure the transparency, reliability and improved governance and supervision of benchmark rates.

Members then discussed progress in work to transform shadow banking into resilient market-based finance. Members noted that market-based finance provides a valuable alternative to bank funding and helps to support real economic activity, but it may also pose risks for financial stability.

European authorities are currently developing legislation to implement the FSB’s standard on Total Loss-Absorbing Capacity that is designed to ensure that a failing bank has sufficient loss-absorbing and recapitalisation capacity available.


BdI: coefficiente capitale anticiclico a zero per il Q3 – 2018

Giu 29 2018

Banca d’Italia comunica la decisione di mantenere il coefficiente della riserva di capitale anticiclica allo zero per cento per il terzo trimestre del 2018. La decisione è stata presa sulla base dell’analisi degli indicatori di riferimento, in particolare:

  • nel primo trimestre del 2018 lo scostamento dal trend di lungo periodo del rapporto tra credito bancario e PIL (credit-to-GDP gap), calcolato sulla base della metodologia standard del Comitato di Basilea, era negativo per circa tredici punti percentuali. Secondo la metodologia sviluppata dalla Banca d’Italia, che tiene conto delle caratteristiche specifiche del ciclo creditizio nel nostro paese, il divario sarebbe negativo per nove punti percentuali. Indicazioni analoghe provengono dall’analisi del rapporto tra credito totale e PIL, riferito al quarto trimestre del 2017 (l’ultimo per il quale si dispone di informazioni complete).


  • la condizione macrofinanziaria dell’economia italiana, seppure in ripresa, è ancora complessivamente debole. Il tasso di disoccupazione si riduce, ma rimane su livelli elevati. La dinamica del credito bancario al settore privato è positiva; il tasso di crescita del credito alle imprese resta tuttavia contenuto. La quota dei prestiti deteriorati (sia al lordo sia al netto delle rettifiche di valore) sul totale dei prestiti continua a ridursi, pur rimanendo ancora su valori elevati. I prezzi degli immobili in termini reali si sono pressoché stabilizzati, ma restano ben inferiori al loro livello di lungo periodo.


BdI: Coefficiente di capitale anticlico – comunicato stampa (PDF)

BdI: Indicatori di riferimento – dati per grafici (XLSX)

EBA: how financial institutions should prepare for Brexit

Giu 29 2018

The European Banking Authority (EBA) published  an Opinion relating to the risks posed by lack of preparation by financial institutions for the departure of the UK from the EU. In this Opinion, the EBA asks Competent Authorities to ensure that financial institutions take practical steps now to prepare for the possibility of a withdrawal of the UK from the EU with no ratified Withdrawal Agreement in place, and no transition period.

The monitoring of firms’ contingency planning conducted by supervisory and resolution authorities shows that financial institutions need to speed up their preparations for the potential departure of the UK from the EU in March 2019 without a ratified Withdrawal Agreement in place.  While the political agreement on a transition period is welcome, it will not be given legal effect until there is a ratified Withdrawal Agreement in place. This is not guaranteed, and in any event, it will only come at the end of the Article 50 process.

In a bid to ensure that firms are fully prepared for all scenarios the EBA has shared its views on its expectations in the Opinion.  Andrea Enria, Chairperson of the EBA, said  “firms cannot take for granted that they continue to operate as at present nor can they rely on as yet unrealised political agreements or public policy interventions” He added “Risks, capacity and legal implications must be examined and addressed.”. It is imperative that financial institutions in the EU27 and in the UK identify potential exposures and risk channels that may be affected, and the possible implications of the potential departure of the UK without a ratified Withdrawal Agreement in place.

Based on the EBA’s assessment, financial institutions should take adequate steps to mitigate the impact without relying on possible public sector solutions that may not be proposed and/or agreed in time. In particular, financial institutions should ensure they have the correct regulatory permissions, and associated management capacity in place ahead of time. They should identify risks around access to financial market infrastructures and funding markets and mitigate those. Financial institutions should also assess and take necessary actions to address any impacts on rights and obligations of their existing contracts, in particular derivative contracts.

Financial institutions also have a duty to communicate clearly to their customers where the latter might be impacted by the departure of the UK without a ratified Withdrawal Agreement. Financial institutions should inform their Competent Authorities about the actions they are taking, including with respect to communication with their customers.

EBA: Opinion on Brexit preparations (PDF)

AIFIRM risponde al Comitato di Basilea sul documento “Revisions to the minimum capital requirements for market risk”
di Luca Lotti, Marco Bianchetti e Umberto Cherubini

Giu 29 2018
AIFIRM risponde al Comitato di Basilea sul documento “Revisions to the minimum capital requirements for market risk”  di  Luca Lotti, Marco Bianchetti e Umberto Cherubini

AIFIRM (Associazione Italiana Financial Industry Risk Managers), tramite la propria Commissione Rischi di Mercato, ha risposto alla consultazione proposta dal Comitato di Basilea sulla revisione dei requisiti minimi di capitale per il rischio di mercato.

Il documento “Revisions to the minimum capital requirements for market risk”, posto in consultazione dal Comitato di Basilea dal 22 marzo al 20 giugno 2018, rappresenta un passaggio fondamentale nella ridefinizione delle regole internazionali volte a prevenire problemi analoghi a quelli verificatisi nel corso della crisi del 2007-2008 e, più in generale, a garantire una gestione più robusta dei rischi di mercato assunti dalle banche, rafforzandone la capacità di resistere a periodi di stress finanziario. Il contesto, infatti, è quello dei passaggi conclusivi per la finalizzazione del nuovo framework sui rischi di mercato, che prende le mosse da una revisione del discrimine tra portafoglio bancario e portafoglio di negoziazione e prevede tre alternative per le banche:

  • l’approccio dei modelli interni, con un significativo innalzamento dei requisiti in termini di capacità dei modelli di cogliere tutti i fattori di rischio che concorrono alla determinazione dei profitti e del Profit&Loss
  • un approccio standardizzato interamente nuovo, basato sulle sensitivity prodotte dai modelli di pricing utilizzati dalla banca
  • un approccio standardizzato semplificato, riservato alle banche con attività di negoziazione meno complesse.

I commenti formulati da AIFIRM, sostanzialmente allineati con quelli formulati da altre realtà dell’industria finanziaria, si focalizzano sui temi ancora oggetto di affinamento, tra cui:

  • la proposta di revisione degli scenari di correlazione fra i fattori di rischio e la modifica dei requisiti per il trattamento degli strumenti finanziari non lineari nell’ambito del nuovo metodo standardizzato, tipicamente utilizzato dalle banche piccole e medie,
  • una gestione più efficiente del test di attribuzione del Profit&Loss, che autorizza il metodo basato sui modelli interni tipicamente utilizzato dalle grandi banche.

Più in dettaglio, in relazione agli scenari di correlazione, AIFIRM ha evidenziato come le modifiche proposte nel documento di consultazione rappresentino una soluzione ragionevole ai problemi che erano stati rilevati, migliorando almeno in parte la coerenza dello scenario di “basse correlazioni” con quanto potrebbe essere effettivamente osservato in scenari di stress reali. Era stato infatti osservato che la regola precedentemente prevista per modificare le correlazioni tendeva a produrre valori di correlazione troppo bassi per fattori di rischio che tendono ad essere empiricamente molto correlati, quali ad esempio tassi d’interesse riferiti a tenor adiacenti della stessa curva.

Nell’ambito delle modifiche proposte al trattamento degli strumenti non lineari, AIFIRM ha commentato, come richiesto dal Comitato, i pregi e i limiti di due soluzioni alternative per la l’applicazione di scenari coerenti all’interno dello stesso raggruppamento (“bucket”) di fattori di rischio. E’ stata inoltre evidenziata una caratteristica delle formule previste nel nuovo approccio standardizzato che potrebbe, sotto talune condizioni, produrre dei “cliff effect”, intesi come forti variazioni dei risultati a fronte di variazioni apparentemente non significative delle posizioni di rischio.

Nell’ambito delle osservazioni sul test di attribuzione del Profit&Loss, AIFIRM ha sottolineato l’importanza di garantire meccanismi che consentano una gestione graduale delle eccezioni rilevate nell’ambito del test. L’introduzione di un approccio “a semaforo”, che prevede tre zone (“zona verde”, “zona gialla”, “zona “rossa”) invece di un approccio puramente “binario” (test superato o non superato), rappresenta un importante miglioramento in tale ambito, tuttavia sarebbe auspicabile consentire ad un desk che ha fallito il test, entrando in “zona rossa”, di ritornare in “zona gialla” se soddisfa i corrispondenti requisiti, pur non avendo raggiunto quelli della “zona verde”.

Per quanto riguarda l’approccio semplificato proposto dal Comitato di Basilea, basato sulla ricalibrazione delle regole di Basilea II sul rischio di mercato, AIFIRM auspica la possibilità di applicazione di tale approccio ad un ampio insieme di banche che non presentano particolari livelli di rilevanza e complessità dell’attività di trading.

AIFIRM auspica che il confronto fra regolatori e industria finanziaria proceda, per arrivare a delle regole internazionali sulla gestione dei rischi efficaci nel proteggere sia le banche che gli investitori ed i risparmiatori dagli effetti negativi di nuove possibili crisi finanziarie.


Riferimenti:

BIS: Revisions to the minimum capital requirements for market risks (PDF) 

Basel Committee: revisions to minimum capital requirements for market risk (Finriskalert News)

Il termometro dei mercati finanziari (29 giugno 2018)
a cura di Emilio Barucci e Daniele Marazzina

Giu 29 2018
Il termometro dei mercati finanziari (29 giugno 2018)  a cura di Emilio Barucci e Daniele Marazzina

Continua l’iniziativa di Finriskalert.it “Il termometro dei mercati finanziari”. Questa rubrica vuole presentare un indicatore settimanale sul grado di turbolenza/tensione dei mercati finanziari con particolare attenzione all’Italia.

Significato degli indicatori

  • Rendimento borsa italiana: rendimento settimanale dell’indice della borsa italiana FTSEMIB;
  • Volatilità implicita borsa italiana: volatilità implicita calcolata considerando le opzioni at-the-money sul FTSEMIB a 3 mesi;
  • Future borsa italiana: valore del future sul FTSEMIB;
  • CDS principali banche 10Ysub: CDS medio delle obbligazioni subordinate a 10 anni delle principali banche italiane (Unicredit, Intesa San Paolo, MPS, Banco BPM);
  • Tasso di interesse ITA 2Y: tasso di interesse costruito sulla curva dei BTP con scadenza a due anni;
  • Spread ITA 10Y/2Y : differenza del tasso di interesse dei BTP a 10 anni e a 2 anni;
  • Rendimento borsa europea: rendimento settimanale dell’indice delle borse europee Eurostoxx;
  • Volatilità implicita borsa europea: volatilità implicita calcolata sulle opzioni at-the-money sull’indice Eurostoxx a scadenza 3 mesi;
  • Rendimento borsa ITA/Europa: differenza tra il rendimento settimanale della borsa italiana e quello delle borse europee, calcolato sugli indici FTSEMIB e Eurostoxx;
  • Spread ITA/GER: differenza tra i tassi di interesse italiani e tedeschi a 10 anni;
  • Spread EU/GER: differenza media tra i tassi di interesse dei principali paesi europei (Francia, Belgio, Spagna, Italia, Olanda) e quelli tedeschi a 10 anni;
  • Euro/dollaro: tasso di cambio euro/dollaro;
  • Spread US/GER 10Y: spread tra i tassi di interesse degli Stati Uniti e quelli tedeschi con scadenza 10 anni;
  • Prezzo Oro: quotazione dell’oro (in USD)
  • Spread 10Y/2Y Euro Swap Curve: differenza del tasso della curva EURO ZONE IRS 3M a 10Y e 2Y;
  • Euribor 6M: tasso euribor a 6 mesi.

I colori sono assegnati in un’ottica VaR: se il valore riportato è superiore (inferiore) al quantile al 15%, il colore utilizzato è l’arancione. Se il valore riportato è superiore (inferiore) al quantile al 5% il colore utilizzato è il rosso. La banda (verso l’alto o verso il basso) viene selezionata, a seconda dell’indicatore, nella direzione dell’instabilità del mercato. I quantili vengono ricostruiti prendendo la serie storica di un anno di osservazioni: ad esempio, un valore in una casella rossa significa che appartiene al 5% dei valori meno positivi riscontrati nell’ultimo anno. Per le prime tre voci della sezione “Politica Monetaria”, le bande per definire il colore sono simmetriche (valori in positivo e in negativo). I dati riportati provengono dal database Thomson Reuters. Infine, la tendenza mostra la dinamica in atto e viene rappresentata dalle frecce: ↑,↓, ↔  indicano rispettivamente miglioramento, peggioramento, stabilità.

Disclaimer: Le informazioni contenute in questa pagina sono esclusivamente a scopo informativo e per uso personale. Le informazioni possono essere modificate da finriskalert.it in qualsiasi momento e senza preavviso. Finriskalert.it non può fornire alcuna garanzia in merito all’affidabilità, completezza, esattezza ed attualità dei dati riportati e, pertanto, non assume alcuna responsabilità per qualsiasi danno legato all’uso, proprio o improprio delle informazioni contenute in questa pagina. I contenuti presenti in questa pagina non devono in alcun modo essere intesi come consigli finanziari, economici, giuridici, fiscali o di altra natura e nessuna decisione d’investimento o qualsiasi altra decisione deve essere presa unicamente sulla base di questi dati.