La congiuntura bancaria europea sembra vivere un momento positivo. Come emerge dall’ultimo Rapporto Banche del Centro Europa Ricerche (2018) gli impieghi bancari erogati a tutti i settori economici sono cresciuti dello 0,4% in Italia, del 2,2 in Spagna, del 2,4 in Germania e dell’8,5% in Francia.
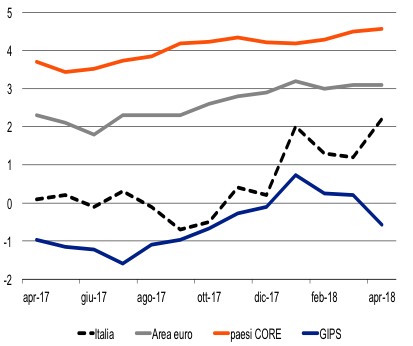
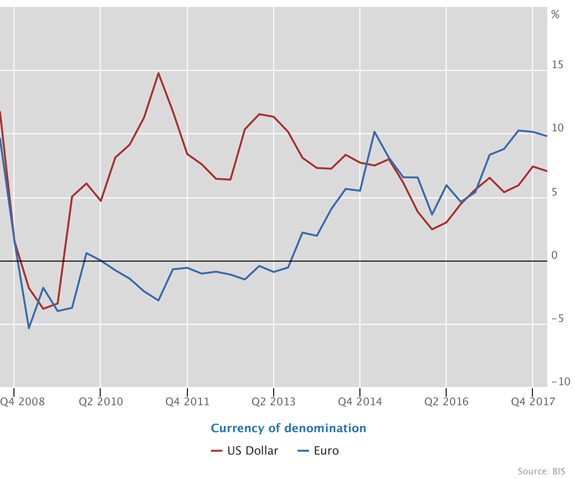
L’Italia in questo quadro sembra essere il paese con più difficoltà sul fronte bancario. Guardando al dettaglio dei finanziamenti erogati alle imprese non finanziarie la situazione italiana ad una prima analisi appare ancora peggiore. Lo stock degli impieghi alle imprese ha segnato una variazione pari a circa il -5% ad aprile 2018 (-1,6% ad aprile 2017), una riduzione in linea con quella osservata negli altri paesi periferici (Grecia, Irlanda, Portogallo e Spagna, GIPS). Nei paesi core, che comprendono Germania, Francia e le altre nazioni dell’Europa centrale, la variazione è stata invece nell’ordine del +4% (grafico 1).
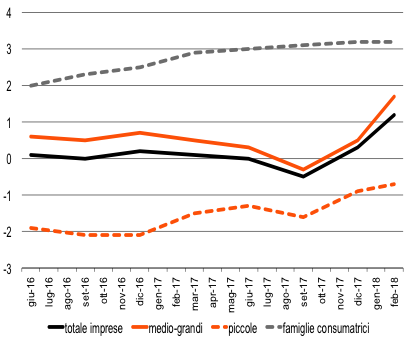
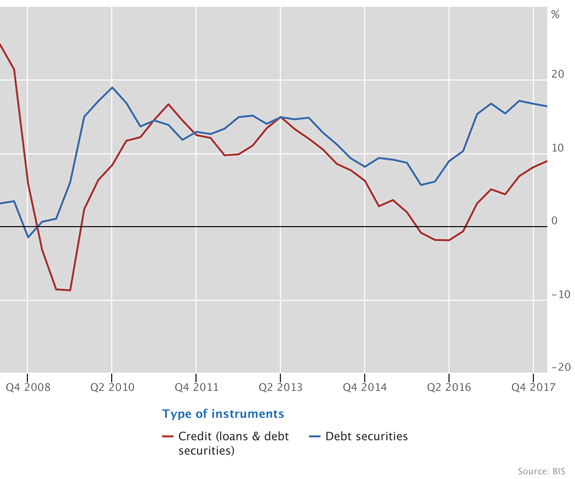
Queste dinamiche risentono però dei processi di cartolarizzazione. La cessione dei prestiti, che negli ultimi mesi ha riguardato in particolare i crediti dubbi, fa infatti diminuire dai bilanci la consistenza dei crediti erogati. Correggendo per effetto delle cartolarizzazioni si rileva che il credito alle imprese operanti in Italia da inizio anno è tornato ad aumentare (+2,2% ad aprile 2018 – grafico 2).
| Grafico 1. Impieghi alle società non finanziarie – Tasso di crescita su base annua
Fonte: elaborazioni CER su dati BCE. |
|
Grafico 2. Impieghi alle società non finanziarie – Tasso di crescita su base annua corretto per le cartolarizzazioni

Fonte: elaborazioni CER su dati BCE. |
L’analisi in base alla dimensione delle imprese ci dice però che il miglioramento nell’erogazione del credito si è verificato soprattutto tra le imprese medio-grandi (grafico 3). Per le più piccole c’è stata una flessione, seppur meno rilevante rispetto ad un anno fa.
| Grafico 3. Variazione % su base annua dei prestiti bancari (*)
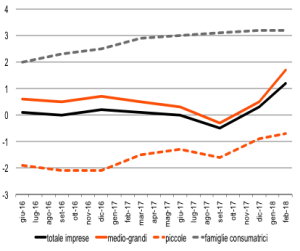
(*) Escludono i pronti contro termine e le sofferenze. Le variazioni percentuali sono corrette per tenere conto dell’effetto contabile di cartolarizzazioni e riclassificazioni. Le imprese piccole includono le società in accomandita semplice, in nome collettivo, semplici, di fatto e le imprese individuali con numero di addetti inferiore a 20.
Fonte: Banca d’Italia (Bollettino Economico).
|
|
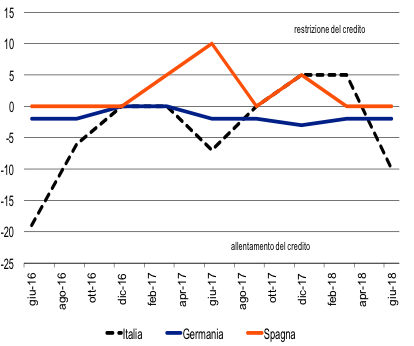
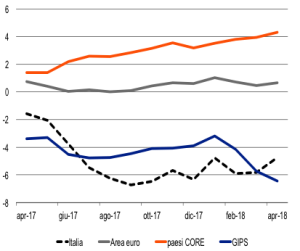
Grafico 4. Condizioni di offerta del credito alle PMI nell’ultimo trimestre (indice di diffusione (*))
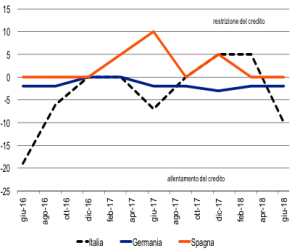
(*) 100 = massimo restringimento nell’erogazione del credito, -100 = massimo allentamento.
Fonte: elaborazioni CER su dati BCE.
|
Per determinare quanto queste dinamiche siano influenzate da fattori di offerta e/o di domanda si possono in primo luogo osservare le indicazioni offerte dalla Bank Lending Survey (BLS), un’indagine che viene effettuata dal 2003, condotta dalle banche centrali nazionali insieme alla BCE, che viene rivolta alle principali banche dell’area euro. Nel questionario somministrato vi è una specifica domanda in cui gli intermediari possono esprimere le loro valutazioni sull’andamento della congiunturale del sistema creditizio. Con specifico riferimento alle PMI, si osserva come le condizioni di offerta applicate in Italia nell’ultimo anno siano intonate verso l’allentamento, seppur in misura minore rispetto alla metà del 2016 (grafico 4).
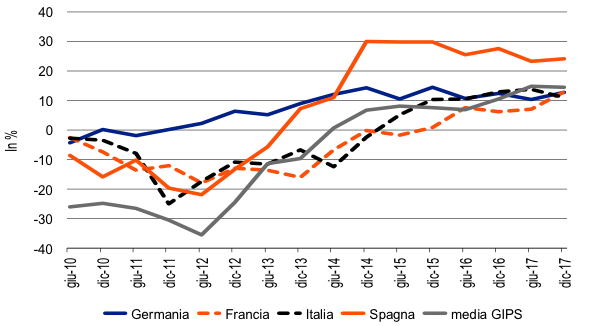
Grafico 5. Indicatore di accesso al credito delle PMI
Saldo netto delle risposte tra chi ha registrato un incremento rispetto alla riduzione del credito bancario

Fonte: elaborazioni CER su dati BCE e Commissione Europea.
Inoltre, le più recenti informazioni sul fronte del livello della domanda di credito, relative alla fine del 2017 e tratte dall’Indagine sull’accesso al credito delle PMI condotta dalla Bce e dalla Commissione Europea, non segnalano difficoltà di accesso al credito da parte delle PMI italiane. Il saldo tra le risposte di chi ha registrato un incremento del credito bancario rispetto a chi, invece, ha osservato una sua diminuzione offre delle indicazioni su quale è il livello di domanda di credito rimasta inevasa. Le indicazioni più recenti segnalano che la domanda di credito in Italia è stata interamente soddisfatta, tendenza che accomuna anche gli altri paesi europei (grafico 5).
In definitiva, le informazioni qualitative che emergono dalle survey dal lato dell’offerta e della domanda segnalano che nella fase più recente anche le imprese di minore dimensione non stanno registrando, in media, problemi di accesso al credito, come invece si poteva constare tra il 2011 e il 2014.
Al miglioramento delle condizioni di acceso ai finanziamenti bancari da parte delle imprese italiane, così come delle famiglie, hanno contribuito la pulizia dei bilanci bancari e soprattutto l’incisiva azione della Bce, in particolare tramite il quantitative easing (si veda Milani, 2015). Dal prossimo anno, però, il piano di acquisti di titoli di Stato verrà arrestato. Se la tabella di marcia definita da Mario Draghi, che prevede il permanere di una politica monetaria particolarmente accomodante per ancora molto tempo, sarà sposata anche dal nuovo presidente della Bce non c’è in ogni caso da attendersi un ritorno alla restrizione creditizia.
Bibliografia
– CER, Rapporto Banche 1/2018.
– Milani, Prime valutazioni sul quantitative easing europeo, FinRiskAlert.it del 12 Maggio 2015.