Il Rapporto Consob sulle scelte di investimento delle famiglie italiane, pubblicato lo scorso settembre, come di consueto rileva molteplici aspetti che concorrono a definire la qualità delle scelte finanziarie: il livello di conoscenze, le attitudini comportamentali, gli stili decisionali e il ricorso alla domanda di consulenza. Il Rapporto dedica un approfondimento anche a fenomeni emergenti quali il crowdfunding e il robo advice, che nel contesto domestico trovano una domanda potenziale ancora contenuta anche a causa di una ridotta propensione a investire via Internet.
La scarsa alfabetizzazione finanziaria …
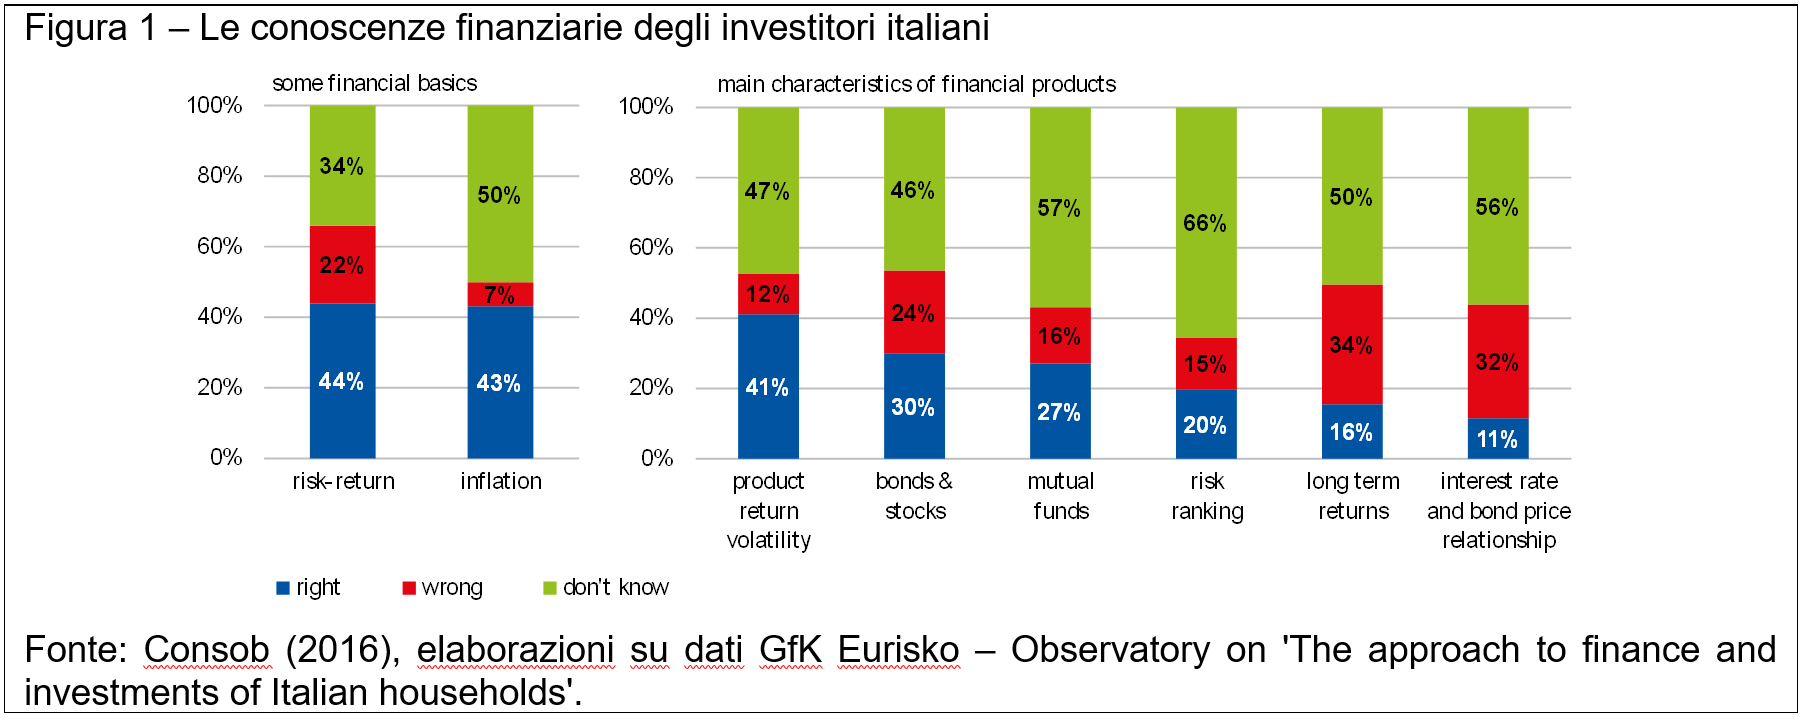
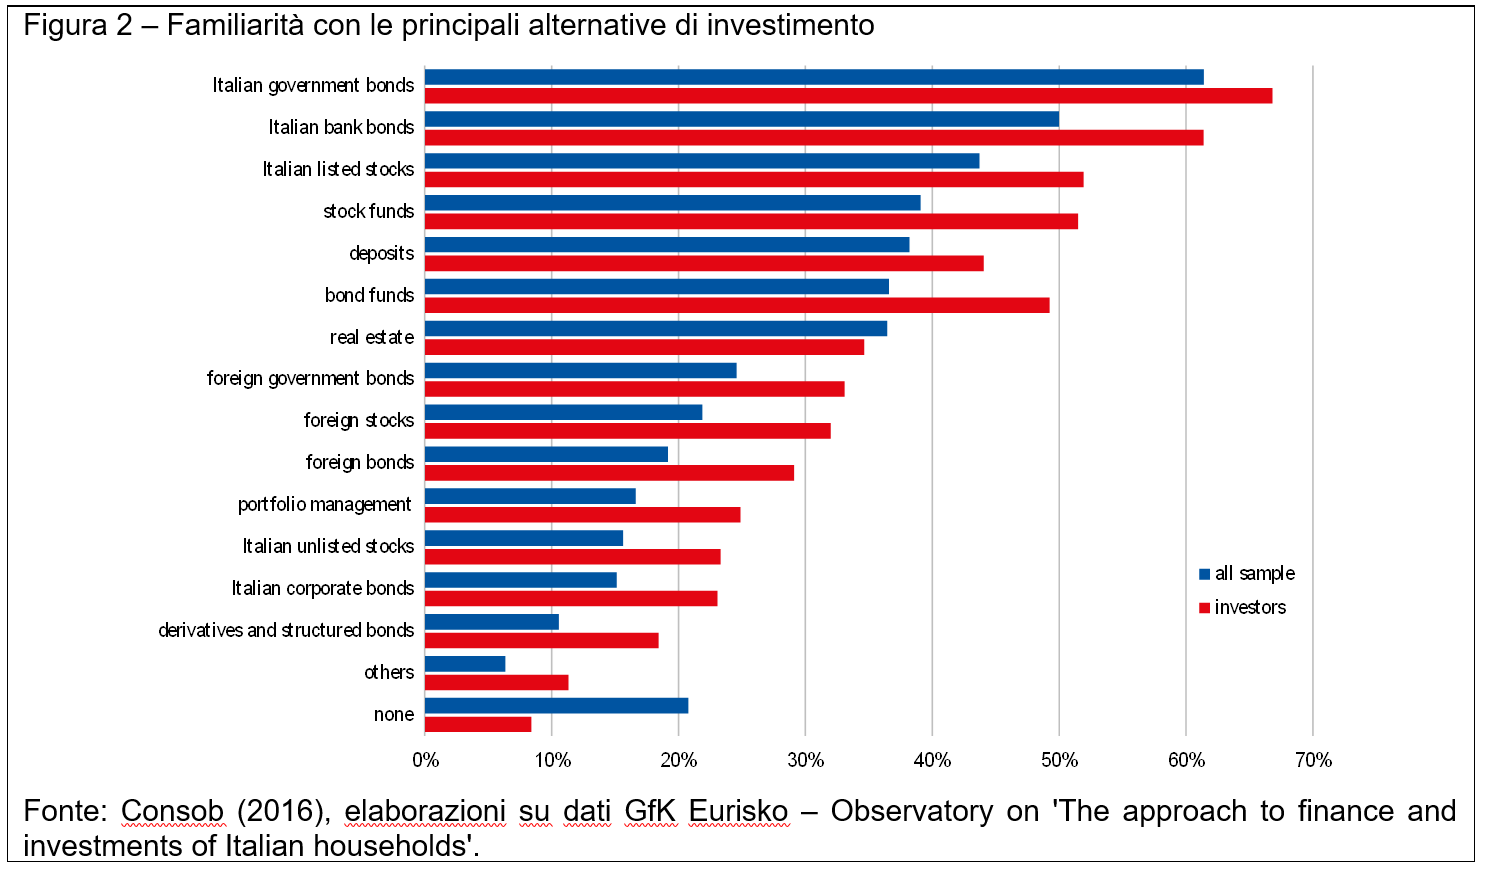
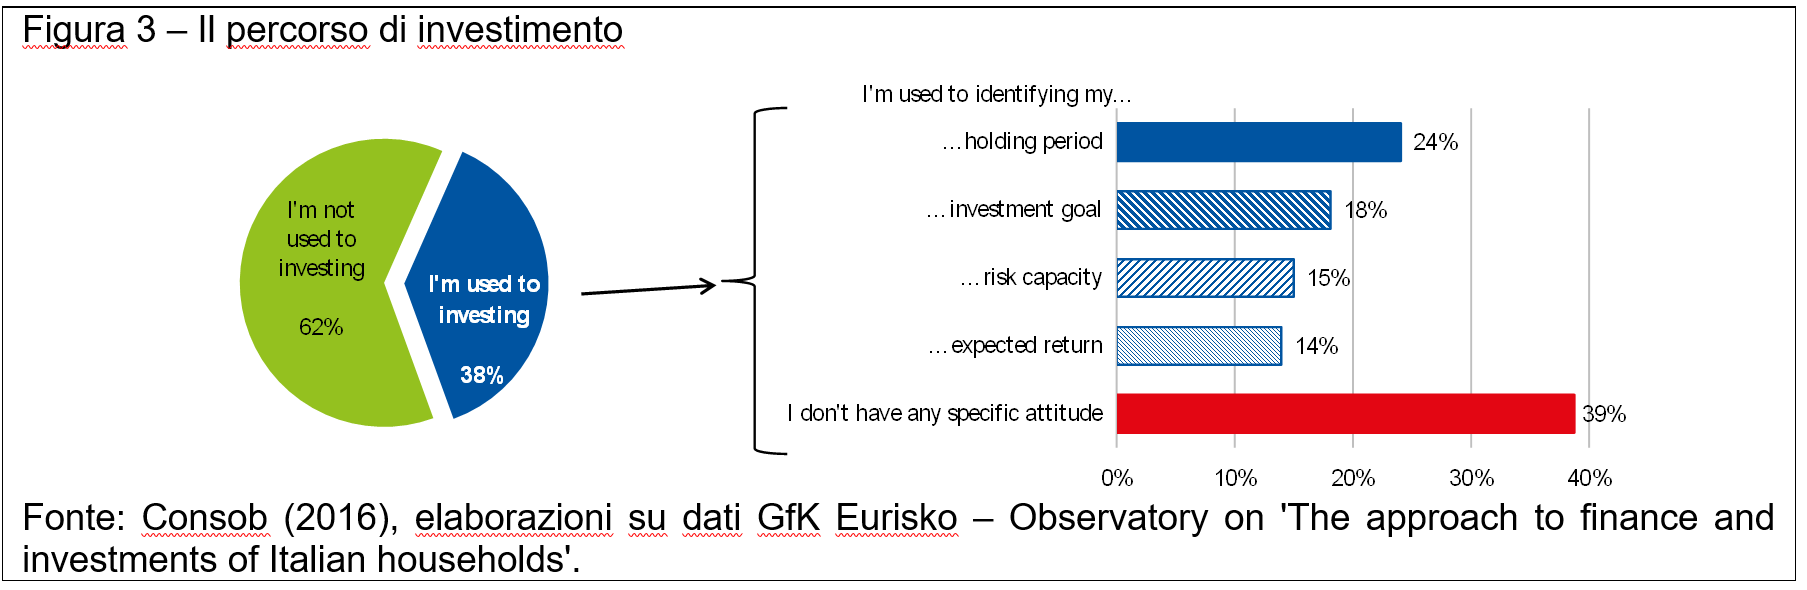
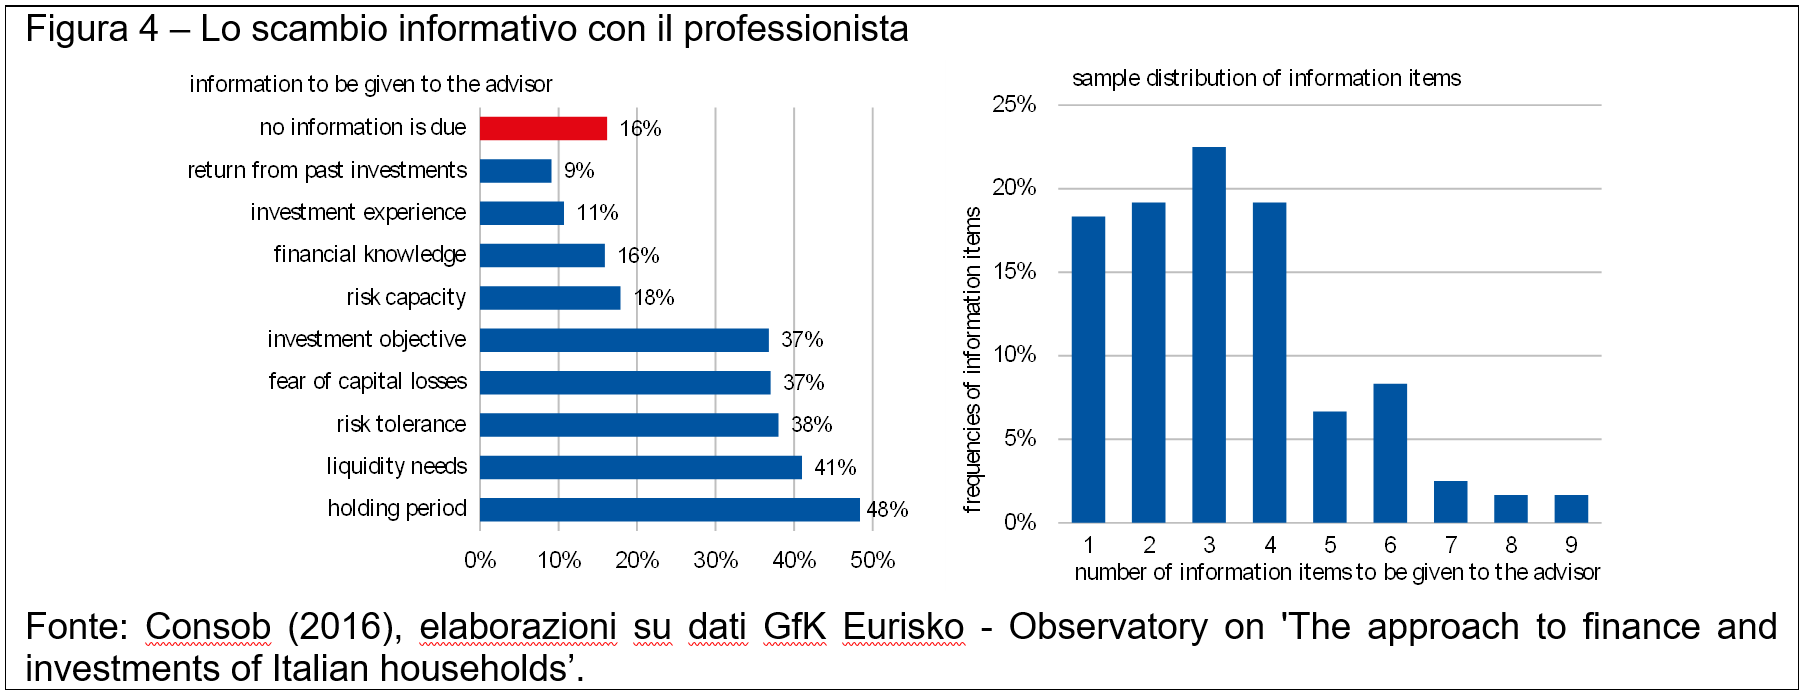
Le conoscenze finanziarie delle famiglie italiane, in linea con altre rilevazioni domestiche e internazionali, rimangono insufficienti. Solo poco più del 40% degli intervistati è in grado di definire correttamente alcune nozioni di base, quali inflazione e rapporto fra rischio e rendimento; concetti più sofisticati riguardanti le caratteristiche dei prodotti più diffusi registrano percentuali anche inferiori (fino all’11%; Figura 1). Più del 20% degli intervistati dichiara di non avere familiarità con alcuno strumento finanziario (il dato scende all’8% per il sotto-campione degli investitori), mentre il restante 80% indica più frequentemente i titoli del debito pubblico e le obbligazioni bancarie, seguiti da azioni quotate e fondi azionari (Figura 2). A queste carenze si associano lacune che attengono al processo decisionale in sé. Gran parte degli investitori, infatti, non ha piena consapevolezza dei fattori da ponderare prima di investire (orizzonte temporale, obiettivi, aspettative di guadagno e capacità economica di assumere rischi; Figura 3), né dell’importanza dello scambio informativo con il professionista ai fini della profilatura del cliente e della valutazione dell’adeguatezza degli strumenti finanziari raccomandati (Figura 4).
… e le competenze digitali ancora contenute …
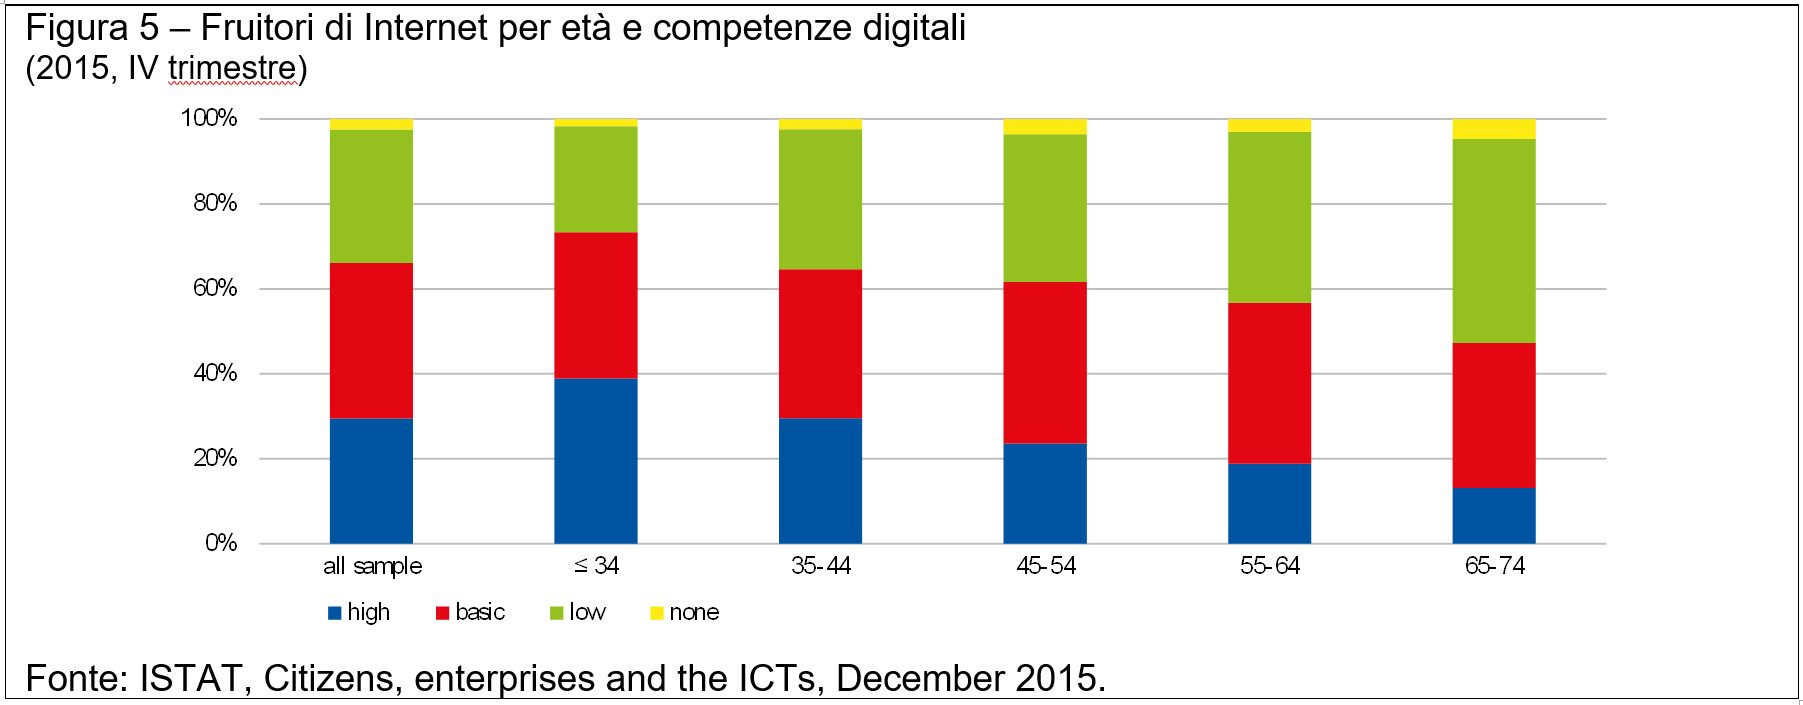
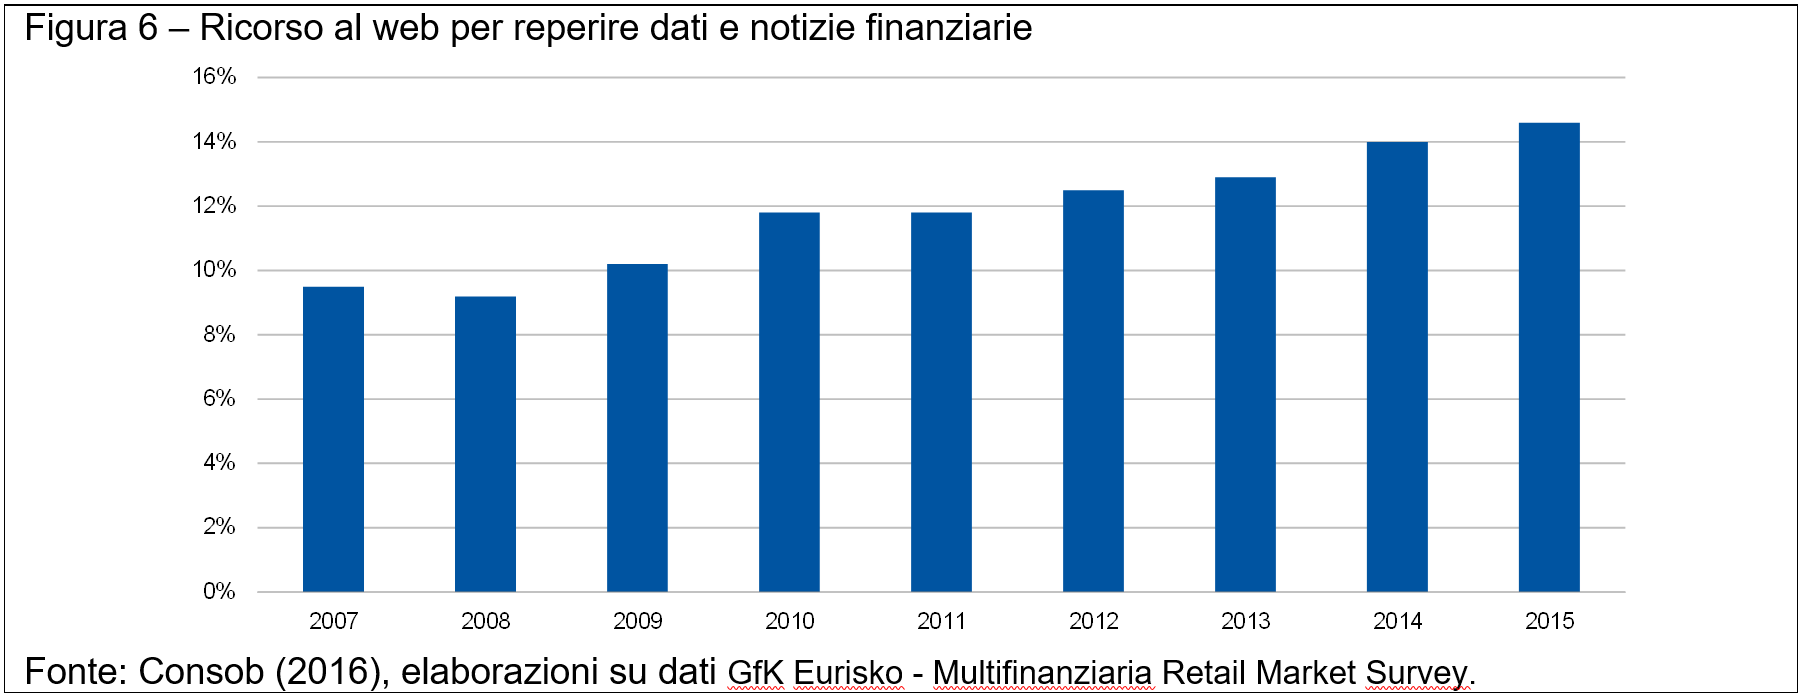
Secondo i dati ISTAT (2015), alla fine dello scorso anno solo il 30% degli utenti di Internet (corrispondenti al 65% circa della popolazione italiana) mostra di avere una cultura digitale elevata; di questi la maggior parte si concentra nella fascia d’età al di sotto dei 35 anni (Figura 5). Con particolare riferimento all’uso di Internet nell’ambito delle decisioni di investimento, la quota di famiglie che fa ricorso al web per reperire dati e notizie utili a compiere e a monitorare le scelte finanziarie, sebbene in crescita, supera di poco il 12% (Figura 6).
… condizionano l’attitudine delle famiglie italiane verso il contesto di riferimento e le dinamiche strutturali in atto
La scarsa alfabetizzazione finanziaria e digitale dell’italiano medio condizionano sensibilmente la comprensione dell’evoluzione del contesto di riferimento. Il Report Consob 2016, in particolare, ha indagato l’attitudine degli italiani verso le obbligazioni governative con rendimenti negativi e verso modalità innovative di investimento, quali la consulenza finanziaria automatizzata (cosiddetto robo-advice) e il crowdfunding.
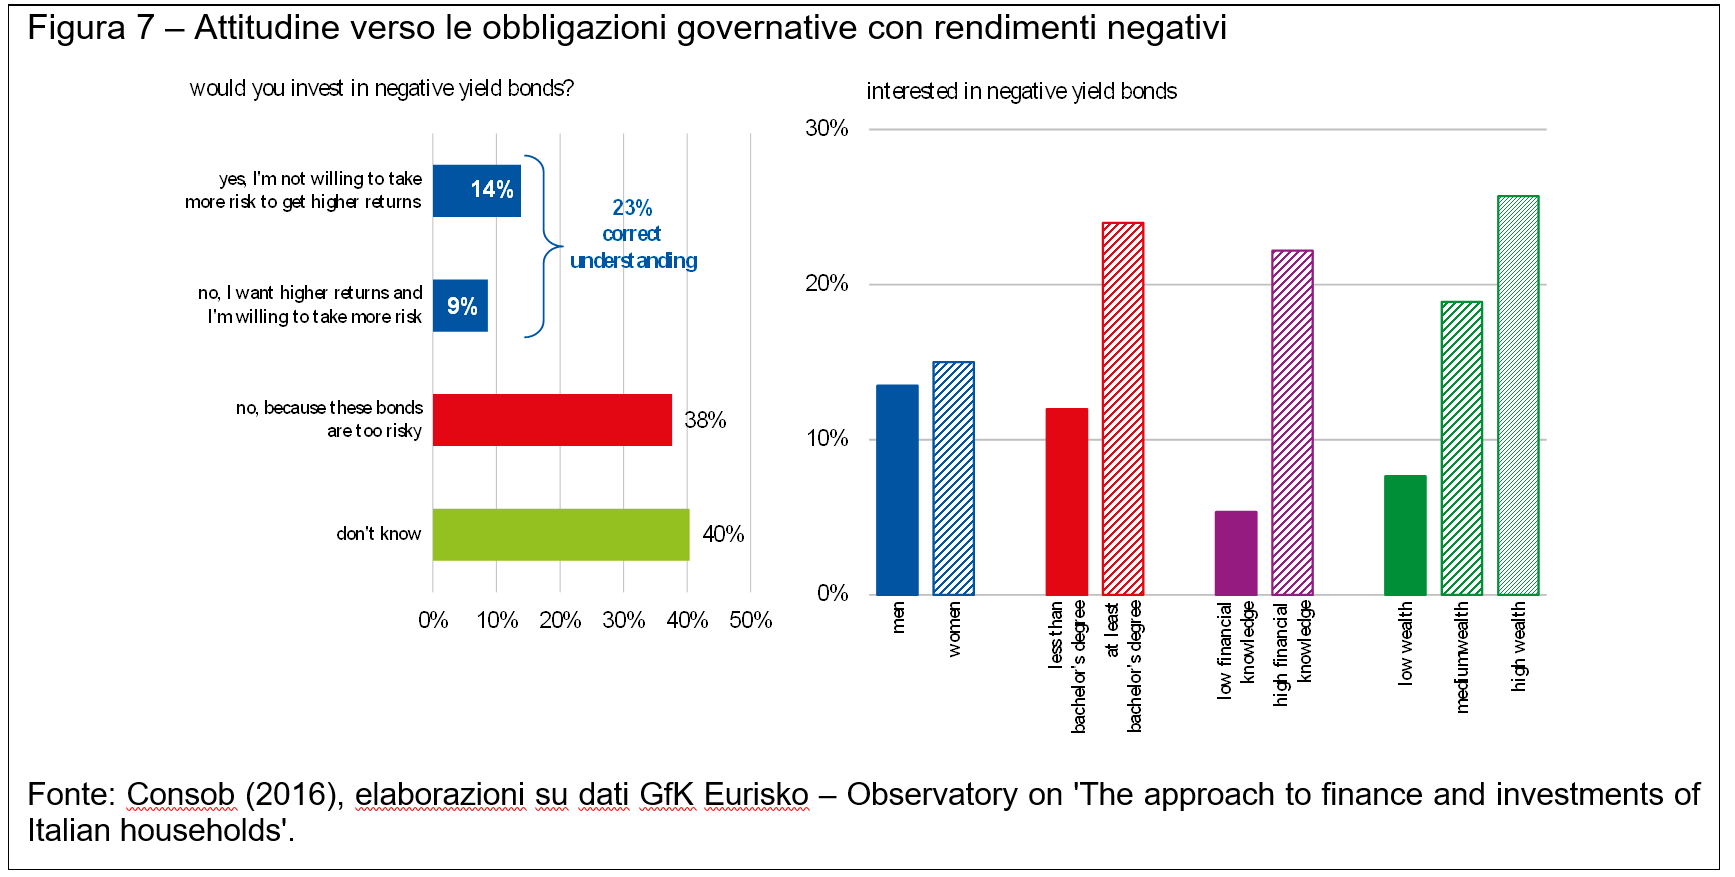
Il 40% degli intervistati non è in grado di esprimere un’opinione sui titoli di Stato dell’Eurozona connotati da rendimenti negativi ovvero (nel 38% dei casi) li considera troppo rischiosi; soltanto il 23% del campione è in grado di comprendere il fenomeno ponendolo in relazione con il trade-off rischio-rendimento (Figura 7). Ancora una volta, il dato conferma la difficoltà che accomuna la maggior parte dei risparmiatori a valutare correttamente la relazione tra rendimento atteso e rischio di uno strumento finanziario. Difficoltà che nell’attuale contesto di tassi negativi può stimolare un’inconsapevole quanto pericolosa attitudine al search for yield.
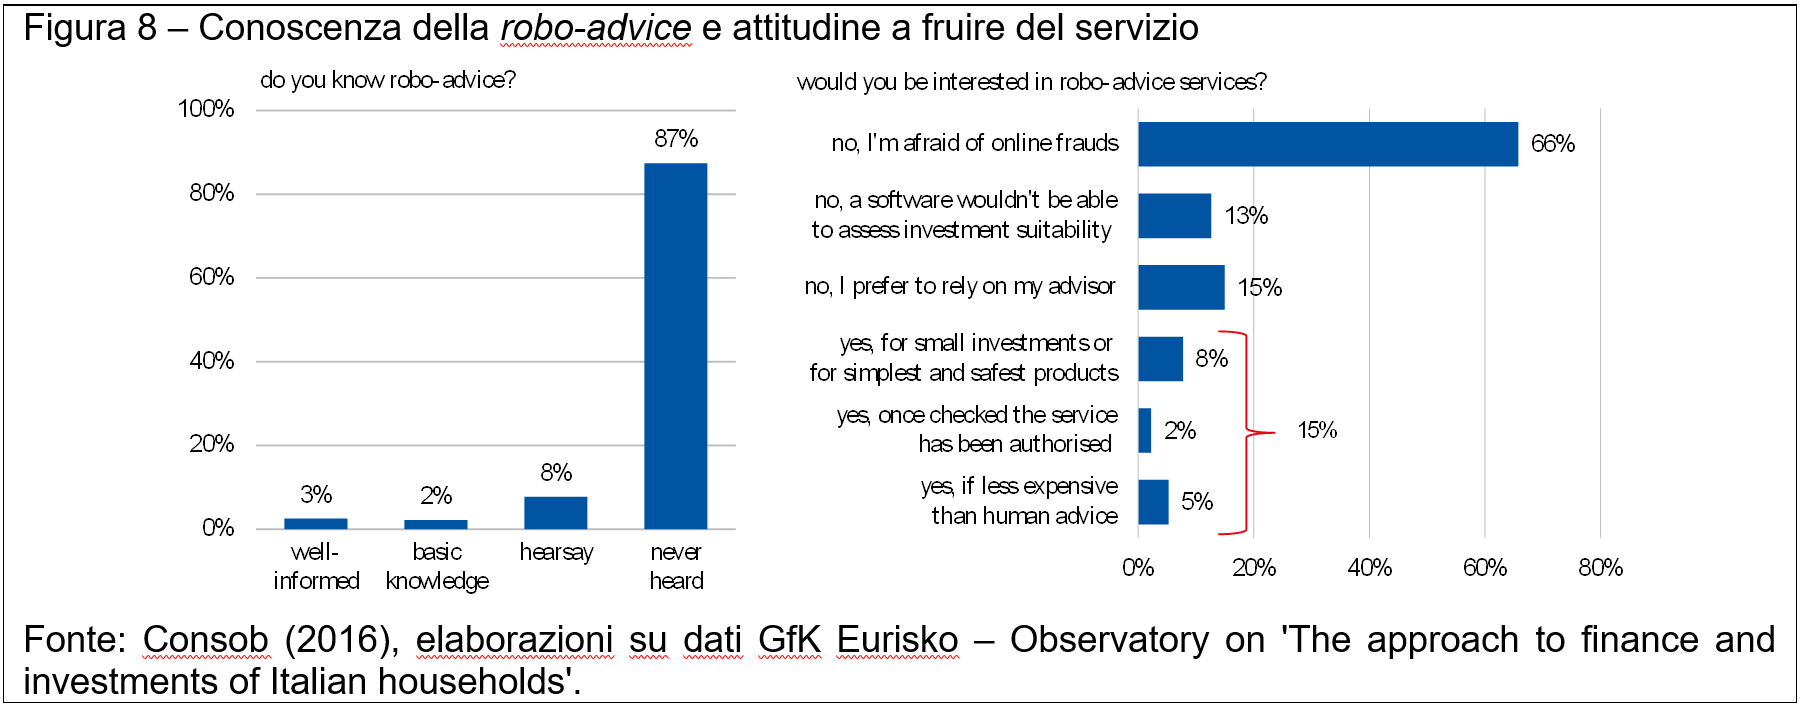
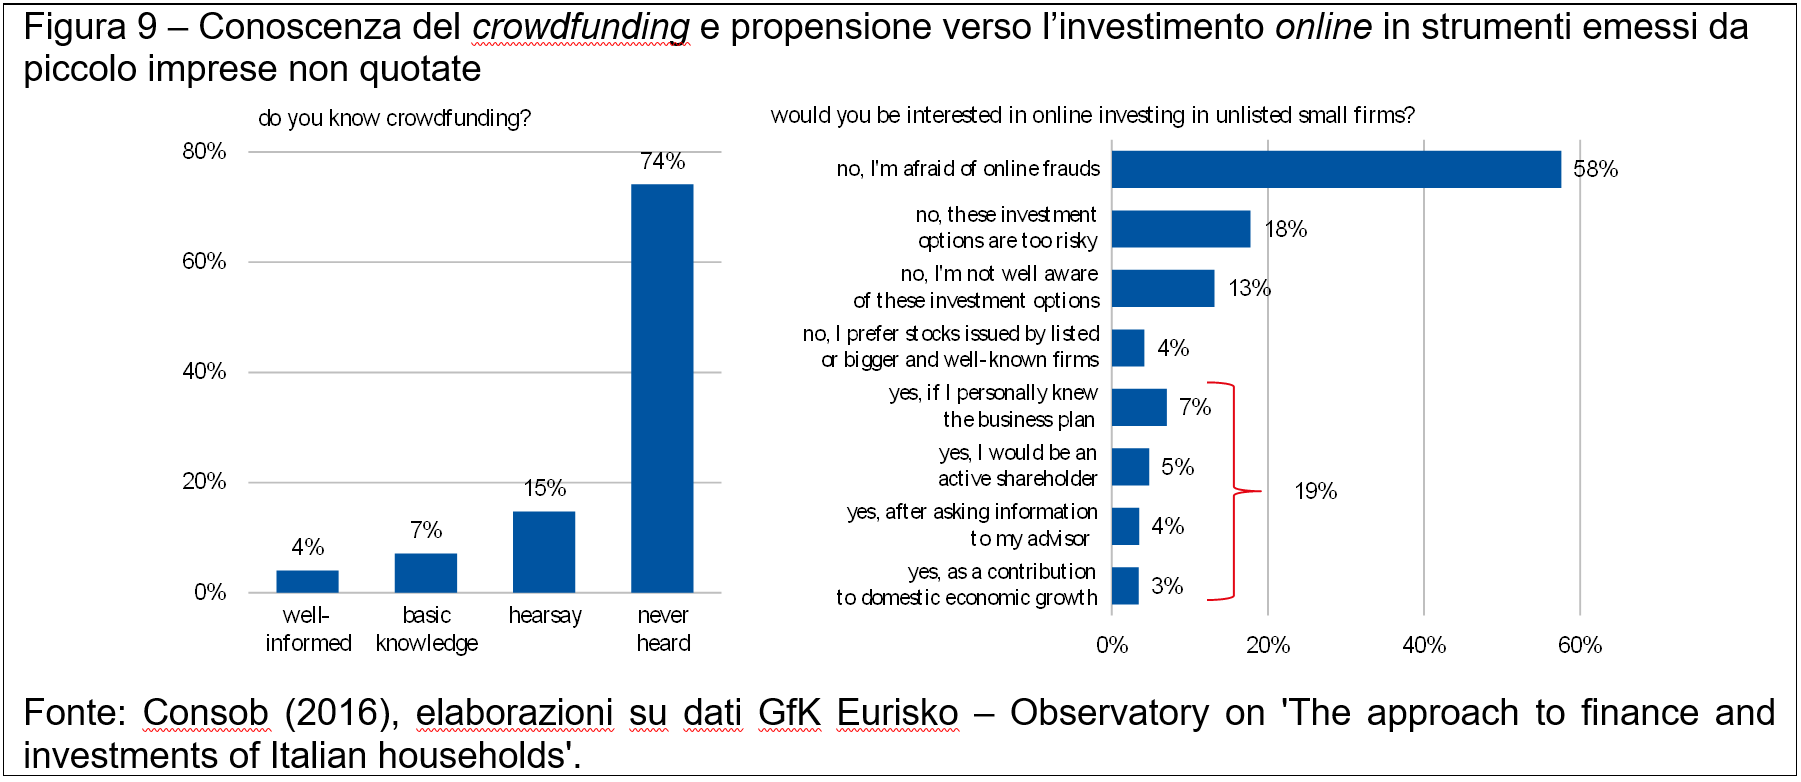
Sono altresì poco noti fenomeni come la consulenza automatizzata o il crowdfunding, visto che, rispettivamente, solo l’87% e il 74% dichiarano di averne almeno sentito parlare. La propensione verso queste modalità di investimento è comunque bassa, poiché la maggioranza degli intervistati non è bendisposta a causa del timore di truffe online (rispettivamente 66% e 58%; Figure 8 e 9).
La consulenza resa nel miglior interesse del cliente potrebbe migliorare la qualità delle scelte degli investitori, che tuttavia faticano a distinguerla da altri servizi di investimento e ad apprezzarne il valore aggiunto rispetto al fai-da-te o all’informal advice.
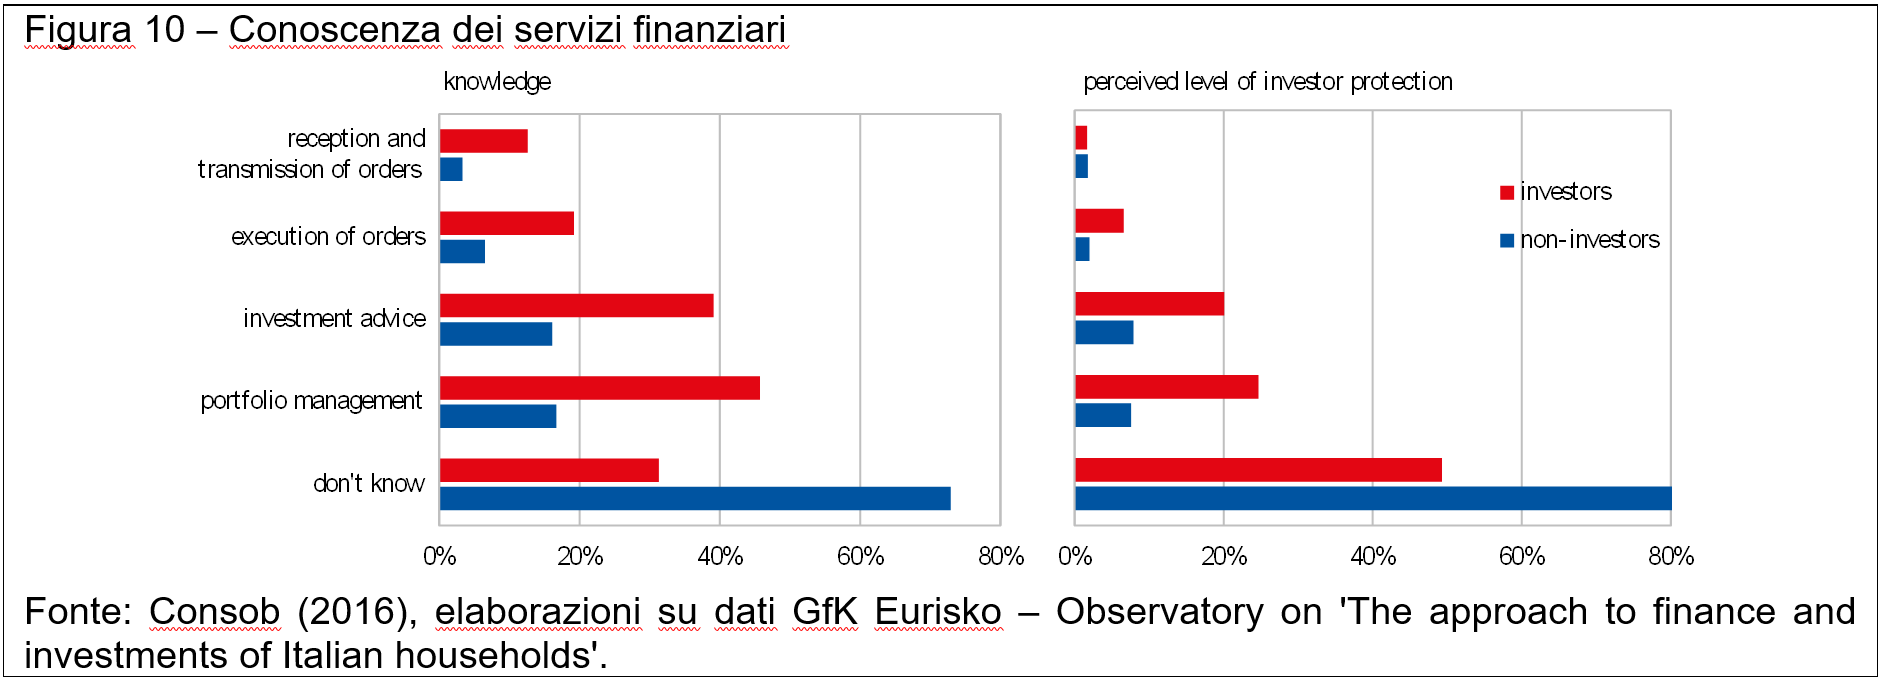
Circa il 60% circa degli intervistati non conosce nessuno dei servizi di investimento previsti dalla normativa vigente, mentre la percentuale di coloro che dichiarano di avere familiarità con i servizi di investimento oscilla tra il 7% (per il servizio di ricevimento e trasmissione di ordini) e il 30% (servizio di gestione di portafoglio; Figura 10). In linea con questa evidenza, la maggior parte degli intervistati (più dell’80% dei non investitori e il 50% degli investitori) non è in grado di identificare nella consulenza e nella gestione di portafoglio i servizi che garantiscono il più alto livello di tutela per effetto dell’obbligo della valutazione di adeguatezza.
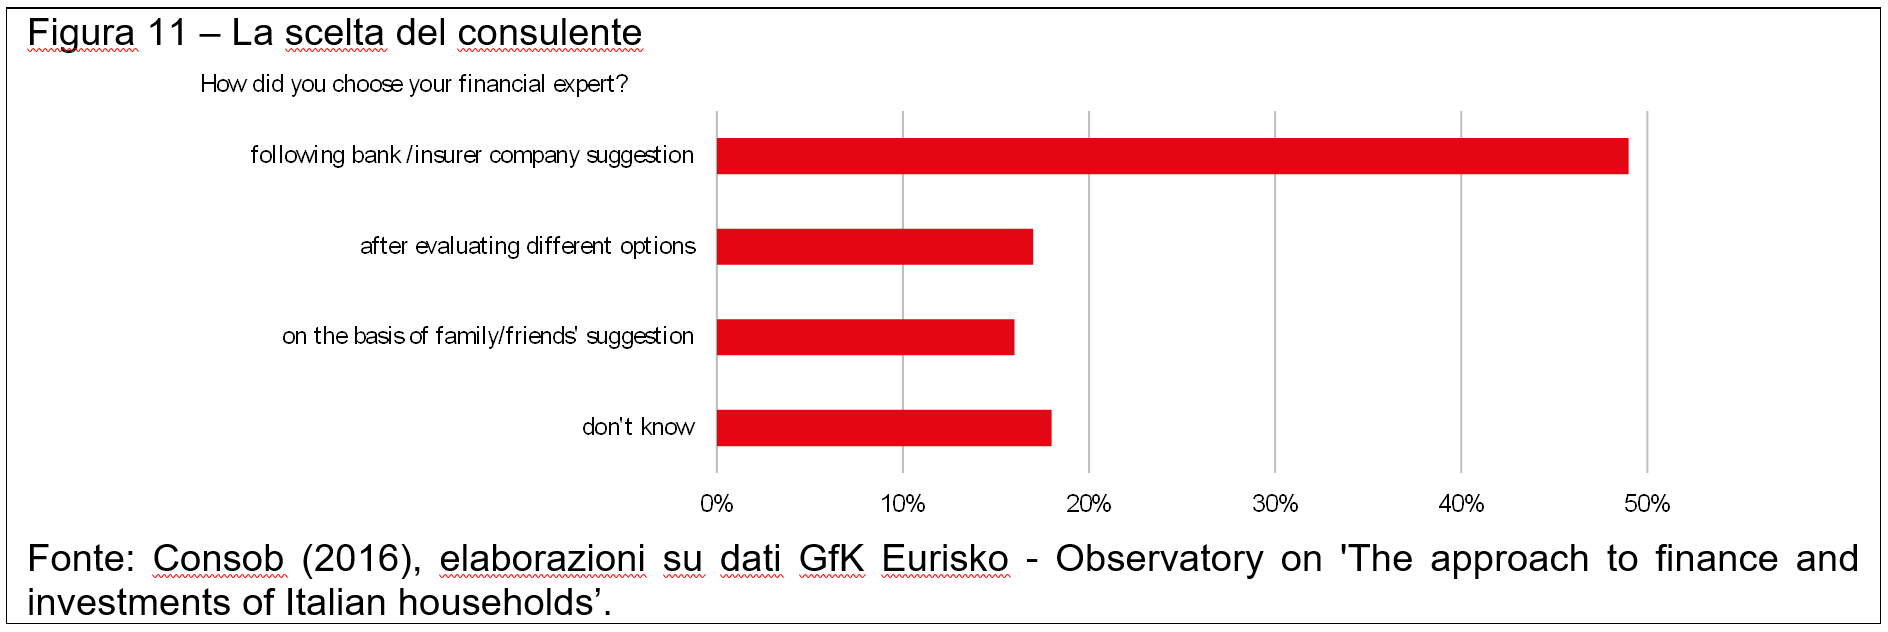
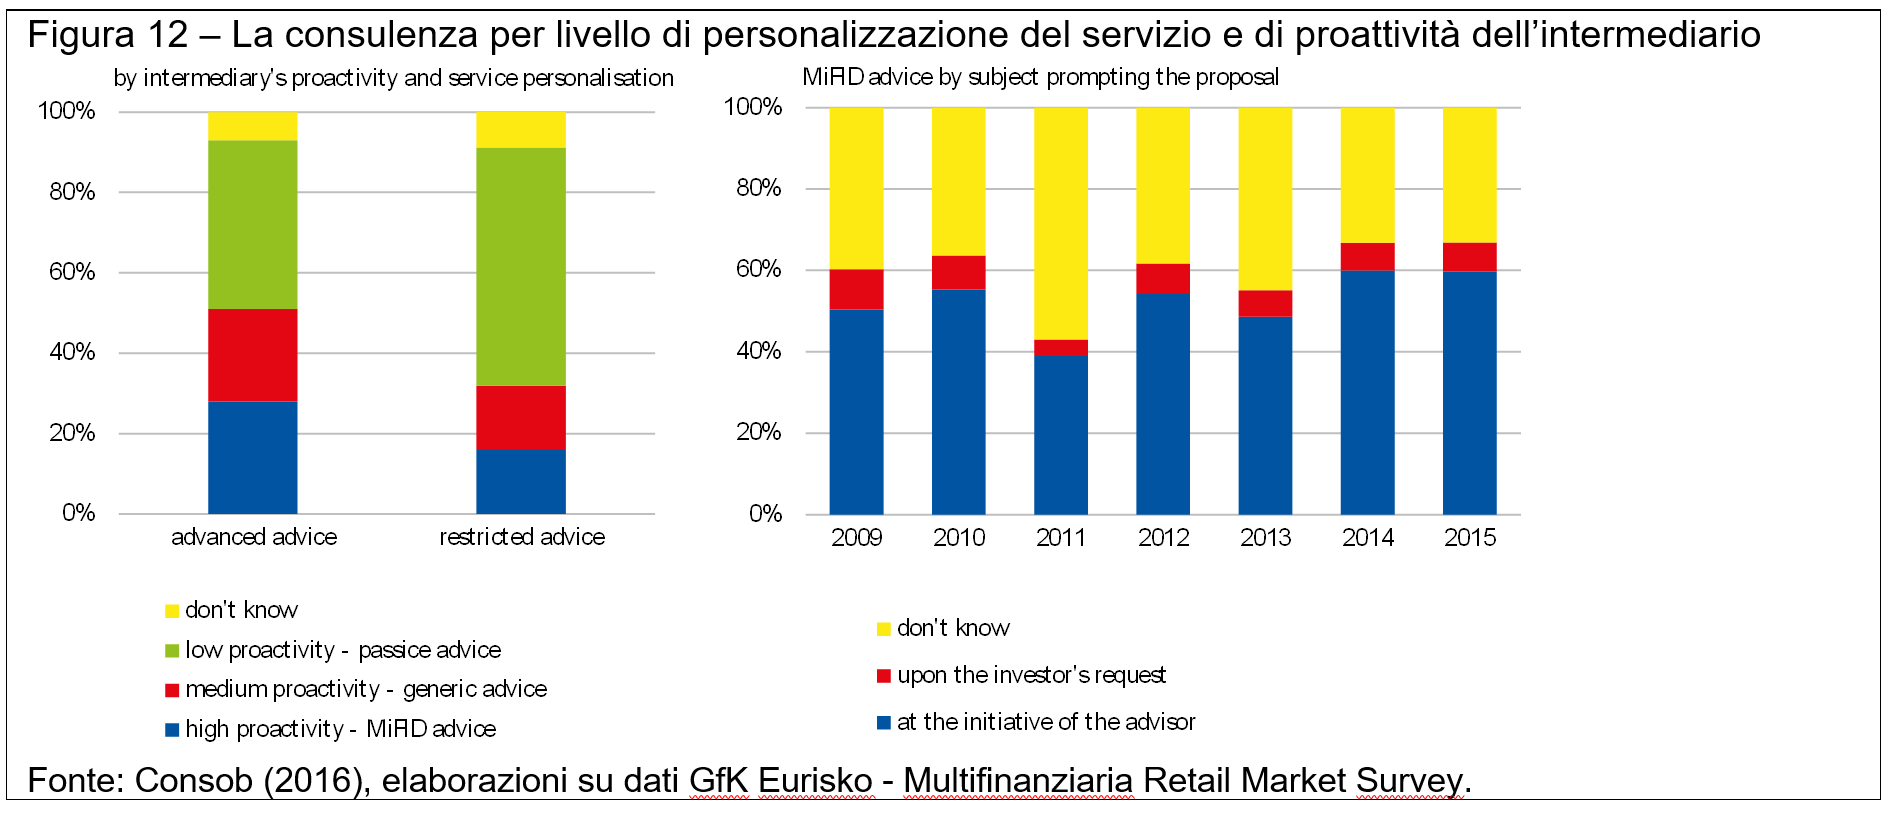
Tra gli investitori, solo il 28% riferisce di avvalersi di consulenza MiFID (ossia di raccomandazioni personalizzate e riferite a uno specifico strumento finanziario). Il servizio è erogato da un professionista che nella metà dei casi è stato scelto seguendo le indicazioni dell’istituto di credito di riferimento e in un quinto dei casi dopo aver valutato più di un’alternativa tra quelle disponibili sul mercato (Figura 11). La consulenza MiFID viene fornita prevalentemente su iniziativa dell’esperto e solo nel 7% dei casi su impulso dell’investitore; un terzo degli intervistati inoltre non sa individuare chi sia il soggetto ‘proponente’ (Figura 12). Alla luce di queste evidenze, non stupisce che gli investitori fatichino a riconoscere il valore aggiunto della consulenza rispetto al fai-da-te e al cosiddetto informal advice (il consiglio di famigliari e conoscenti) e che, di conseguenza, solo il 25% degli intervistati dichiari una disponibilità (contenuta) a pagare per il servizio. La domanda di consulenza, peraltro, si associa negativamente al livello di conoscenze finanziarie, così che a restare esclusi dal servizio sono proprio gli individui che potenzialmente beneficerebbero più degli altri dei consigli di un esperto.
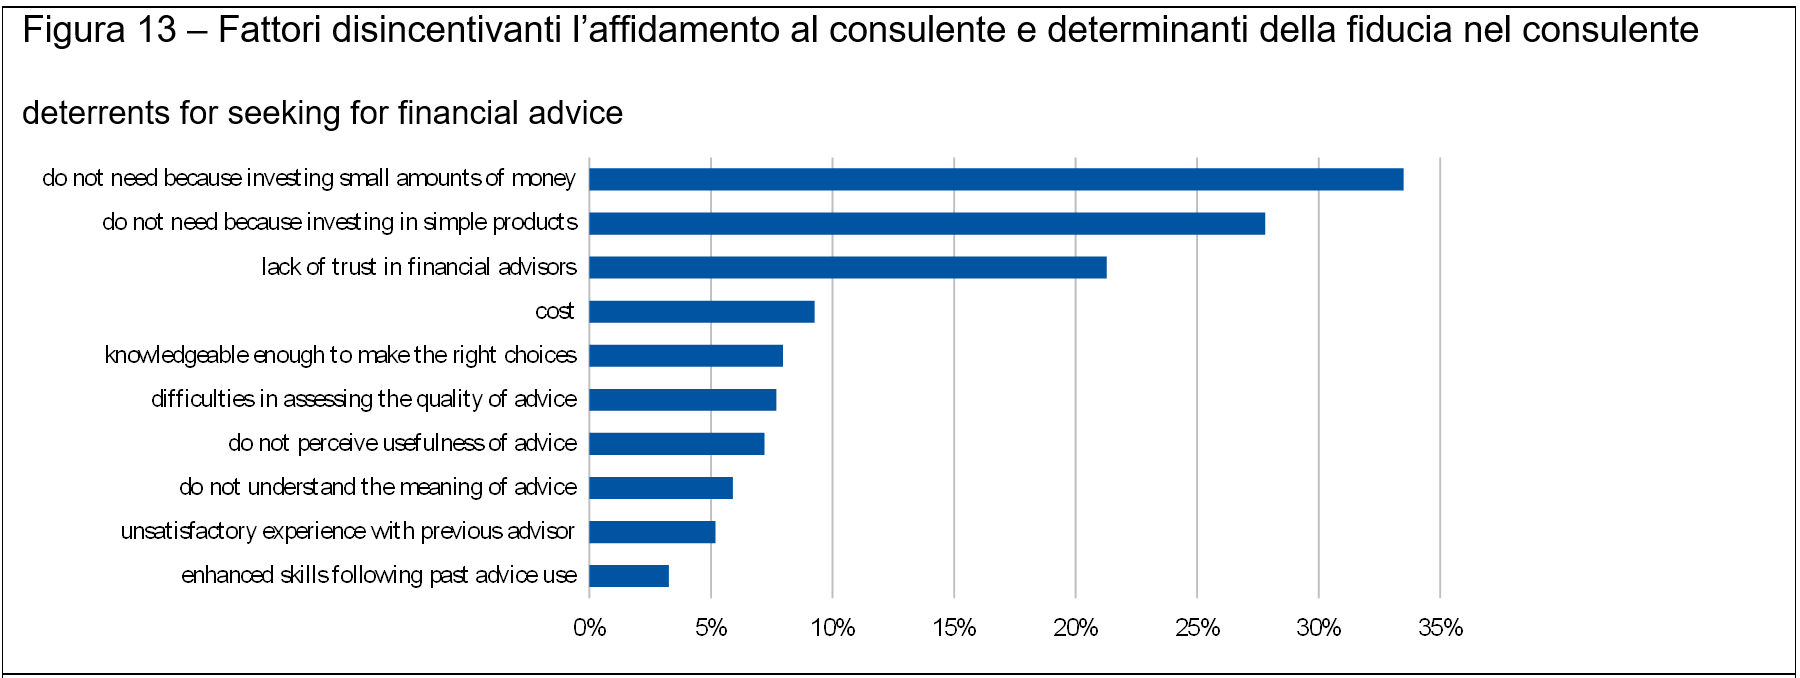
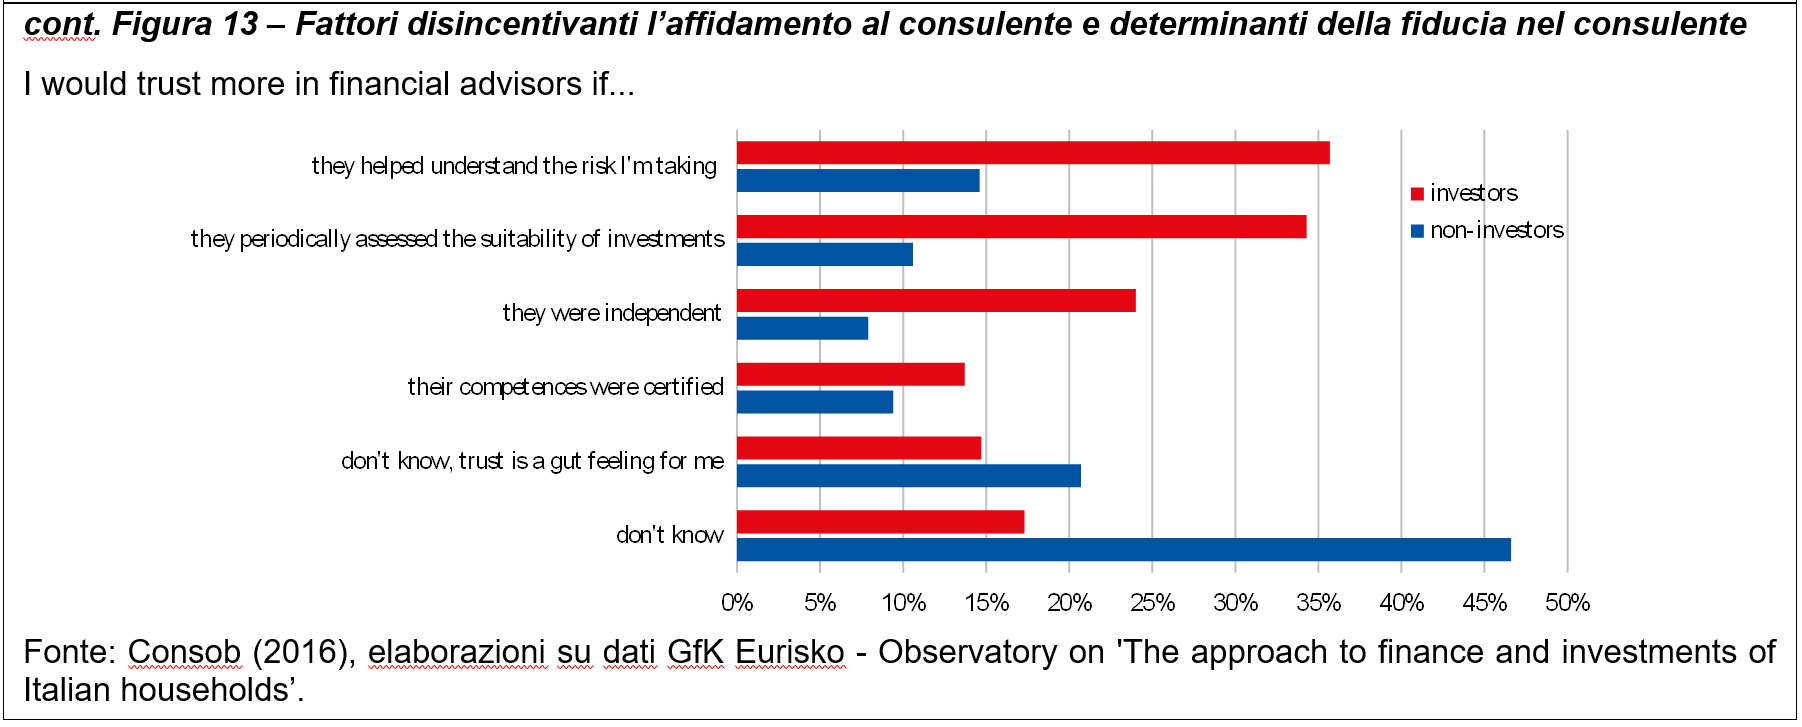
Il ricorso alla consulenza viene scoraggiato, inoltre, dalla dimensione ridotta degli investimenti (34%), dalla consuetudine a investire in prodotti considerati molto semplici (28%) e dalla mancanza di fiducia negli intermediari (22%; Figura 13). Tra i fattori che, in particolare, potrebbero elevare la fiducia riposta nel professionista, gli investitori indicano il suo impegno a guidare i clienti nella comprensione dei rischi e nel monitoraggio degli investimenti (35% circa) nonché l’indipendenza (quasi il 25%) e la certificazione delle competenze (15%). Infine, circa il 15% degli investitori definisce la fiducia come una percezione soggettiva, alimentata dall’istinto piuttosto che da specifiche caratteristiche o abilità del consulente; tale percezione è più diffusa tra i non investitori (21%), che nella metà dei casi non sono comunque in grado di indicare alcun elemento che possa accrescere la propensione ad affidarsi a un esperto.
Note:
– Il presente intervento riprende i temi sviluppati nel Report 2016 sulle scelte di investimento delle famiglie italiane della Consob. Le opinioni espresse sono personali e non impegnano in alcun modo l’Istituzione di appartenenza.
– Il Report fa riferimento ai dati derivanti dall’Indagine Multifinanziaria Retail Market e dall’Osservatorio su ‘L’approccio alla finanza e agli investimenti delle famiglie italiane‘ (GfK Eurisko). Multifinanziaria Retail Market: campione di circa 2.500 famiglie. Osservatorio su ‘L’approccio alla finanza e agli investimenti delle famiglie italiane‘: 1.000 famiglie. In entrambi i casi il decisore finanziario (di età compresa fra 18 e 74 anni) è il percettore di reddito più elevato in famiglia.