

Banca d’Italia and Deutsche Bundesbank shared experiences on distributed ledger technology-based settlements in a workshop…
https://cointelegraph.com/news/eu-central-banks-work-on-dlt-based-asset-settlement
Banca d’Italia and Deutsche Bundesbank shared experiences on distributed ledger technology-based settlements in a workshop…
https://cointelegraph.com/news/eu-central-banks-work-on-dlt-based-asset-settlement
The content-based search engine built on the Cyber protocol is designed to operate with a new type of web interaction…
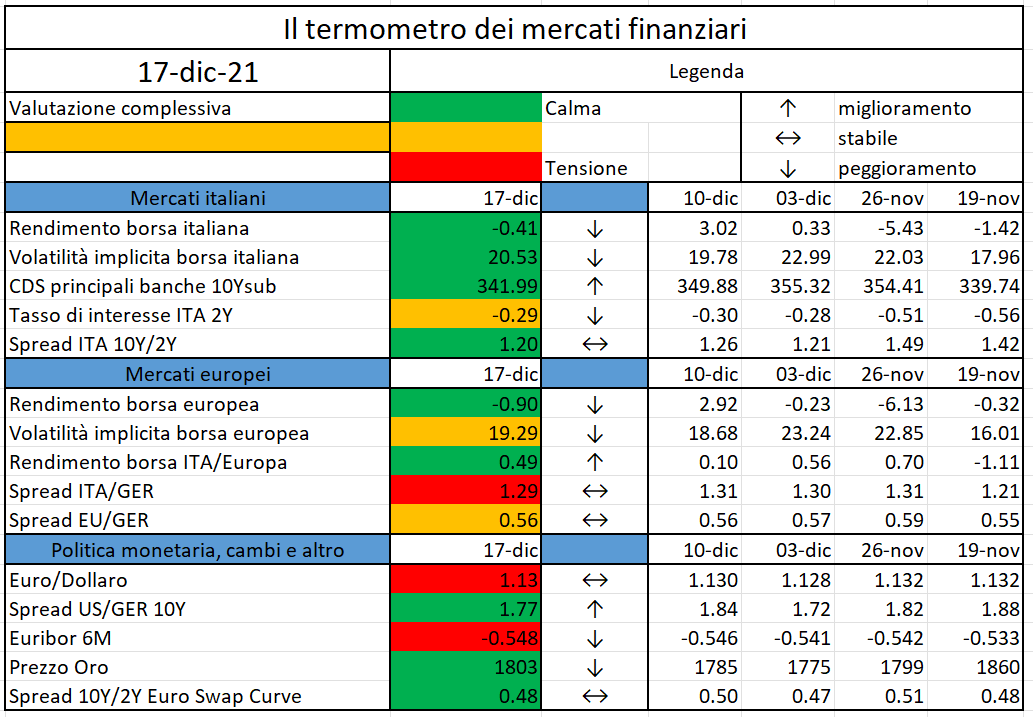
L’iniziativa di Finriskalert.it “Il termometro dei mercati finanziari” vuole presentare un indicatore settimanale sul grado di turbolenza/tensione dei mercati finanziari, con particolare attenzione all’Italia.
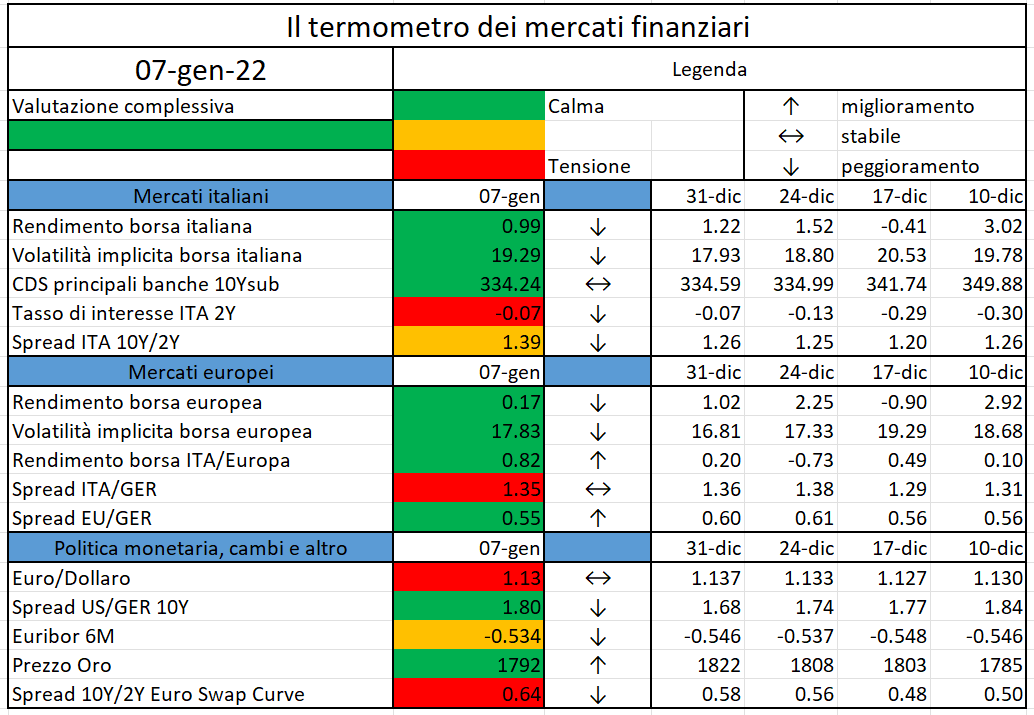
Significato degli indicatori
I colori sono assegnati in un’ottica VaR: se il valore riportato è superiore (inferiore) al quantile al 15%, il colore utilizzato è l’arancione. Se il valore riportato è superiore (inferiore) al quantile al 5% il colore utilizzato è il rosso. La banda (verso l’alto o verso il basso) viene selezionata, a seconda dell’indicatore, nella direzione dell’instabilità del mercato. I quantili vengono ricostruiti prendendo la serie storica di un anno di osservazioni: ad esempio, un valore in una casella rossa significa che appartiene al 5% dei valori meno positivi riscontrati nell’ultimo anno. Per le prime tre voci della sezione “Politica Monetaria”, le bande per definire il colore sono simmetriche (valori in positivo e in negativo). I dati riportati provengono dal database Thomson Reuters. Infine, la tendenza mostra la dinamica in atto e viene rappresentata dalle frecce: ↑,↓, ↔ indicano rispettivamente miglioramento, peggioramento, stabilità rispetto alla rilevazione precedente.
Disclaimer: Le informazioni contenute in questa pagina sono esclusivamente a scopo informativo e per uso personale. Le informazioni possono essere modificate da finriskalert.it in qualsiasi momento e senza preavviso. Finriskalert.it non può fornire alcuna garanzia in merito all’affidabilità, completezza, esattezza ed attualità dei dati riportati e, pertanto, non assume alcuna responsabilità per qualsiasi danno legato all’uso, proprio o improprio delle informazioni contenute in questa pagina. I contenuti presenti in questa pagina non devono in alcun modo essere intesi come consigli finanziari, economici, giuridici, fiscali o di altra natura e nessuna decisione d’investimento o qualsiasi altra decisione deve essere presa unicamente sulla base di questi dati.

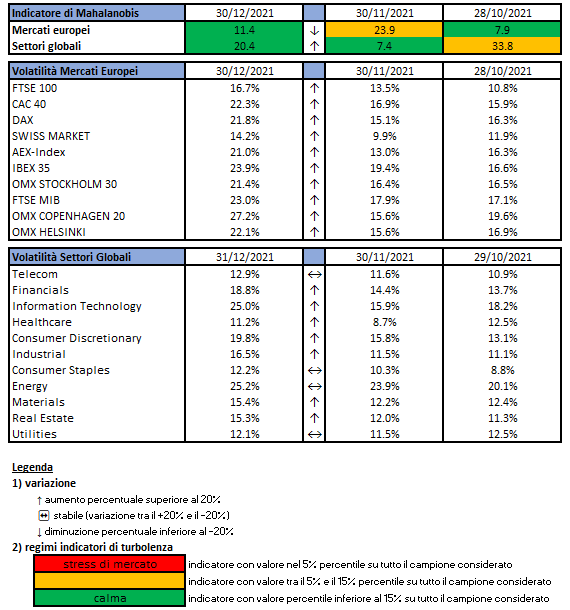
L’indicatore di Mahalanobis permette di evidenziare periodi di stress nei mercati finanziari. Si tratta di un indicatore che dipende dalle volatilità e dalle correlazioni di un particolare universo investimenti preso ad esame. Nello specifico ci siamo occupati dei mercati azionari europei e dei settori azionari globali.

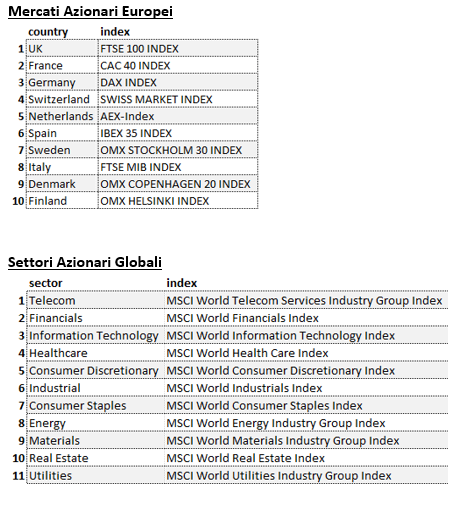
Gli indici utilizzati sono:

Le volatilità riportate sono storiche e calcolate sugli ultimi 30 trading days disponibili. Per ogni asset-class dunque sono prima calcolati i rendimenti logaritmici dei prezzi degli indici di riferimento, successivamente si procede col calcolo della deviazione standard dei rendimenti, ed infine si procede a moltiplicare la deviazione standard per il fattore di annualizzazione.
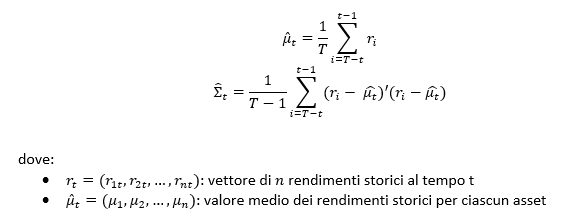
Per il calcolo della distanza di Mahalnobis si procede dapprima con la stima della matrice di covarianza tra le asset-class. Si considera l’approccio delle finestre mobili. Come con la volatilità, si procede prima con il calcolo dei rendimenti logaritmici e poi con la stima storica della matrice di covarianza, come riportato di seguito.
Supponendo una finestra mobile di T periodi, viene calcolato il valore medio e la matrice varianza covarianza al tempo t come segue:

La distanza di Mahalanobis è definita formalmente come:

Le parametrizzazioni che sono state scelte sono:
Le statistiche percentili sono state calcolate a partire dalla distribuzione dell’indicatore di Mahalanobis dal Dicembre 1997 al Dicembre 2019 su rilevazioni mensili.
Ulteriori dettagli sono riportati in questo articolo.
Disclaimer: Le informazioni contenute in questa pagina sono esclusivamente a scopo informativo e per uso personale. Le informazioni possono essere modificate da finriskalert.it in qualsiasi momento e senza preavviso. Finriskalert.it non può fornire alcuna garanzia in merito all’affidabilità, completezza, esattezza ed attualità dei dati riportati e, pertanto, non assume alcuna responsabilità per qualsiasi danno legato all’uso, proprio o improprio delle informazioni contenute in questa pagina. I contenuti presenti in questa pagina non devono in alcun modo essere intesi come consigli finanziari, economici, giuridici, fiscali o di altra natura e nessuna decisione d’investimento o qualsiasi altra decisione deve essere presa unicamente sulla base di questi dati.

Last 22nd September 2021 the European Commission (EC) published a legislative package aimed at amending the SII Directive. The legislative proposal will be now discussed with Member States, Stakeholders, and the European Parliament (EP), which will finalize the legislative process by accepting, rejecting, or modifying the suggestions of the EC. The entire process may last few years. So far, these comments have been made
The review of the Directive started last February 2019, with the European Commission calling EIOPA for advice and the latter publishing its opinion in December 2020, after having drafted several public consultations. The SII review is focused on adapting the current regulation to the new economic context (especially the persistence of low interest rates), with the goal of ensuring a better protection for the policyholders, without penalizing too much the insurance industry. The main areas under the spotlight are:
The EC plans to update the extrapolation of the RFR with a phase-in mechanism lasting until the end of 2031, building on the hints provided by EIOPA and disclosing the details in the Delegated Acts or Regulatory Technical Standards (RTS), only after the finalization of the legislative process.
According to EIOPA, the SII directive should abandon both the LLP (Last Liquid Point) and SW (Smith Wilson) technique in favour of an extrapolation to the UFR (Ultimate Forward Rate) that starts from the FSP (First Smoothing Point). The EC agrees on that and confirms EIOPA’s idea of splitting the Volatility Adjustment (VA) of a certain country j into two parts:
Where:
The EC maintains the incompatibility of the VA with the Matching Adjustment (MA) and requests a prior approval by the NSAs for the VA application by new adopters, provided their demonstration of an adequate implementation process for its calculation. The EC goes along with EIOPA’s suggestions to forbid the use of Dynamic Volatility Adjustment in the SCR standard formula and to increase the prudency principle for internal models applying it.
For what concerns the Risk Margin (RM), criticized by the market as too sensitive to changes in the interest rates and too penalizing, the EC plans to build on EIOPA’s suggestion of multiplying future SCRs by an exponentially decreasing factor, but without setting a floor; it also does not discard the potential reduction of the current 6% CoC value to a 5%. The new formulation will be part of the Delegated Regulation’s update.
Following EIOPA’s advice, the EC confirms its intention to softening the too stringent criteria the insurance companies should meet to classify more equity as LTE (Long Term Equity), benefiting of the low capital charge (22%, almost half of the normal equity holdings) associated to this asset class, introduced back in 2019 with the purpose of helping the sector. The EC also confirms EIOPA’s proposal to extend the Symmetric Adjustment range from -/+10% to -/+17%.
This time, the EC considers EIOPA’s advice of modifying the IR risk calibration into a relative shift approach, with a phase-in mechanism of 5 years, to properly reflect the steep fall of interest rates into negative values, without damaging too much the SII position of the companies. The details of the calculation will be released in an update of the Delegates Acts.
EIOPA’s proposed calibration works as follows:
Where the shocked interest rates in the downward scenario are floored to a minimum of -1.25%. The EC, instead, makes an allowance for extrapolating long term interest rates: for each currency, the stressed risk-free interest rates could be extrapolated towards a stressed UFR, that can be 15 bps lower or higher the ordinary UFR in the stressed scenario.
The EC confirms EIOPA’s proposal of reducing the correlation parameter for spread risk and interest rate risk (downward scenario) from 0.5 to 0.25. This will be done by amending the Delegated Regulation.
Welcoming EIOPA’s advice, the EC details a new structure of the Solvency and Financial Condition Report (SFCR), aimed at improving its outreach. The report is split into two parts: the first addressed to policyholders with a high-level content, while the latter addressed to a professional audience. Furthermore, the SFCR will be subject to a mandatory audit review. For the Regular Supervisory Report (RSR), the EC specifies it should include information on the undertaking’s business and performance, system of governance, risk profile, valuation for solvency purposes and capital management over the reporting period. The EC also extends the solo SFCR and RSR reporting deadline from 14 to 18 weeks and the annual solo QRT deadline from 14 to 16 weeks.
The EC welcomes EIOPA’s proposal to increase and standardize the level of proportionality by passing objective criteria: the GWPs threshold is increased from 5 to 15mln euros and TPs threshold is increased from 25 to 50mln euros.
The EC welcomes EIOPA’s proposal of expanding the SII perimeter to include macroprudential objectives and policies: macroprudential concerns shall be included in the ORSA and liquidity risk management plans shall be drawn up (EIOPA shall draft RTS to specify contents and timing) and a set of liquidity risk indicators shall be defined to identify, monitor, and address potential liquidity stress. The EC also welcomes EIOPA’s advice to invest the NSA with the power of requiring undertakings with a particularly vulnerable risk profile to restrict or suspend payments such as dividend distributions, share buy-backs, bonuses, or other variable remuneration during periods of exceptional sector-wide shocks.
The EC published a Directive’s proposal addressing crisis management to harmonize the rules and processes for recovery and resolutions of undertakings established in the EU and subject to the SII framework. Member States shall set up insurance resolution authorities, insurers shall develop and maintain recovery plans as preventive measures, resolution authorities shall prepare resolution plans. The proposal requires EIOPA to develop ten TS and six Guidelines.
In response to EIOPA’s suggestion to introduce a European network of IGS, with a common minimum set of coverages, funded by all insurance undertakings and meant to protect policyholders either with a monetary compensation or by ensuring the continuation of their policy in case the insurance company becomes insolvent, the EC claims that, considering the economic uncertainties created by the COVID-19 pandemic, as well as the need to focus on economic recovery, any action to align rules for IGS is not appropriate at this juncture, but will be reassessed in the future. In the meantime, the EC published a study, prepared by JRC (Joint Research Centre), the EC’s science and knowledge service, aimed at providing evidence-based scientific support to the European policymaking process. It is a quantitative assessment of several policy options for a possible proposal on the introduction of harmonized rules for IGSs, following up on a previous study developed in 2010. The report invests the size of losses that might hit consumers in each Member State in one-year time horizon and approximates the amount of funding needs which IGS should collect in each country. Results are dependent on the level of the Probability of Default of insurers, and show variation across countries, following the variation in the level of Exposure at Default.
References:
The European Securities and Markets Authority (ESMA), the EU’s securities markets regulator, issued today a Public Statement on investment recommendations made on social media…
La Commissione europea ha adottato una revisione delle norme bancarie dell’UE relative al Regolamento sui requisiti patrimoniali…
The world’s third-largest consumer payment processor remains bullish on the adoption of CBDCs…
L’iniziativa di Finriskalert.it “Il termometro dei mercati finanziari” vuole presentare un indicatore settimanale sul grado di turbolenza/tensione dei mercati finanziari, con particolare attenzione all’Italia.

Significato degli indicatori
I colori sono assegnati in un’ottica VaR: se il valore riportato è superiore (inferiore) al quantile al 15%, il colore utilizzato è l’arancione. Se il valore riportato è superiore (inferiore) al quantile al 5% il colore utilizzato è il rosso. La banda (verso l’alto o verso il basso) viene selezionata, a seconda dell’indicatore, nella direzione dell’instabilità del mercato. I quantili vengono ricostruiti prendendo la serie storica di un anno di osservazioni: ad esempio, un valore in una casella rossa significa che appartiene al 5% dei valori meno positivi riscontrati nell’ultimo anno. Per le prime tre voci della sezione “Politica Monetaria”, le bande per definire il colore sono simmetriche (valori in positivo e in negativo). I dati riportati provengono dal database Thomson Reuters. Infine, la tendenza mostra la dinamica in atto e viene rappresentata dalle frecce: ↑,↓, ↔ indicano rispettivamente miglioramento, peggioramento, stabilità rispetto alla rilevazione precedente.
Disclaimer: Le informazioni contenute in questa pagina sono esclusivamente a scopo informativo e per uso personale. Le informazioni possono essere modificate da finriskalert.it in qualsiasi momento e senza preavviso. Finriskalert.it non può fornire alcuna garanzia in merito all’affidabilità, completezza, esattezza ed attualità dei dati riportati e, pertanto, non assume alcuna responsabilità per qualsiasi danno legato all’uso, proprio o improprio delle informazioni contenute in questa pagina. I contenuti presenti in questa pagina non devono in alcun modo essere intesi come consigli finanziari, economici, giuridici, fiscali o di altra natura e nessuna decisione d’investimento o qualsiasi altra decisione deve essere presa unicamente sulla base di questi dati.