Il nostro obiettivo è valutare il rendimento del nuovo BTP Futura che verrà emesso la prossima settimana dallo Stato Italiano ed è in sottoscrizione presso i risparmiatori retail.
I nuovi BTP Futura saranno emessi alla pari, cioè a 100 Euro, e hanno due caratteristiche principali:
· agli investitori che hanno acquistato il titolo durante il periodo di collocamento e lo detengono fino alla scadenza (8 anni) verrà riconosciuto un premio fedeltà pari alla variazione media annua percentuale del PIL nominale italiano calcolata sul periodo che intercorre tra l’anno di emissione del titolo e l’anno precedente quello di scadenza del titolo. Il premio finale non potrà essere inferiore all’1% e non potrà eccedere il 3%. Tale premio si applicherà al valore nominale che sarà rimborsato nel 2028.
· Cedole semestrali con meccanismo step-up, cioè a tasso crescente. In particolare i tassi minimi, così come definiti Venerdì 6 Novembre saranno
o 0,35% dal 1° al 3° anno
o 0,60% dal 4° al 6° anno
o 1,00% dal 7° all’ 8° anno.
I tassi cedolari definitivi saranno annunciati alla chiusura del collocamento, non potranno comunque essere inferiori ai tassi cedolari minimi garantiti appena annunciati.
Si tratta della seconda emissione dei BTP futura: della prima emissione, con un titolo decennale, avevamo parlato qui . Sul premio fedeltà rimandiamo all’analisi del precedente articolo: la nostra analisi, questa volta su un orizzonte di 8 anni, indica che la probabilità che la variazione media annua del PIL sia
· inferiore all’1% è pari all’73.85%,
· fra l’1% e l’1.5% è 17.96%,
· fra l’1.5% e il 2% è 6.61%,
· fra 2% e il 3% è 1.57%,
· superiore o uguale al 3% è trascurabile (0.0093%).
Pertanto, secondo le nostre simulazioni, il premio fedeltà sarà pari a 1% con una probabilità del 74%. Sottolineiamo che l’ultimo dato disponibile utilizzato è stato il PIL del 2019, quindi questi dati non tengono in considerazione l’effetto COVID.
Ipotizzando le cedole pari al valore minimo annunciato Venerdì 6 Novembre, consideriamo quattro scenari:
1. Assenza di premio fedeltà
2. Premio fedeltà minimo (1%)
3. Premio fedeltà pari al 2%
4. Premio fedeltà massimo (3%)
Nel primo caso, valutando il titolo ai dati di mercato del 5 Novembre 2020 (curva dei tassi di interesse dei titoli di Stato italiani), il prezzo di mercato del titolo risulta essere pari a 101.46, quindi, a differenza del titolo precedente che era emesso alla pari, il valore del titolo è leggermente superiore al prezzo di emissione. Il tasso interno di rendimento del titolo (rendimento) è 0.6%, paragonabile al rendimento decennale di un BTP italiano oggi (ricordiamo però che questo BTP futura ha una durata di 8 anni), mentre un BTP a 8 anni ha un rendimento dello 0.45%. Quindi, il BTP futura – anche in assenza del premio fedeltà – avrà un rendimento superiore a quello di mercato a differenza di quanto accadde nella prima emissione.
Nel secondo scenario il prezzo di mercato del titolo è pari a 102.43: l’investitore che compra questi titoli con la certezza di detenerli fino a scadenza li compra a sconto rispetto al loro valore effettivo. In questo caso il rendimento del titolo è pari a 0.73%. Il rendimento del titolo passa allo 0.85% ipotizzando una variazione media del Pil pari al 2%, e allo 0.97% se la variazione sarà pari o superiore al 3%.
Possiamo quindi concludere che, se verranno confermate le cedole annunciate, il nuovo BTP Futura ha un rendimento leggermente superiore ad un classico BTP a 8 anni, in linea con il decennale, nel caso di assenza
di premio di fedeltà. Il premio fedeltà corrisponde ad un aumento del rendimento di 13 punti base nel caso più probabile (premio fedeltà pari a 1%).
FinTech — technology-enabled innovation in financial services — have developed significantly over recent years and are significantly transforming the way financial services are provided. FinTech solutions using Artificial Intelligence, big data, DLT, cloud computing, quantum computing etc. – coupled with easier mobile access and increased internet speed and bandwidth – are leading the emergence of new business models, applications, processes and products, with an associated material effect on financial markets and institutions.
The pandemic crisis has accelerated this trend, leading to a further digitalization and transformation of banking and financial institutions. The necessity of adjusting operations, in order to ensure business continuity and the uninterrupted provision of cross-border services, has highlighted the need for mature digital capabilities that can withstand high levels of remote working and provide continuous service to banking IT infrastructure.
Sector transformation. The wave of innovation, coupled with the pandemic crisis, is helping to transform the financial sector, with potential benefits for the global financial system. Fintech would allow increasing efficiency in delivering financial services, widening their range, boosting competition and promoting financial inclusion. New players are entering the financial market and providing services at lower costs, creating new products tailored to customer’s needs, and changing the way credit is extended and investment advice is provided.
However, such an accelerated disruptive wave comes with potentially significant risks. The massive and inevitable shift to digitalization increases financial institutions’ exposure to cyber threats and IT failures.
In light of this changing landscape, regulatory authorities have to face the challenge of balancing innovation – and its benefits to society – with their mandate of safeguarding the safety of financial markets. The key to deal with this challenge is to move operational resilience and cybersecurity up on the regulatory agenda, and require banks and financial institution to adopt effective IT risk management processes and controls to address new sources of risk.
New sources of risk
Regulators have to deal with a new ecosystem, where licensed banks and financial institutions stand next to Big-tech or non-bank Fintech (likely start-ups).
The entrance of Big-tech companies in the financial markets presents interesting risks. Big-tech have the potential to quickly gain significant market share, which could lead to concentration risks that, in the event of operational failures or cyberattacks, could have a systemic impact on the financial system as a whole. Moreover, the presence of such companies in many countries could result in different levels of supervisory scrutiny, reducing the insight of prudential supervisors into the type and scale of financial activities taking place in other jurisdictions, with the consequence that operational problems that arise in a country with low supervision may spread regionally or even globally.
On the other hand, non-bank Fintech – especially start-ups – face budget constraint and often have minimal risk governance, and may be less capable of complying with the complex and demanding regulations of the financial sector.
Moreover, both Big-tech and non-bank Fintech introduce innovative technologies, which have often not been intensively market-tested and thus are inherently more risky from an operational perspective.
An additional significant challenge is that these new players will create more operational complexity, adding intermediaries in the financial sector and increasing third-party dependencies. It is incumbent on financial institutions to keep pace with emerging technology, and customer demands for collaboration with non-bank Fintech or big tech companies to deliver certain products. Sometimes, to ensure a more effective service, they must even outsource critical functions to third party.
The risk of these partnerships is that the dependence from external technology providers increases the available attack surface, and increases the likelihood of cascading failures in the event of a successful attack or IT failure.
How Regulators are keeping the pace?
Principle of same activity, same regulation. A widely accepted principle, inspiring many recent regulatory developments, is that of “same activity, same regulation”, which aims at minimizing entities’ regulatory arbitrage. Emerging technology allows new players to perform activities that were previously conducted only by tightly regulated institutions. The collaboration with non-bank Fintech or Big-tech companies (e.g. for the outsourcing of critical functions or the delivery of certain products) could lead to the shift of risk-generating business activities between entities in search of lighter regulatory control.
To keep pace with the disruptive wave, regulators must move from institution-based regulation to activities-based regulation (i.e. the same activity creating the same risks should be regulated by the same rules, regardless of who is undertaking it). The goal is the creation of a level playing field between incumbents and new market entrants, where all entities involved in a specific regulated activity should be subject to the same rules, regardless of their nature or legal status.
The Achilles heel of this principle is that the same activity may generate different risks depending on who performs it. For example, Big-tech perform financial activities along with a wider business portfolio, thus they could generate systemic risks not only from strictly financial activities, but also through the risks generated by each activity of their business portfolio. It could be argued that a stricter supervisory focus on these entities is needed, but this would again be a departure from the principle of same activity, same regulation.
Activity-based regulation cannot preserve by itself the safety of financial markets in this new technological environment. Nevertheless, it should be considered a complement to institution-based regulation, rather than a substitute for it.
adapting regulation for technology, and technology for regulation. Another leading principle that is driving regulators is adapting regulation for technology, and technology for regulation. Such a principle responds to the need to keep regulation agile in the face of new and changed risks caused by the use of innovative technologies, and at the same time seize any emerging opportunities.
Such a principle is embedded in the creation of innovation hubs and regulatory sandboxes, and it is the response of supervisory authorities to the introduction of innovative technologies that have not been intensively market-tested.
The provision of a space for an open dialogue on innovative applications is a useful way to, on one hand, encourage banks and financial institutions to launch innovative solutions and, on the other hand, to control (and test) the impact of new technologies in the market. Entities, in the safe environment of innovation hubs and regulatory sandboxes, may experiment with new financial products or services in a defined space and time, while limiting the consequences of possible failure.
This scheme enables supervisory authorities to monitor innovation activities, understand related risks, and foster innovation in a level playing field.
Suptech. Supervisory technology (Suptech) is the use of innovative technologies by supervisory Authorities to support supervision. Suptech would be the best way through which regulators could ride the disruptive wave.
Policymakers should seize the opportunity to explore Suptech and gauge where it can make the most impact. It could be applied, for example, in the area of data collection (e.g. automated reporting, real time monitoring) and data analytics (e.g. market surveillance, misconduct analysis, micro/macro prudential supervision).
Suptech can be used to enhance effectiveness, reduce costs and improve capabilities. It could potentially transform risk and compliance monitoring since, as technology develops, it will be possible to anticipate the behavior of regulated entities and their risk exposure. Suptech will never be able to replace human ability to catch nuances and subtleties but, through data collection and analytics, it can enrich, support and complement supervisory judgement (e.g. detecting AML and CFT infringements, or identifying fraud through detection of unusual transactions, relationships and networks).
Suptech examples. In light of the above, several institutions around the globe are adopting emerging tech to regulate the evolving financial markets.
The Monetary Authority of Singapore (MAS) has set up a team focused on data analytics in the AML/CTF sector. The team has applied network analysis techniques to suspicious transaction reports, supplemented by data collected from financial institutions and intelligence from law enforcement, in order to identify networks of suspicious activity across the financial sector. As stated by MAS at a conference in 2019: “We are working to add transactional information to this dataset, and augmenting our capabilities with natural language processing and machine learning tools to more effectively detect and prioritise networks for scrutiny.”
Another example of such trend is that the Bank Innovation Hub (through its Singapore Centre) and the Saudi G20 Presidency have launched the TechSprint initiative to highlight the potential of new technology to tackle regulatory and supervisory challenges, and have invited private firms to develop innovative technological solutions.
Conclusion
In this rapidly evolving environment, a continuous dialogue between market players and supervisory authorities is essential, in order to encourage information and knowledge sharing and enhance collective understanding of innovative technologies, while also considering the global scope and scale of the innovation and business models of many new players. Regulators should plan a market intelligence strategy that set out a clear roadmap with actions to keep pace with this environment.
These actions must include:
Targeted amendments to legislation and policies.
Cross-border initiatives.
Cooperation with other supervisory authorities and key players.
Incorporation of supervisory technologies (Suptech) as a core strategic element of banking supervision.
In riding the disruptive wave, regulators have to continuously adapt their supervisory approach to the new needs of the financial market. Their continuing challenge is to promote a common understanding of Fintech-related risks and assess the potential impact of these new activities on consumers and investors, while also avoiding any unduly-restrictive action that would inhibit the development of new and promising innovations.
Financial authorities have the new scope of ensuring financial stability and the soundness of the market, while also foreseeing the potential societal benefits of strengthening innovation, financial development, inclusion and efficiency.
Andrea Rigoni – Cyber Risk Partner, Government and Public Services, at Deloitte Risk Advisory S.r.l.
Expert Group on Regulatory Obstacles to Financial Innovation (ROFIEG), “Thirty Recommendations on Regulation, Innovation and Finance”, Final Report to European Commission, 13 December 2019
BIS, Basel Committee on Banking Supervision, Sound Practices, “Implications of fintech developments for banks and bank supervisors”, February 2018
Dirk Broeders, Jermy Prenio, BIS, Financial Stability Institute, FSI Insights on policy implementation No 9 “Innovative technology in financial supervision (suptech) – the experience of early users”, July 2018
European Commission, “FinTech Action plan: For a more competitive and innovative European financial sector”, 8 March 2018
Financial Stability Board, “FinTech and market structure in financial services: Market developments and potential financial stability implications”, 14 February 2019
Johannes Ehrentraud, Denise Garcia Ocampo, Lorena Garzoni, Mateo Piccolo, BIS, Financial Stability Institute, FSI Insights on policy implementation No 23 “Policy responses to fintech: a cross-country overview”, January 2020
World Bank, Cambridge Centre for Alternative Finance, “Regulating Alternative Finance: Results From A Global Regulator Survey”, 2019
Johannes Ehrentraud, Denise Garcia Ocampo, Camila Quevedo Vega, BIS, Financial Stability Institute, FSI Insights on policy implementation No 9, “Regulating fintech financing: digital banks and fintech platforms”, August 2020
Fernando Restoy, BIS, Regulating fintech: what is going on, and where are the challenges?, October 2019
European Central Bank, “ESCB/European banking supervision response to the European Commission’s public consultation on a new digital finance strategy for Europe/FinTech action plan”, August 2020
The report Implementation monitoring of PFMI: Level 2 assessment report for Brazil released today by the Committee on Payments and Market Infrastructures…
Fintech in Latin America is greeting the dawn. We take stock of how it is transforming financial services in the region. First, we describe the fintech landscape in terms of investment, firms and services provided…
L’indicatore di Mahalanobis permette di evidenziare periodi di stress nei mercati finanziari. Si tratta di un indicatore che dipende dalle volatilità e dalle correlazioni di un particolare universo investimenti preso ad esame. Nello specifico ci siamo occupati dei mercati azionari europei e dei settori azionari globali.
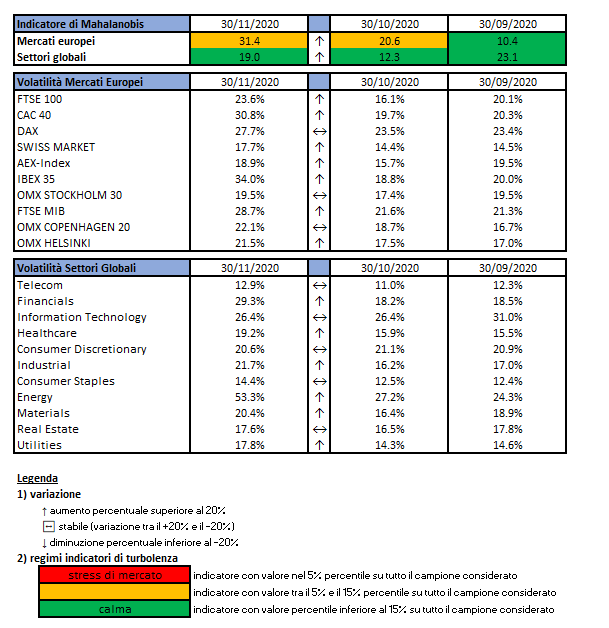
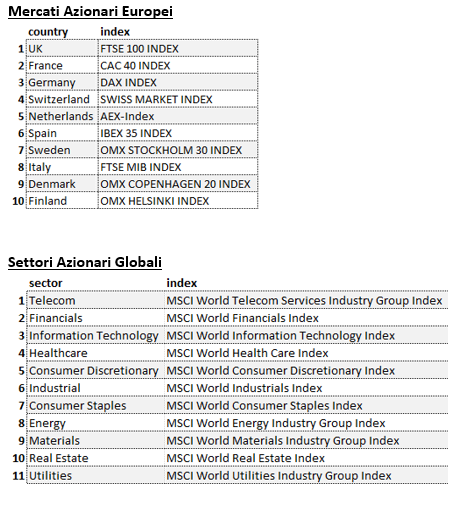
Gli indici utilizzati sono:
Le volatilità riportate sono storiche e calcolate sugli ultimi 30 trading days disponibili. Per ogni asset-class dunque sono prima calcolati i rendimenti logaritmici dei prezzi degli indici di riferimento, successivamente si procede col calcolo della deviazione standard dei rendimenti, ed infine si procede a moltiplicare la deviazione standard per il fattore di annualizzazione.
Per il calcolo della distanza di Mahalnobis si procede dapprima con la stima della matrice di covarianza tra le asset-class. Si considera l’approccio delle finestre mobili. Come con la volatilità, si procede prima con il calcolo dei rendimenti logaritmici e poi con la stima storica della matrice di covarianza, come riportato di seguito.
Supponendo una finestra mobile di T periodi, viene calcolato il valore medio e la matrice varianza covarianza al tempo t come segue:
La distanza di Mahalanobis è definita formalmente come:
Le parametrizzazioni che sono state scelte sono:
Rilevazioni mensili
Tempo T della finestra mobile pari a 5 anni (60 osservazioni mensili)
Le statistiche percentili sono state calcolate a partire dalla distribuzione dell’indicatore di Mahalanobis dal Dicembre 1997 al Dicembre 2019 su rilevazioni mensili.
Disclaimer: Le informazioni contenute in questa pagina sono esclusivamente a scopo informativo e per uso personale. Le informazioni possono essere modificate da finriskalert.it in qualsiasi momento e senza preavviso. Finriskalert.it non può fornire alcuna garanzia in merito all’affidabilità, completezza, esattezza ed attualità dei dati riportati e, pertanto, non assume alcuna responsabilità per qualsiasi danno legato all’uso, proprio o improprio delle informazioni contenute in questa pagina. I contenuti presenti in questa pagina non devono in alcun modo essere intesi come consigli finanziari, economici, giuridici, fiscali o di altra natura e nessuna decisione d’investimento o qualsiasi altra decisione deve essere presa unicamente sulla base di questi dati.
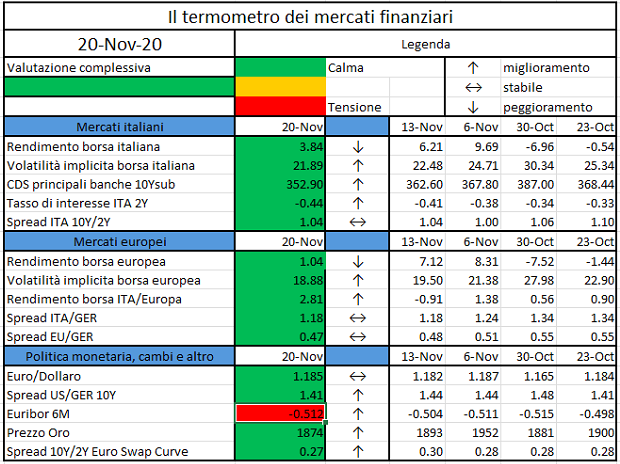
L’iniziativa di Finriskalert.it “Il termometro dei mercati finanziari” vuole presentare un indicatore settimanale sul grado di turbolenza/tensione dei mercati finanziari, con particolare attenzione all’Italia.
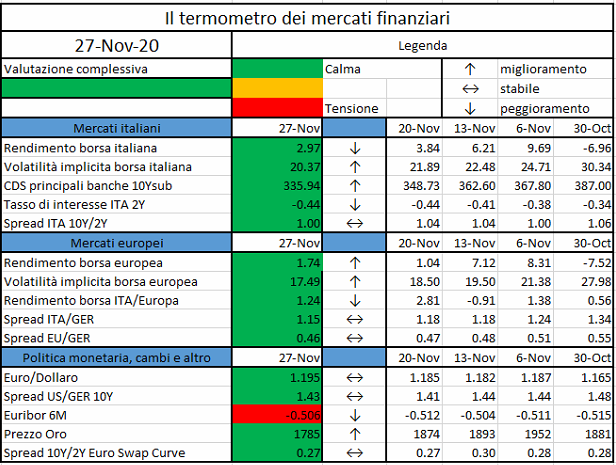
Significato degli indicatori
Rendimento borsa italiana: rendimento settimanale dell’indice della borsa italiana FTSEMIB;
Volatilità implicita borsa italiana: volatilità implicita calcolata considerando le opzioni at-the-money sul FTSEMIB a 3 mesi;
Future borsa italiana: valore del future sul FTSEMIB;
CDS principali banche 10Ysub: CDS medio delle obbligazioni subordinate a 10 anni delle principali banche italiane (Unicredit, Intesa San Paolo, MPS, Banco BPM);
Tasso di interesse ITA 2Y: tasso di interesse costruito sulla curva dei BTP con scadenza a due anni;
Spread ITA 10Y/2Y : differenza del tasso di interesse dei BTP a 10 anni e a 2 anni;
Rendimento borsa europea: rendimento settimanale dell’indice delle borse europee Eurostoxx;
Volatilità implicita borsa europea: volatilità implicita calcolata sulle opzioni at-the-money sull’indice Eurostoxx a scadenza 3 mesi;
Rendimento borsa ITA/Europa: differenza tra il rendimento settimanale della borsa italiana e quello delle borse europee, calcolato sugli indici FTSEMIB e Eurostoxx;
Spread ITA/GER: differenza tra i tassi di interesse italiani e tedeschi a 10 anni;
Spread EU/GER: differenza media tra i tassi di interesse dei principali paesi europei (Francia, Belgio, Spagna, Italia, Olanda) e quelli tedeschi a 10 anni;
Euro/dollaro: tasso di cambio euro/dollaro;
Spread US/GER 10Y: spread tra i tassi di interesse degli Stati Uniti e quelli tedeschi con scadenza 10 anni;
Prezzo Oro: quotazione dell’oro (in USD)
Spread 10Y/2Y Euro Swap Curve: differenza del tasso della curva EURO ZONE IRS 3M a 10Y e 2Y;
Euribor 6M: tasso euribor a 6 mesi.
I colori sono assegnati in un’ottica VaR: se il valore riportato è superiore (inferiore) al quantile al 15%, il colore utilizzato è l’arancione. Se il valore riportato è superiore (inferiore) al quantile al 5% il colore utilizzato è il rosso. La banda (verso l’alto o verso il basso) viene selezionata, a seconda dell’indicatore, nella direzione dell’instabilità del mercato. I quantili vengono ricostruiti prendendo la serie storica di un anno di osservazioni: ad esempio, un valore in una casella rossa significa che appartiene al 5% dei valori meno positivi riscontrati nell’ultimo anno. Per le prime tre voci della sezione “Politica Monetaria”, le bande per definire il colore sono simmetriche (valori in positivo e in negativo). I dati riportati provengono dal database Thomson Reuters. Infine, la tendenza mostra la dinamica in atto e viene rappresentata dalle frecce: ↑,↓, ↔ indicano rispettivamente miglioramento, peggioramento, stabilità rispetto alla rilevazione precedente.
Disclaimer: Le informazioni contenute in questa pagina sono esclusivamente a scopo informativo e per uso personale. Le informazioni possono essere modificate da finriskalert.it in qualsiasi momento e senza preavviso. Finriskalert.it non può fornire alcuna garanzia in merito all’affidabilità, completezza, esattezza ed attualità dei dati riportati e, pertanto, non assume alcuna responsabilità per qualsiasi danno legato all’uso, proprio o improprio delle informazioni contenute in questa pagina. I contenuti presenti in questa pagina non devono in alcun modo essere intesi come consigli finanziari, economici, giuridici, fiscali o di altra natura e nessuna decisione d’investimento o qualsiasi altra decisione deve essere presa unicamente sulla base di questi dati.
Switching-on TVs, radios, websites and reading newspapers worldwide in the last month the first news has been the COVID-19.
According to the World Health Organization the Coronavirus disease (COVID-19 the abbreviation) is an infectious disease caused by a newly discovered coronavirus.
The best way to prevent and slow down transmission is be well informed about the COVID-19 virus, the disease it causes and how it spreads. Protect ourselves and others from infection by washing your hands or using an alcohol based rub frequently and not touching your face…
Prevent and slow down transmission are the key elements to stop the pandemic that in this moment, according to the Center for Systems Science and Engineering (CSSE) at Johns Hopkins University, has more than 5 million of confirmed cases and nearly 400 thousand victims in the world.
Beside the human tragedy the greatest implications of this virus are the financial ones: since Wuhan lockdown (23th of January 2020) the MSCI World Index[1] of global stocks lost more than the 15% while the US Treasury bond yield lost more than 1 point. Financial shortage for all size firms and workers, rather than the uncertainty for the so called Phase 2 (the lockdown end) and the recovery phase are characterizing this period and are in the middle of the economic and political debate with a focus on the central banks strategies and provisions.
In Europe, in particular, there is a huge debate – sometimes fed for political purpose – on the instrument to avoid the economic shortage of the member countries and organize a sort of Marshall Plan to recover from the financial and economic consequences of the pandemic.
One of the instrument that could bring together the different positions is the Repurchase Agreement. The open repo (a repo without a specified end-date) can provide immediately liquidity to the European Countries posting as collateral bonds issued by themselves, leaving the reverse exchange of liquidity vs collateral (the end of the contract) in a second phase that will be agreed in accordance at the evolution of the pandemic situation.
Repo Market is the short term for Repurchase Agreement Market. A borrower of cash sells securities (the collateral) to the lender and agrees to buy them back later at a pre-specified price. Typical borrowers of cash are asset managers, pension funds, banks and insurance companies. Typical lenders of cash are money market funds and corporate treasurers. A repurchase agreement is a form of short-term borrowing for dealers in government securities. In the case of a repo, a dealer sells government securities to investors, usually on an overnight basis, and buys them back the following day at a slightly higher price. That small difference in price is the implicit overnight interest rate. Repos are typically used to raise short-term capital and they are intermediated by large broker-dealers, who are also significant repo users in their own right, to finance market-making inventory, source short-term funding or invest cash.
Repo are generally considered safe investments because the security in question functions as collateral. Classified as an instrument, a repurchase agreement functions in effect as a short-term, collateral-backed, interest-bearing loan. The buyer acts as a short-term lender, while the seller acts as a short-term borrower. The securities being sold are the collateral. Thus the objects of both parties, secured funding and liquidity, are met.
Repo markets key functions:
Facilitate the borrowing and lending of cash (Market segments: general collateral GC repo). Repos are an attractive option for lenders seeking to place cash, because the collateral they receive (including haircuts and margin calls) mitigates credit risk.
Improve the circulation of collateral or the exchange (swap) of collateral (Market segments: specific collateral SC repo). Lenders of cash can obtain specific securities (for speculation, to cover short positions…) for the repo’s duration, while lenders of the securities improve their portfolio liquidity without an outright sale.
Enabling investors to monetize liquid assets, banks and other financial institutions use repos in liquidity management to cover temporary shortfalls in cash flows
Providing a low-risk option for cash investment, Reverse repos are a very flexible liquid investment that can be structured as one-day transactions that can be rolled over.
Transformation of Collateral
Supporting cash market efficiency and liquidity
Facilitating hedging of risk
Central Banks’ instrument in the conduct of monetary policy operation
In order to determine the true costs and benefits of a repurchase agreement, a buyer or seller interested in participating in the transaction must consider three different calculations:
1)Cash paid in the initial security sale
2) Cash to be paid in the repurchase of the security
3) Implied interest rate
The cash paid in the initial security sale and the cash paid in the repurchase will be dependent upon the value and type of security involved in the repo. In the case of a bond, for instance, both of these values will need to take into consideration the clean price and the value of the accrued interest for the bond.
There are three main types of repurchase agreements:
Third-party repo(The most common type, also known as a tri-party repo). In this arrangement, a clearing agent or bank conducts the transactions between the buyer and seller and protects the interests of each. It holds the securities and ensures that the seller receives cash at the agreement offset, and that the buyer transfers funds for the benefit of the seller and delivers the securities at maturation. In addition to taking custody of the securities involved in the transaction, these clearing agents also value the securities and ensure that a specified margin is applied. They settle the transaction on their books and assist dealers in optimizing collateral. What clearing banks do not do, however, is act as matchmakers; these agents do not find dealers for cash investors or vice versa, and they do not act as a broker.
Specialized delivery repo. The transaction requires a at the beginning of the agreement and upon maturity. This type of agreement is not very common.
Held-in-custody repo. The seller receives cash for the sale of the security, but holds it in a for the buyer. This type of agreement is even less common because there is a risk the seller may become and the borrower may not have access to the collateral.
Essential terms to be affirmed in a Repo, are:
Transaction date
Purchase Date
Repurchase Date or whether the repo is open
Collateral (ISIN)
Nominal value of collateral
Market value of collateral
Purchase Price
Repo rate or (for open and floating-rate repos) interest rate index and spread
Currency of Purchase Price
Repurchase transactions are quoted in terms of the repo rate, that is, the percentage per annum rate of return on the Purchase Price to be paid by the Buyer to the Seller on the Repurchase Date (or, in the case of some open repos and floating-rate repos, on interim payment dates). The repo rate should be quoted on the basis of the day count and annual basis convention (also called the day count fraction convention) prevailing in the wholesale money market in the currency of the Purchase Price (notably, in the deposit and forward foreign exchange markets). This is almost always the actual day count and 365-day annual basis (A/365F) or the actual day count and 360-day annual basis (A/360). Parties to a repurchase transaction conventionally agree the Purchase Price of fixed-income securities in terms of the dirty or gross price of the collateral (that is, including the accrued interest since the last coupon date). The Purchase Price of a repurchase transaction also incorporates any initial margin or Haircut.
Bond repo markets developed in the G10 countries at different times– in the 1920s in the United States, the 1970s in continental Europe and the 1990s in the United Kingdom.
Monetary authorities used them as a monetary policy tool to increase the depth, liquidity and price efficiency of markets. Data reported by 19 primary dealers (banks and broker-dealers that may trade in US government securities directly with the FED) and around 1,000 bank holding companies suggest that by mid-2008 the gross market capitalization of the US repo market exceeded $10 trillion (including double-counting of repos and reverse repos). The primary dealers are the most active participants, and use repos to finance much of the growth of their balance sheets, creating procyclical leverage and an exposure to refinancing risk (Adrian and Shin (2008)). The top US investment banks funded roughly half of their assets using repo markets, with additional exposure due to off-balance sheet financing of their customers. While the US repo market is dominated by trading in US Treasuries, there are also active markets in bonds issued by US government-sponsored agencies, agency mortgage-backed securities (MBS) and corporate bonds. Prior to the crisis, non-government collateral contributed significantly to the rapid growth of the US repo market.
The euro area repo market (Figure 1) has also grown sharply, more than doubling in size (2002-2007) to reach more than €6 trillion outstanding (or around 65% of euro area GDP). Two thirds of the collateral is central government bonds from euro area countries, 16% from other euro area entities and 12% from other OECD countries. In terms of country of issuance, German collateral makes up one quarter of the market, followed by Italian at 13%, French at 11% and other euro area at 15%. Whereas there are more than 7,500 banking participants, activity is highly concentrated, with the top 20 banks accounting for 80% of activity.
Two thirds of repos have a maturity of one month or shorter, with the rest up to one year. Around half of euro repos are transacted directly between counterparties, while the remainder are brokered using either voice brokers or an electronic trading platform.
After years of fluctuations due to financial regulations strengthen and market seasonality in 2019 the “European repo market survey”, suggests the recovery of the market – that started in 2016 – has paused, albeit close to its record level. The slowdown in the repo market may have reflected the impact on financial markets of increased uncertainty in the global economy and the effect of inverting yield curves on fixed-income trading.
One exception to this was Italian government bonds, which continued to recover share in the repo market and performed very strongly in the first-half of 2019. Italian securities have been favored by investors in their search for yield, German securities on the other hand look to have suffered from increasingly negative yields.
In US, following the much publicized spike in repo rates in September, there was understandably a lot of focus on how the market would behave over year-end. The extent of market nervousness was reflected in the return being priced around 4% up until a month before the date. However, the Federal Reserve’s attempts to keep bank reserves comfortably above the $1.5tn mark (Figure 5), through its open market operations and bill purchases, has proved successful in stabilizing money rates, and was further bolstered by an injection of increased liquidity over year-end (Figure 6). This also seems to have prompted a transfer of balance sheet by US banks from their European business to the US, providing for improved intermediation capacity.
In Europe the market is more fragmented than the US one: in the end of 2019, German GC for the turn (essentially the benchmark rate for year-end funding costs) was being priced in a -1.25/-1.75 range; more expensive than the -0.50 level where it has been trading normally, but notably cheaper than in advance of previous year-ends. As the year-end date rolled into spot-next (S/N), this began to cheapen through-1.00, and it soon became apparent that unlike previous year-ends, there was not the usual abundance of cash and shortage of collateral, and that banks’ balance sheets were relatively long collateral. As the date rolled into tom-next (T/N), which is the most active date for euro GC, rates cheapened further to average around-0.50, in line with the ECB Deposit Rate (Figure 7). French GC (which has very much become the substitute European ‘safe asset’) followed this pattern closely, only printing at slightly cheaper levels.
German and French specifics tracked the cheapening in GC, with the S/N levels averaging around 1% (which is reflected in the RepoFunds Rates – Figure 10). Accordingly, specials premium was much lower than previous year-ends. There was some short interest in the futures contracts’cheapest to deliver (CTD) bonds, in particular the 2yr (Schatz 0% 12/21) and 10yr (Bund 0.25% 2/29), although dealers report that the implied CTD repo rates remained relatively stable at around -0.702 which was not expensive enough to prompt significant selling. The most expensive specials levels are illustrated in Figure 8. Meanwhile the most expensive French specials (Figure 9) traded between -0.90 and -1.00.
Periphery GC rates tend to cheapen over year-end, in particular Italy, and 2019 was no exception although the moves were relatively range bound. Italy GC averaged -0.30, around 17bp cheaper than usual levels (Figure 10), with specifics around 5to 10bp more expensive (Figure 11). This relatively modest cheapening of Italian collateral was slightly surprising in light of the reserve tiering provisions, that were expected to drive more excess cash held by Italian banks out of Europe’s biggest domestic repo market and into higher yielding bank reserves, putting further upward pressure on Italian repo rates. Italian GC rates, however, have otherwise remained stubbornly close to the ECB Deposit Rate. Meanwhile, Spain GC traded around the -0.50 level (unchanged), with Spanish specifics averaging around -0.60.
As shown in the table below since 2013 the usage of Italian collateral has increased surpassing France and reducing the gap with Germany; this positive trend has been possible thanks to the stable outlook given by the rating agencies during the last years, the higher premium paid on Italian instrument than the other paid by the other European countries and the quantitative easing program undertaken by the ECB to sustain the European economy.
At the end of 2019 the Covid-19, in a completely unexpected way, has manifested itself affecting our life in all its aspects. The global lockdown of people and countries, the global disruption of working activities, the cessation of production and consumption, in combination with other factors, are leading us towards the COVID-19 financial crisis. As seen in the last 10 years, once again the Central Banks are in the middle of the pandemic economic and financial implications management.
FED and ECB have seen the liquidity as the most crucial factor to be managed. As shown by the analyses in the previous paragraphs, the Repurchase Agreement and the Repo Market have a key function in contrasting the cyclic nature of the economy.
The Fed and ECB have already take in place some actions to face this situation.
In particular, the Federal Reserve announced various strategies, among them:
the establishment of a temporary repurchase agreement facility for foreign and international monetary authorities (FIMA Repo Facility) to help support the smooth functioning of financial markets, including the U.S. Treasury market, and thus maintain the supply of credit to U.S. households and businesses. The FIMA Repo Facility will allow FIMA account holders, which consist of central banks and other international monetary authorities with accounts at the Federal Reserve Bank of New York, to enter into repurchase agreements with the Federal Reserve.
easing of conditions for Term Securities Lending Facility
The European Central Bank itself already undertook some actions:
conduction of purchases under the pandemic emergency purchase programme (PEPP)
conduction of the asset purchase programme (APP)
easing of conditions for long term refinancing operations (LTRO)
All the strategies mentioned share a flexibility driver and on the Repo market the instrument that represents the highest expression of flexibility is the Open Repo. The Central Banks could employ the Open Repo in an efficient way to implement the planned strategies by leveraging on the following factors:
Interest Rate equal to or less than the average rate on the deposit facility
Temporary envelope of additional net asset purchases
Interest rate on the main refinancing operations and the interest rates on the marginal lending facility and the deposit facility remaining unchanged at 0.00%, 0.25% and -0.50% respectively
Increasing flexibility of payment deadlines accordingly to favorable liquidity conditions
Borrowing allowance raised to 50% of eligible loans
Removing the limit of 10% of the stock of eligible loans for the amount of funds that can be borrowed in each operation, on all future operations
The creation of facilities to exchange illiquid collateral for liquid government bonds
We could continue mentioning plenty of other factors to leverage, but it is clear that these are the same factors used from 2008 financial crisis until today. The most important thing is to combine them together efficiently.
It is too early to perform detailed analysis on the benefits obtained by using these instruments and strategies, it is also early to conduct quantitative analysis about the results of these operations, but the historical evidence allows us to affirm that this could be the right way to follow, to guarantee short term liquidity and to avoid most of the problems related to the shortage of liquidity in the economic system.
Covid-19 is the invisible enemy that is affecting our life worldwide.
In this article we tried to highlight some key aspects that could help the economic system to avoid a deep recession using the Repo Market.
We analyzed the key technical aspects of the Repurchase Agreement and the logical flow behind its market functions; we also have seen which are the risks affecting the repo markets, and how the central banks and the primary dealers used this financial instrument for macroeconomic objects.
What has been highlighted with particular focus is the unquestionable strong linkage between repo market and financial system’s performance and health.
Another crucial aspect analyzed in the paper is the Repo Market primary role in the financial sector gained during the years till becoming a key instrument in particular for interbank exchanges; especially during crisis period it’s been affected by directives to prevent the collapse of the real economy thanks to stimulus by Central Banks.
Repo Market, although considered smoother and clearer than other type of financial instrument market (i.e. derivatives), plays a fundamental role especially considered the increasing importance of the Central Banks in nowadays economic and financial playground.
All the aspects highlighted converge into the possibility to use this market, and in particular the open repo, a specific product within itself, to tackle the financial implications due to Covid-19, considering also the inevitable consequences of the macroeconomic actions – taken by the Central banks – in terms of collateral segregation and market factors changes that are specific of the Repo Market.
[1] MSCI World Index: The MSCI World Index is a broad global equity index that represents large and mid-cap equity performance across all 23 developed markets countries. It covers approximately 85% of the free float-adjusted market capitalization in each country.
Questo sito utilizza cookie tecnici e di profilazione, propri e di terze parti, per garantire la corretta navigazione, analizzare il traffico e misurare l'efficacia delle attività di comunicazione.
Questo sito Web utilizza i cookie per migliorarne l'esperienza di navigazione. I cookie classificati come necessari, sono essenziali alle funzioni di base sito e vengono sempre memorizzati nel tuo browser. I cookie di terze parti, che ci aiutano ad analizzare e capire come utilizzi questo sito, vengono memorizzati nel tuo browser solo con il tuo consenso. Di seguito hai la possibilità di disattivare questi cookie. Tieni in conto che la disattivazione di alcuni di questi cookie potrebbe influire sulla tua esperienza di navigazione.
Necessary cookies are absolutely essential for the website to function properly. These cookies ensure basic functionalities and security features of the website, anonymously.
Cookie
Durata
Descrizione
cookielawinfo-checkbox-analytics
1 year
Cookie tecnico impostato dal plugin GDPR Cookie Consent che viene utilizzato per registrare il consenso dell'utente per i cookie nella categoria "Analitici".
cookielawinfo-checkbox-necessary
1 year
Cookie tecnico impostato dal plugin GDPR Cookie Consent che viene utilizzato per registrare il consenso dell'utente ai cookie.
CookieLawInfoConsent
1 year
Cookie tecnico impostato dal plugin GDPR Cookie Consent per salvare le scelte si/no dell'utente per ciascuna categoria.
viewed_cookie_policy
1 year
Cookie tecnico impostato dal plugin GDPR Cookie Consent che registra lo stato del pulsante predefinito della categoria corrispondente.
Analytical cookies are used to understand how visitors interact with the website. These cookies help provide information on metrics the number of visitors, bounce rate, traffic source, etc.
Cookie
Durata
Descrizione
_pk_id.gV3j99y0AE.0928
1 year 27 days
Cookie analitico impostato da Matomo e utilizzato per memorizzare alcuni dettagli sull'utente come l'ID univoco del visitatore
_pk_ses.gV3j99y0AE.0928
30 minutes
Cookie analitico impostato da Matomo di breve durata e utilizzato per memorizzare temporaneamente i dati della visita