The European Central Bank (ECB) is today publishing the indicative calendars for the Eurosystem’s regular tender operations and reserve maintenance periods in 2021…
https://www.ecb.europa.eu//press/pr/date/2020/html/ecb.pr200610_1~caa2fc0a02.en.html
The European Central Bank (ECB) is today publishing the indicative calendars for the Eurosystem’s regular tender operations and reserve maintenance periods in 2021…
https://www.ecb.europa.eu//press/pr/date/2020/html/ecb.pr200610_1~caa2fc0a02.en.html

L’iniziativa di Finriskalert.it “Il termometro dei mercati finanziari” vuole presentare un indicatore settimanale sul grado di turbolenza/tensione dei mercati finanziari, con particolare attenzione all’Italia.
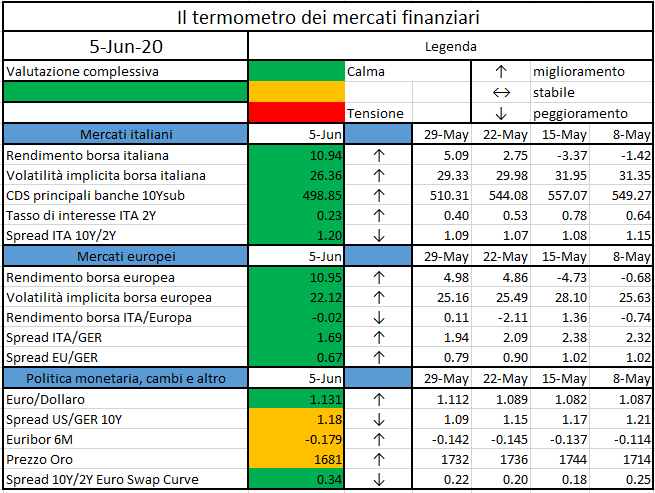
Significato degli indicatori
I colori sono assegnati in un’ottica VaR: se il valore riportato è superiore (inferiore) al quantile al 15%, il colore utilizzato è l’arancione. Se il valore riportato è superiore (inferiore) al quantile al 5% il colore utilizzato è il rosso. La banda (verso l’alto o verso il basso) viene selezionata, a seconda dell’indicatore, nella direzione dell’instabilità del mercato. I quantili vengono ricostruiti prendendo la serie storica di un anno di osservazioni: ad esempio, un valore in una casella rossa significa che appartiene al 5% dei valori meno positivi riscontrati nell’ultimo anno. Per le prime tre voci della sezione “Politica Monetaria”, le bande per definire il colore sono simmetriche (valori in positivo e in negativo). I dati riportati provengono dal database Thomson Reuters. Infine, la tendenza mostra la dinamica in atto e viene rappresentata dalle frecce: ↑,↓, ↔ indicano rispettivamente miglioramento, peggioramento, stabilità rispetto alla rilevazione precedente.
Disclaimer: Le informazioni contenute in questa pagina sono esclusivamente a scopo informativo e per uso personale. Le informazioni possono essere modificate da finriskalert.it in qualsiasi momento e senza preavviso. Finriskalert.it non può fornire alcuna garanzia in merito all’affidabilità, completezza, esattezza ed attualità dei dati riportati e, pertanto, non assume alcuna responsabilità per qualsiasi danno legato all’uso, proprio o improprio delle informazioni contenute in questa pagina. I contenuti presenti in questa pagina non devono in alcun modo essere intesi come consigli finanziari, economici, giuridici, fiscali o di altra natura e nessuna decisione d’investimento o qualsiasi altra decisione deve essere presa unicamente sulla base di questi dati.
Bitcoin Core released a new software update Wednesday, Bitcoin Core 0.20.0. Notably, the release includes experimental software…
https://www.coindesk.com/latest-bitcoin-core-code-release-protects-against-nation-state-attacks
All contributions received will be published following the close of the consultation, unless you request otherwise. Please clearly and prominently indicate in your submission any part you do not wish to be publicly disclosed…
International credit can be fickle and subject to sudden stops during periods of global economic
stress. Non-financial corporate borrowers that rely on credit…
Hester Peirce, one of five commissioners with the U.S. Securities and Exchange Commission (SEC), has been tapped for a second term at the regulatory agency…
https://www.coindesk.com/sec-crypto-mom-hester-peirce-tapped-for-second-term-at-us-regulator-report

COVID-19 has rapidly spread throughout the world with a CFR (Case Fatality Rate) that varies tremendously from country to country, depending on the health care system and on the state of health of the patients (the CFR refers to the death rate among all those who have actually been tested and diagnosed with COVID-19). It always shows a strong correlation to age: the average CFR is negligible for children, about 1% for young adults and it rises to 4% for people over 60, to 9% for people over 70 and to 18% for people over 80 (see https://www.cebm.net/covid-19/global-covid-19-case-fatality-rates).
CFRs can vary enormously among different countries (e.g. from 0.04% Qatar to 16% Belgium) and, even within the same country, over time because of a number of factors, among which
It is also very important, but not easy at all, to attribute to COVID-19 the correct number of deaths it has actually caused. In Italy, all coronavirus patients who died in hospital were recorded as having died of COVID-19, but a re-evaluation of death certificates by Italy’s National Institute of Health found that only 12% of these deaths had been directly caused by COVID-19. On the other hand, many deaths occurred outside the hospitals have not been classified as caused by COVID-19 and might be so.
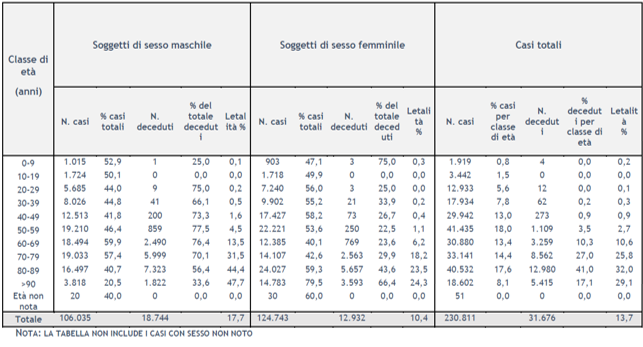
As of 28 February 2020, pursuant to order n. 640 of 27th February 2020, the Istituto Superiore di Sanità (ISS) has been coordinating a surveillance system integrating the microbiological and epidemiological data from its national reference laboratory with those provided by all Regions and Autonomous Provinces (APs) and with those provided by the National Institute of Statistics (ISTAT). Data are collected on the web platform http://covid-19.iss.it and the ISS publishes the related statistics on a daily basis. The latest report available at the date of drafting of this article was published on the 28th May 2020 (updated to the 26th May 2020), reporting 230,811 cases and 31,676 deaths (average CFR of 13.7%), split by gender and age buckets as shown in the table [Integrated surveillance of COVID-19 in Italy]
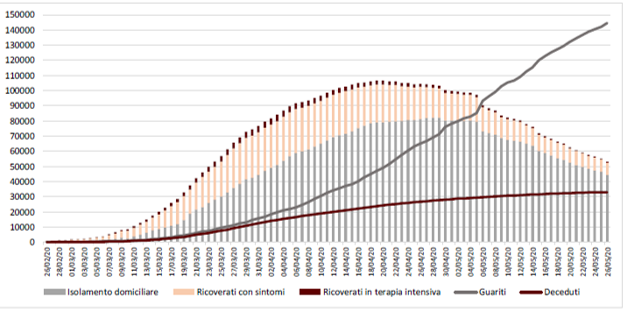
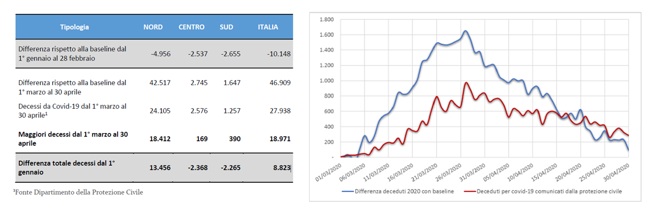
The cumulative data at 20 May 2020 published by the Ministry of Health and Civil Protection show a decreasing trend in the epidemiologic curve.
As already said and as claimed by many virologists, the actual number of deaths caused by COVID-19 may actually be much higher as not all the deaths are tested and classified. On this note, it is interesting to comment the outcome of an analysis carried out by the INPS (Istituto Nazionale della Previdenza Sociale, the largest social security and welfare Italian institute) and published last 20th May 2020 [https://www.inps.it/nuovoportaleinps/default.aspx?itemDir=53705].
The report clarifies that death rates vary across the year (the seasonal flu increases the number of deaths in the winter period and humidity and hot temperatures kill people during the summer time) but are quite stable over time. This is well shown by the following chart, which sketches the seasonality trend of mortality over the calendar years 2015/2019. The baseline is the weighted average of daily death rates over these 5 years, with weights given by the exposures.
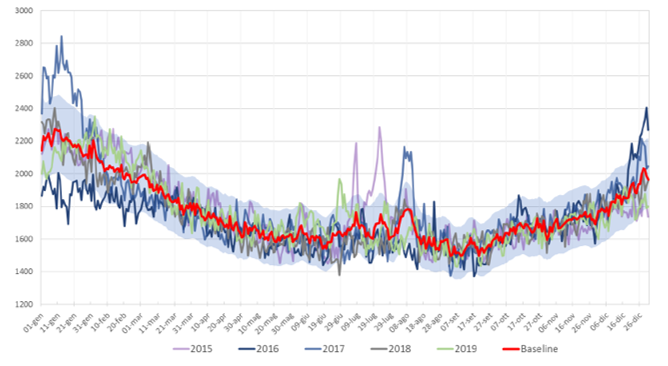
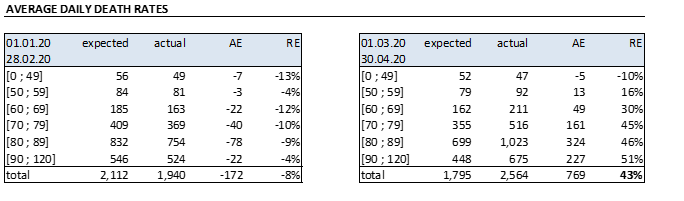
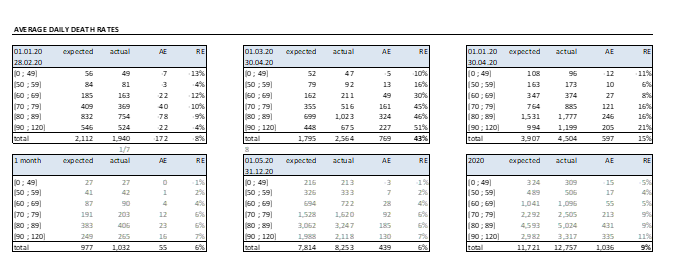
The Institute then compares the daily average expected rates over a certain period to those actually registered, split by age: whilst the beginning of the year was characterize by a lower incidence of the seasonal flu, the crucial months of the COVID-19 pandemic has shown an impressive increase in mortality rates
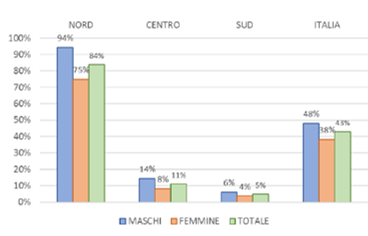
The total increase in death rates (43%) is even more terrifying when split by geographic area
Being the death rates quite stable over the calendar years, it is reasonable to attribute the excess of deaths with respect to the baseline to COVID-19. These data (46,909 deaths) are quite different from those published by the Civil Protection (27,938 deaths) as the latter counts only people who were tested: it seems that 18,971 deaths were not correctly classified.
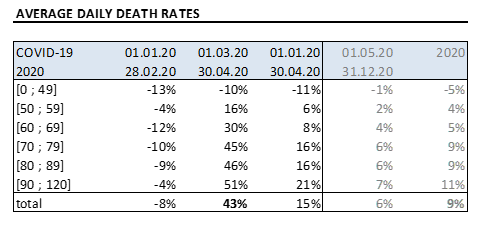
Building on the statistics provided by the INPS institute and the recent data published by the Civil Protection (deaths of about 1/7 of those happened in the crucial months), the author has derived a potential forecast of the impact of COVID-19 on 2020 Italian death rates
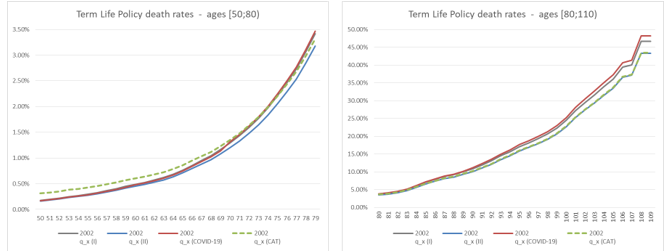
The author has then compared the derived increase in death rates to the one prescribed by the Standard Formula application in the SII framework (Mortality CAT: absolute 0.15% instantaneous increase in the rate of policyholders dying over the following year). The following simplified example provides an insight on how COVID-19 can increase the claims for death when a term life policy is considered, with term varying from 5 to 20 years. For sake of simplicity, the BEL value considers death claims only (no expenses, single premium) and the RFR yield curve use to discount the CFs is the latest published by EIOPA (26.05.2020) at the time of drafting. The term life policy considers as I order basis the 70% SI2002, while as II order basis the 65% SI2002.
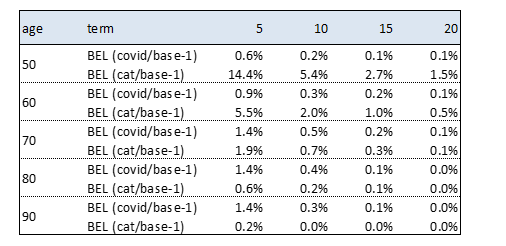
Results can be interpreted by considering that both COVID-19 and CAT affect just the 1st year of projection (and therefore their impact is stronger for shorter durations of the contracts) and by considering that while COVID-19 acts with a multiplicative scale, CAT is a constant parallel shift to the death rates curve. It is worth noticing that the death rates implied by COVID-19 exceed those adopted as first order basis, provoking a loss.
The welcome decreasing trends in the number of new cases together with the short-term economic and social concerns have enticed both governments and the public to relax control measures: consequently, it is possible that there will be a spark of new chains of transmission and new epidemic flares or waves. The capacity for deploying quick diagnostic tests remains a challenge and the road to safe and effective vaccines is fraught with hurdles and uncertain timelines: we have to call for a delicate implementation strategy.
Greece is currently funding a new research project with the double aim of expanding the testing capacity by implementing protocols that use basic reagents with a minimal dependence from the international market and of assessing how the genetic profile of a patient in combination with the viral genome variability contribute to the differential clinical outcomes. Computer science and AI solutions are the key to interpret large amounts of genomic and clinical data and to learn how biological mechanisms work.
The Insurance Industry is also using Artificial Intelligence to improve the product design and to have more accurate underwriting techniques or more efficient claims management and fraud detection procedures. According to a research carried out by EIOPA, the 31% of participating undertakings were using machine learning and another 24% were at a proof of concept stage. According to the European Commission, the volume of data produced in the world is expected to grow by 500% from 2018 to 2025, with a direct impact on the insurance sector, where data processing has always been at the very core of business. Gabriel Bernardino, the chairman of EIOPA, during the annual conference of the German Association of Actuaries held on the 29th April 2020, has recalled that EIOPA is working to provide guidance to the market in the operationalisation of digital ethics principles for insurance. COVID-19 is acting as a trigger of acceleration of the digital technology trend and the debate about data and digital ethics is very topical during this challenging time. An easy example is given by the need of public health authorities to identify, track and isolate those citizens that may have been exposed to the virus, with the aim of stopping its spread: this has led a debate around social tracing and how far governments should go.

L’indicatore di Mahalanobis permette di evidenziare periodi di stress nei mercati finanziari. Si tratta di un indicatore che dipende dalle volatilità e dalle correlazioni di un particolare universo investimenti preso ad esame. Nello specifico ci siamo occupati dei mercati azionari europei e dei settori azionari globali.
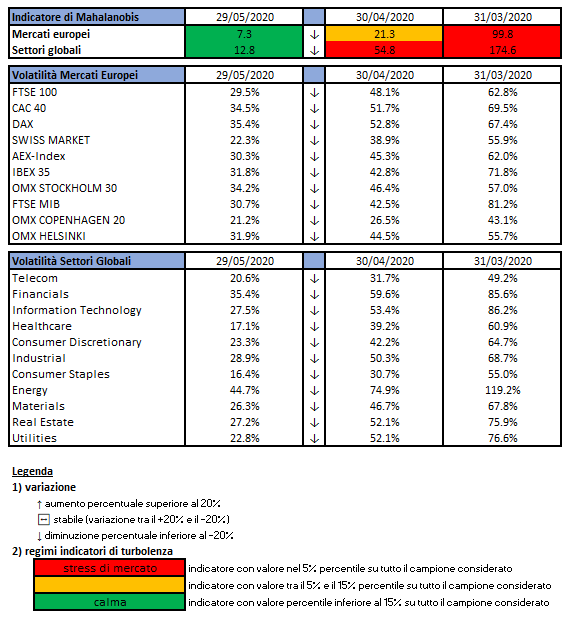
Gli indici utilizzati sono:

Le volatilità riportate sono storiche e calcolate sugli ultimi 30 trading days disponibili. Per ogni asset-class dunque sono prima calcolati i rendimenti logaritmici dei prezzi degli indici di riferimento, successivamente si procede col calcolo della deviazione standard dei rendimenti, ed infine si procede a moltiplicare la deviazione standard per il fattore di annualizzazione.
Per il calcolo della distanza di Mahalnobis si procede dapprima con la stima della matrice di covarianza tra le asset-class. Si considera l’approccio delle finestre mobili. Come con la volatilità, si procede prima con il calcolo dei rendimenti logaritmici e poi con la stima storica della matrice di covarianza, come riportato di seguito.
Supponendo una finestra mobile di T periodi, viene calcolato il valore medio e la matrice varianza covarianza al tempo t come segue:
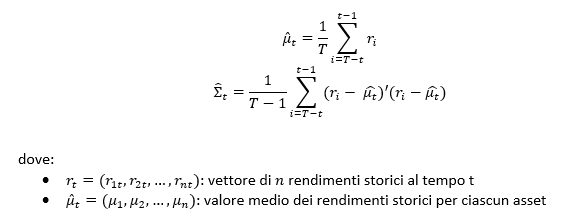
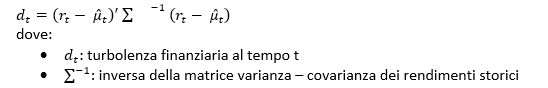
La distanza di Mahalanobis è definita formalmente come:
Le parametrizzazioni che sono state scelte sono:
Le statistiche percentili sono state calcolate a partire dalla distribuzione dell’indicatore di Mahalanobis dal Dicembre 1997 al Dicembre 2019 su rilevazioni mensili.
Ulteriori dettagli sono riportati in questo articolo.
Disclaimer: Le informazioni contenute in questa pagina sono esclusivamente a scopo informativo e per uso personale. Le informazioni possono essere modificate da finriskalert.it in qualsiasi momento e senza preavviso. Finriskalert.it non può fornire alcuna garanzia in merito all’affidabilità, completezza, esattezza ed attualità dei dati riportati e, pertanto, non assume alcuna responsabilità per qualsiasi danno legato all’uso, proprio o improprio delle informazioni contenute in questa pagina. I contenuti presenti in questa pagina non devono in alcun modo essere intesi come consigli finanziari, economici, giuridici, fiscali o di altra natura e nessuna decisione d’investimento o qualsiasi altra decisione deve essere presa unicamente sulla base di questi dati.
L’iniziativa di Finriskalert.it “Il termometro dei mercati finanziari” vuole presentare un indicatore settimanale sul grado di turbolenza/tensione dei mercati finanziari, con particolare attenzione all’Italia.
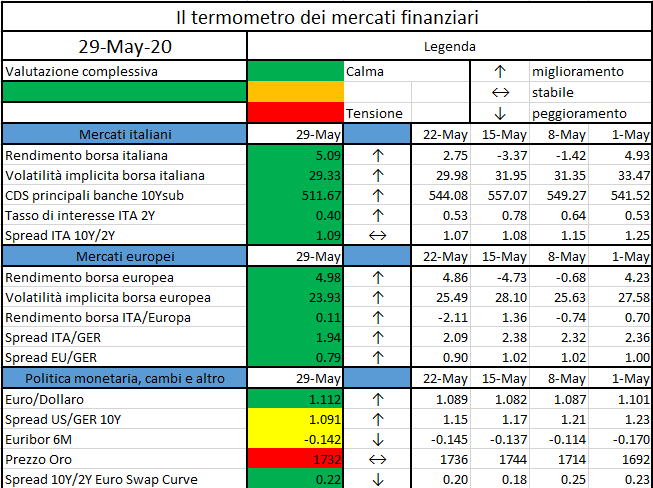
Significato degli indicatori
I colori sono assegnati in un’ottica VaR: se il valore riportato è superiore (inferiore) al quantile al 15%, il colore utilizzato è l’arancione. Se il valore riportato è superiore (inferiore) al quantile al 5% il colore utilizzato è il rosso. La banda (verso l’alto o verso il basso) viene selezionata, a seconda dell’indicatore, nella direzione dell’instabilità del mercato. I quantili vengono ricostruiti prendendo la serie storica di un anno di osservazioni: ad esempio, un valore in una casella rossa significa che appartiene al 5% dei valori meno positivi riscontrati nell’ultimo anno. Per le prime tre voci della sezione “Politica Monetaria”, le bande per definire il colore sono simmetriche (valori in positivo e in negativo). I dati riportati provengono dal database Thomson Reuters. Infine, la tendenza mostra la dinamica in atto e viene rappresentata dalle frecce: ↑,↓, ↔ indicano rispettivamente miglioramento, peggioramento, stabilità rispetto alla rilevazione precedente.
Disclaimer: Le informazioni contenute in questa pagina sono esclusivamente a scopo informativo e per uso personale. Le informazioni possono essere modificate da finriskalert.it in qualsiasi momento e senza preavviso. Finriskalert.it non può fornire alcuna garanzia in merito all’affidabilità, completezza, esattezza ed attualità dei dati riportati e, pertanto, non assume alcuna responsabilità per qualsiasi danno legato all’uso, proprio o improprio delle informazioni contenute in questa pagina. I contenuti presenti in questa pagina non devono in alcun modo essere intesi come consigli finanziari, economici, giuridici, fiscali o di altra natura e nessuna decisione d’investimento o qualsiasi altra decisione deve essere presa unicamente sulla base di questi dati.
ZUBR, which began trading in March, said Wednesday it had received in-principle approval from the Gibraltar Financial Services Commission (GFSC) as a Distributed Ledger Technology (DLT) provider…
https://www.coindesk.com/gibraltar-regulator-crypto-derivatives-exchange
