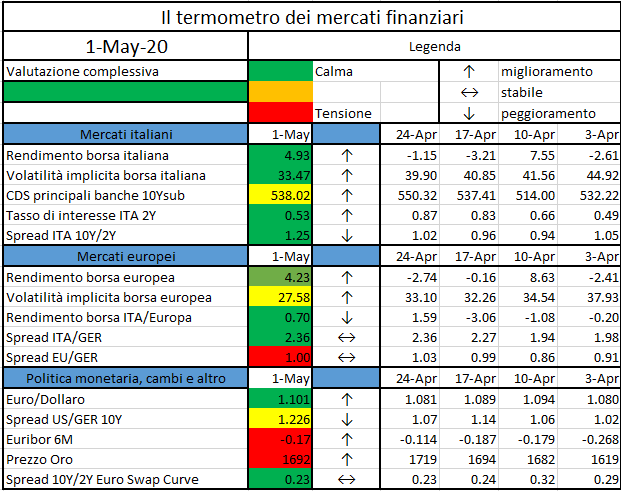
L’iniziativa di Finriskalert.it “Il termometro dei mercati finanziari” vuole presentare un indicatore settimanale sul grado di turbolenza/tensione dei mercati finanziari, con particolare attenzione all’Italia.
Significato degli indicatori
Rendimento borsa italiana: rendimento settimanale dell’indice della borsa italiana FTSEMIB;
Volatilità implicita borsa italiana: volatilità implicita calcolata considerando le opzioni at-the-money sul FTSEMIB a 3 mesi;
Future borsa italiana: valore del future sul FTSEMIB;
CDS principali banche 10Ysub: CDS medio delle obbligazioni subordinate a 10 anni delle principali banche italiane (Unicredit, Intesa San Paolo, MPS, Banco BPM);
Tasso di interesse ITA 2Y: tasso di interesse costruito sulla curva dei BTP con scadenza a due anni;
Spread ITA 10Y/2Y : differenza del tasso di interesse dei BTP a 10 anni e a 2 anni;
Rendimento borsa europea: rendimento settimanale dell’indice delle borse europee Eurostoxx;
Volatilità implicita borsa europea: volatilità implicita calcolata sulle opzioni at-the-money sull’indice Eurostoxx a scadenza 3 mesi;
Rendimento borsa ITA/Europa: differenza tra il rendimento settimanale della borsa italiana e quello delle borse europee, calcolato sugli indici FTSEMIB e Eurostoxx;
Spread ITA/GER: differenza tra i tassi di interesse italiani e tedeschi a 10 anni;
Spread EU/GER: differenza media tra i tassi di interesse dei principali paesi europei (Francia, Belgio, Spagna, Italia, Olanda) e quelli tedeschi a 10 anni;
Euro/dollaro: tasso di cambio euro/dollaro;
Spread US/GER 10Y: spread tra i tassi di interesse degli Stati Uniti e quelli tedeschi con scadenza 10 anni;
Prezzo Oro: quotazione dell’oro (in USD)
Spread 10Y/2Y Euro Swap Curve: differenza del tasso della curva EURO ZONE IRS 3M a 10Y e 2Y;
Euribor 6M: tasso euribor a 6 mesi.
I colori sono assegnati in un’ottica VaR: se il valore riportato è superiore (inferiore) al quantile al 15%, il colore utilizzato è l’arancione. Se il valore riportato è superiore (inferiore) al quantile al 5% il colore utilizzato è il rosso. La banda (verso l’alto o verso il basso) viene selezionata, a seconda dell’indicatore, nella direzione dell’instabilità del mercato. I quantili vengono ricostruiti prendendo la serie storica di un anno di osservazioni: ad esempio, un valore in una casella rossa significa che appartiene al 5% dei valori meno positivi riscontrati nell’ultimo anno. Per le prime tre voci della sezione “Politica Monetaria”, le bande per definire il colore sono simmetriche (valori in positivo e in negativo). I dati riportati provengono dal database Thomson Reuters. Infine, la tendenza mostra la dinamica in atto e viene rappresentata dalle frecce: ↑,↓, ↔ indicano rispettivamente miglioramento, peggioramento, stabilità rispetto alla rilevazione precedente.
Disclaimer: Le informazioni contenute in questa pagina sono esclusivamente a scopo informativo e per uso personale. Le informazioni possono essere modificate da finriskalert.it in qualsiasi momento e senza preavviso. Finriskalert.it non può fornire alcuna garanzia in merito all’affidabilità, completezza, esattezza ed attualità dei dati riportati e, pertanto, non assume alcuna responsabilità per qualsiasi danno legato all’uso, proprio o improprio delle informazioni contenute in questa pagina. I contenuti presenti in questa pagina non devono in alcun modo essere intesi come consigli finanziari, economici, giuridici, fiscali o di altra natura e nessuna decisione d’investimento o qualsiasi altra decisione deve essere presa unicamente sulla base di questi dati.
The Governing Council of the European Central Bank (ECB) today decided on a number of modifications to the terms and conditions of its targeted longer-term…
In these times of unprecedented pandemic led economic uncertainty, there is a sector almost as vital as the healthcare system, which is “silently” sustaining the global quarantined economy, FinTech.
As people and companies progressively
shut their doors, governments around the globe assured that the financial
services will be guaranteed. This means that financial services are accounted
as “essential” services to maintain the global societal order, along with the
energy, pharmaceutical and agro-industrial sectors. This should not come as a
surprise, as banks around the globe will play a critical role as systemic
stabilizers for their customers, their employees, and for their economies at
large in the imminent economic fallout. Cash and deposit services, credit
extension, payment facilitation, and market making are all essential services
for the society to function, as we know it.
So in fact, the financial system has
always sustained the global order during crises, but the nature of this
sanitary crisis would have collapsed traditional banking and related services,
heavily reliant on physical interaction.
On the other hand, FinTech companies
are particularly well-suited to deal with the logistical challenges and health
risks posed by the spread of the coronavirus because of the relatively large
number of remote workers in the sector. After all, developers, consultants,
project managers, and other employees of FinTech companies are very often
located across different cities, or even different countries, occasionally
meeting in person, but keeping most of their operations online. Therefore,
depending on how a FinTech company is structured, this presents nowadays a tremendous
advantage, both in the sense that services can be delivered as normal, and that
employees face lower risks of infecting one another.
Notwithstanding the nature of the
economic fallout, comparing the financial sector response in 2020 COVID-19
crisis with the CDOs and following sovereign debt crisis of 2008/2009, three
major contextual differences can be identified when looking at financial
institutions:
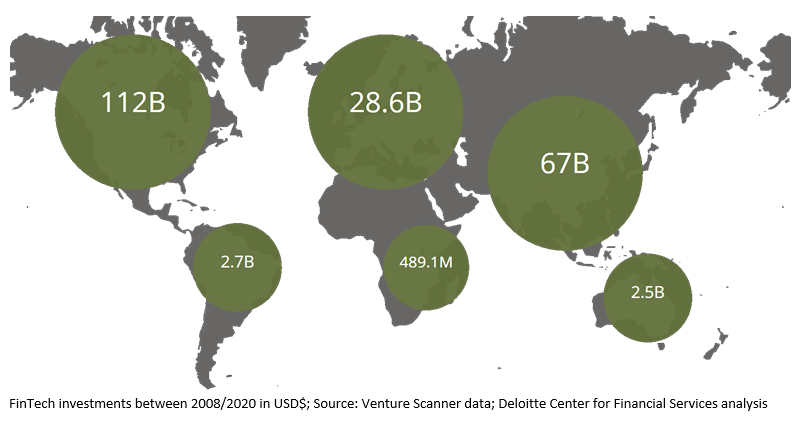
More efficient banking
infrastructure & technology: as per our report “The Next Phase
of FinTech Revolution”,
between 2008 and 2020 it has been invested a global aggregate of $ 213.3B in
FinTech technologies, with an avg. annual investment of $ 17.8B, marked by an
exponential growth specifically in the second half of the last decade. Another Deloitte report shows how this investment translated in an addition for the same period of 645
Fin-tech companies in Payment Services, 410 in Asset Management and 332
Insurance
Companies
globally by the end of 2018.
Capital solidity: stricter capital requirements for financial institutions
following the 2008 crisis, along with intensified regulatory activity (e.g PSD II,
MIFID II) left banks and the credit system less vulnerable to financial
shockwaves. Consequently, also companies that experienced the credit crunch are
now better capitalized and dispose of more credit services (e.g. crowdfunding,
P2P, etc…).
Geographic diversification: both users and companies have truly
gone global in their reach and access to services in the past decade. The
reduced exposure to national markets, as countries gradually resume normal
activities, will redistribute demand and supply more quickly and effectively on
the already existing international “essential” supply chains and related
financial services, sustaining revenue. As reported by Bloomberg, the Chinese first two months of 2020
show exactly such phenomena. PRC’s exports contracted of -17.2% in dollar
terms, and imports only by -4%, in January and February, with a trend inversion
in recent weeks as the virus epicenter moved in Europe and North America. Now,
as the latter economies shut down, China is re-increasing exports and further
lowering imports, sustaining the affected countries supply chains.
FinTech is interconnected to all these
three factors improvements and, whether by easing access to credit for SMEs or
by digitalizing traditional bank service, it built an essential infrastructure
that the whole economy is now relying on for daily operations, from online grocery
shopping to large corporate invoice factoring services.
FSI with and without
FinTech during crises: the Italian Case
The Italian economy offers the perfect
ground to emphasize the role of FinTech in sustaining the country in COVID-19
times.
If we go back to 2008, it is easy to
remember how the opening of a simple bank account in Italy (and most of Southern
Europe) was a bureaucratic and time-consuming process that required a never-ending
amount of documents and the deposit of a considerable sum. At the time, the
most innovative FinTech company was PayPal with traditional banks providing few
hard-to-access digital services. Huge entry barriers and the inability to
access services or opportunities, due to the obsolescence of the financial
services ecosystem, plagued the national economy recovery.
The credit crunch that afflicted SMEs
in 2012 was particularly amplified by the impaired equity positions of lenders
and the technological gap in the national financial services infrastructure. Due
to this need, new FinTech corporate services started to appear not only in
Italy (e.g. Credimi.it) but also at a European level. The European start-ups
had to face a corporate market based on traditional banking, where trust for
newcomers is not given easily.
Things have changed, seven years later
at least 5% of Italian SMEs uses FinTech credit services regularly as the 2019 EU commission inquiry on SME’s
access to credit reports,
and this number is destined to rise in these upcoming months.
The incredible agility of FinTechs
allowed for immediate crisis responses, which even if very modest in volumes
compared to traditional banks, have a great significance and potential for
future enhancements. Italian FinTech
companies took concrete actions in support of their clients and communities; here are two examples:
The
corporate lender October.eu suspended capital repayments for a period of three months for more
than 500 SMEs with active repayment schedules. This measure was initiated
automatically and without any bureaucratic procedures by entrepreneurs. October
will renounce the fees charged to SMEs throughout the period as a further sign
of its efforts.
The
digital bank Hype offered its customers the possibility to make a donation
directly from its app, using the “send money” function, to help the ASST
Fatebenefratelli Sacco hospital, in Milan.
Of course, FinTech cannot sustain the
economic downturns alone but it is the synergy of its new technologies with the
traditional banking industry that is holding the economy nowadays, and will
likely boost economic growth once the FinTech companies approach a stage of
maturity and full scalability.
Future Outlook: the Black
Swan as a blessing of progress
Hard times create strong men. Strong
men create progress. It is notable to remember that the digital side of FinTech
as we know it, raised from the ashes of the 2008 crisis. The systemic crisis
highlighted the weak spots and quickly economic Darwinism took place. The
systemic gaps quickly got filled with the FinTech start-ups that are now
getting more and more integrated in the traditional system.
These hard times we are living in,
will definitely create social distress and economic disruptions, but history
teaches us that after every crisis, we have been able, as economies and people,
to identify the weaknesses that brought us down to our knees and rise stronger
than before by innovating and by stimulating change adoption. This time it will
be no different, and it is already happening.
In the shops where cash was king, now
digital payments and contactless cards are becoming the norm. “The less
contact, the better” is what we hear everywhere, and that is also what
governments and central banks are starting to think.
In a version of the US Congressional
bill, containing $ 2T of exceptional stimuli to the economy, proposed last week
by the House Financial Services Committee, there was evidence of a proposal for the creation of a system
of digital dollar
wallets maintained and operated by Federal Reserve System banks. The suggested
purpose was to serve as the infrastructure for delivering stimulus payments to
American consumers as they weather the economic storm triggered by the spread
of COVID-19. Unfortunately, the proposal has been stripped away in the latest
version from the House of Democrats, but the message is strong.
As Mario Draghi recalled before leaving his tenure at the helm of the ECB last October, the need to inject liquidity in times of low inflation or even worse during recession is vital for the survival of capitalism, as we know it. He recalled multiple times the “helicopter money” theory during the massive QE he initiated for a reason: the injected liquidity was not getting rapidly enough where it was most needed. The creation of digital currencies maintained by central banks is now looking more realistic than ever, and that is just a way of how FinTech is and will silently sustain our economic rebirth. As we explored along the article, FinTech is not only AI, RPA, digital payments or Blockchain, but
also the technology that enables us nowadays to exchange value in circumstances
never explored in human or modern history. COVID-19 crisis could also be
defined as the biggest social experiment ever undertaken, it is a stress-test
for the fabric of our societies and economies, and if we endure, it will not be
only thanks to medical devices.
Authors:
Paolo Gianturco – Senior Partner at Deloitte Consulting
S.r.l.
Marco Mione – Manager at Deloitte Consulting S.r.l.
Luca Cerruti – FinTech Team Analyst at Deloitte Consulting
S.r.l.
Matteo Prencipe – Analyst at Deloitte Consulting S.r.l.
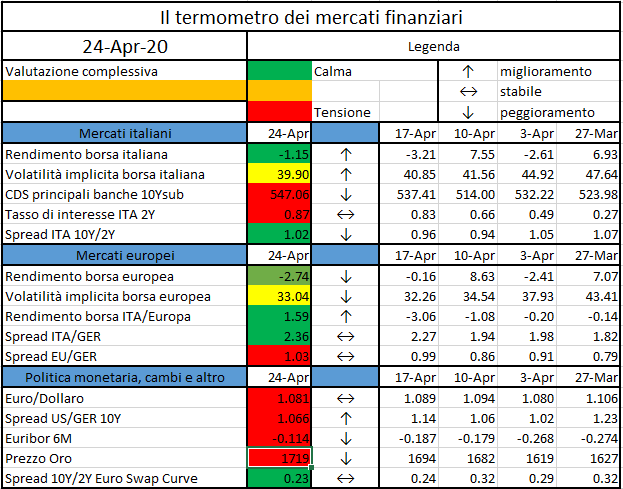
L’iniziativa di Finriskalert.it “Il termometro dei mercati finanziari” vuole presentare un indicatore settimanale sul grado di turbolenza/tensione dei mercati finanziari, con particolare attenzione all’Italia.
Significato degli indicatori
Rendimento borsa italiana: rendimento settimanale dell’indice della borsa italiana FTSEMIB;
Volatilità implicita borsa italiana: volatilità implicita calcolata considerando le opzioni at-the-money sul FTSEMIB a 3 mesi;
Future borsa italiana: valore del future sul FTSEMIB;
CDS principali banche 10Ysub: CDS medio delle obbligazioni subordinate a 10 anni delle principali banche italiane (Unicredit, Intesa San Paolo, MPS, Banco BPM);
Tasso di interesse ITA 2Y: tasso di interesse costruito sulla curva dei BTP con scadenza a due anni;
Spread ITA 10Y/2Y : differenza del tasso di interesse dei BTP a 10 anni e a 2 anni;
Rendimento borsa europea: rendimento settimanale dell’indice delle borse europee Eurostoxx;
Volatilità implicita borsa europea: volatilità implicita calcolata sulle opzioni at-the-money sull’indice Eurostoxx a scadenza 3 mesi;
Rendimento borsa ITA/Europa: differenza tra il rendimento settimanale della borsa italiana e quello delle borse europee, calcolato sugli indici FTSEMIB e Eurostoxx;
Spread ITA/GER: differenza tra i tassi di interesse italiani e tedeschi a 10 anni;
Spread EU/GER: differenza media tra i tassi di interesse dei principali paesi europei (Francia, Belgio, Spagna, Italia, Olanda) e quelli tedeschi a 10 anni;
Euro/dollaro: tasso di cambio euro/dollaro;
Spread US/GER 10Y: spread tra i tassi di interesse degli Stati Uniti e quelli tedeschi con scadenza 10 anni;
Prezzo Oro: quotazione dell’oro (in USD)
Spread 10Y/2Y Euro Swap Curve: differenza del tasso della curva EURO ZONE IRS 3M a 10Y e 2Y;
Euribor 6M: tasso euribor a 6 mesi.
I colori sono assegnati in un’ottica VaR: se il valore riportato è superiore (inferiore) al quantile al 15%, il colore utilizzato è l’arancione. Se il valore riportato è superiore (inferiore) al quantile al 5% il colore utilizzato è il rosso. La banda (verso l’alto o verso il basso) viene selezionata, a seconda dell’indicatore, nella direzione dell’instabilità del mercato. I quantili vengono ricostruiti prendendo la serie storica di un anno di osservazioni: ad esempio, un valore in una casella rossa significa che appartiene al 5% dei valori meno positivi riscontrati nell’ultimo anno. Per le prime tre voci della sezione “Politica Monetaria”, le bande per definire il colore sono simmetriche (valori in positivo e in negativo). I dati riportati provengono dal database Thomson Reuters. Infine, la tendenza mostra la dinamica in atto e viene rappresentata dalle frecce: ↑,↓, ↔ indicano rispettivamente miglioramento, peggioramento, stabilità rispetto alla rilevazione precedente.
Disclaimer: Le informazioni contenute in questa pagina sono esclusivamente a scopo informativo e per uso personale. Le informazioni possono essere modificate da finriskalert.it in qualsiasi momento e senza preavviso. Finriskalert.it non può fornire alcuna garanzia in merito all’affidabilità, completezza, esattezza ed attualità dei dati riportati e, pertanto, non assume alcuna responsabilità per qualsiasi danno legato all’uso, proprio o improprio delle informazioni contenute in questa pagina. I contenuti presenti in questa pagina non devono in alcun modo essere intesi come consigli finanziari, economici, giuridici, fiscali o di altra natura e nessuna decisione d’investimento o qualsiasi altra decisione deve essere presa unicamente sulla base di questi dati.
The Governing Council of the European Central Bank (ECB) today adopted temporary measures to mitigate the effect on collateral availability of possible rating downgrades…
Questo sito utilizza cookie tecnici e di profilazione, propri e di terze parti, per garantire la corretta navigazione, analizzare il traffico e misurare l'efficacia delle attività di comunicazione.
Questo sito Web utilizza i cookie per migliorarne l'esperienza di navigazione. I cookie classificati come necessari, sono essenziali alle funzioni di base sito e vengono sempre memorizzati nel tuo browser. I cookie di terze parti, che ci aiutano ad analizzare e capire come utilizzi questo sito, vengono memorizzati nel tuo browser solo con il tuo consenso. Di seguito hai la possibilità di disattivare questi cookie. Tieni in conto che la disattivazione di alcuni di questi cookie potrebbe influire sulla tua esperienza di navigazione.
Necessary cookies are absolutely essential for the website to function properly. These cookies ensure basic functionalities and security features of the website, anonymously.
Cookie
Durata
Descrizione
cookielawinfo-checkbox-analytics
1 year
Cookie tecnico impostato dal plugin GDPR Cookie Consent che viene utilizzato per registrare il consenso dell'utente per i cookie nella categoria "Analitici".
cookielawinfo-checkbox-necessary
1 year
Cookie tecnico impostato dal plugin GDPR Cookie Consent che viene utilizzato per registrare il consenso dell'utente ai cookie.
CookieLawInfoConsent
1 year
Cookie tecnico impostato dal plugin GDPR Cookie Consent per salvare le scelte si/no dell'utente per ciascuna categoria.
viewed_cookie_policy
1 year
Cookie tecnico impostato dal plugin GDPR Cookie Consent che registra lo stato del pulsante predefinito della categoria corrispondente.
Analytical cookies are used to understand how visitors interact with the website. These cookies help provide information on metrics the number of visitors, bounce rate, traffic source, etc.
Cookie
Durata
Descrizione
_pk_id.gV3j99y0AE.0928
1 year 27 days
Cookie analitico impostato da Matomo e utilizzato per memorizzare alcuni dettagli sull'utente come l'ID univoco del visitatore
_pk_ses.gV3j99y0AE.0928
30 minutes
Cookie analitico impostato da Matomo di breve durata e utilizzato per memorizzare temporaneamente i dati della visita