Verso nuovi modelli di business
È tempo di innovazione per i Wealth Manager
È evidenza ormai nota e diffusa che il settore del Wealth Management abbia raggiunto la sua fase di maturità e stia assistendo ad un progressivo rallentamento, chiedendosi quando e con che velocità arriverà la nuova “era” di trasformazione sulla spinta dei player tech oramai non più nuovi entranti.
Tutti gli istituti finanziari sono consapevoli che l’innovazione tecnologica sia la chiave di volta anche in uno dei settori in cui la fiducia e la relazione con la Clientela mantengono un ruolo così rilevante da aver tenuto la Digital Disruption alle porte fino ad oggi. Ma ancora per poco.
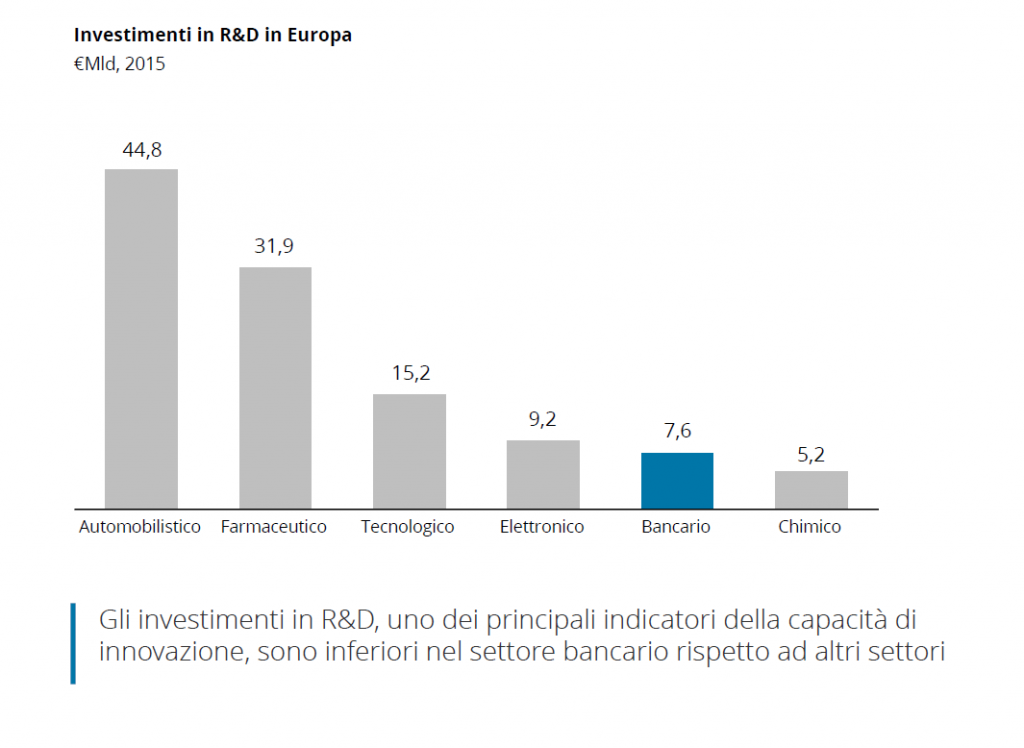
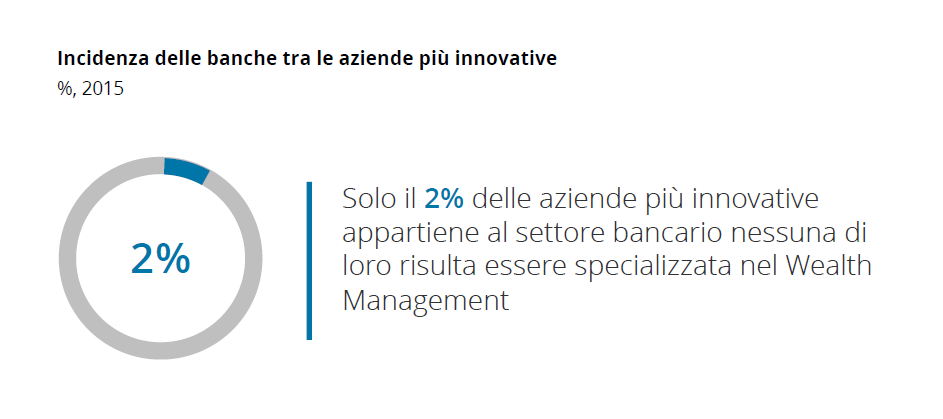
Confrontato con le altre industrie, il settore bancario in generale, e ancor più il Wealth Management è fortemente indietro in termini di innovazione sia dal punto di vista di investimenti in R&D sia per numero di aziende innovative nel settore. Questo può sembrare quasi un paradosso se si pensa che quello bancario è il secondo settore più impattato dalla Digital Disruption.
L’innovazione infatti ha finora rivestito un ruolo secondario nelle strategie di sviluppo del Wealth Management e Private Banking, ancora più che nel Retail o Investment banking.
La redditività del mercato Europeo si è ridotta del 40% negli ultimi 20 anni per via della crisi finanziaria e della crescente pressione regolamentare. Al contrario, il mercato in Europa continua a crescere, con un sostanziale aumento dei volumi (+60%), attirando nuovi player che, grazie ad una struttura di costo leggera e modelli scalabili possono facilmente attrarre quote di mercato rivolgendosi in particolar modo ad un pubblico più giovane e meno scettico ad una gestione del proprio portafoglio tramite canali digitali.
La forte divergenza tra la crescita dei volumi e la contrazione della redditività registrata fino al 2015 e confermata dalle previsioni di breve periodorisulta un chiaro segnale del fatto che i business model esistenti hanno raggiunto una fase di maturità per cui la leva della crescita o le manovre di cost-efficiency possono solo rimandare o rallentare l’inizio di una fase di declino.
Lo scenario è sostanzialmente diverso se si confrontano i Wealth Manager e le Private Bank tradizionali con le nuove realtà WealthTech. L’osservatorio Deloitte, condotto a livello europeo sui principali player europei di settore e su un panel di oltre 500 Fintech (di cui 65 specializzate in WM) evidenzia come l’innovazione venga applicata con diversi livelli di trasformazione sulle diverse componenti del business. Tipicamente si tratta di innovazioni incrementali sul core business, sono meno frequenti le innovazioni adiacenti o radicali.
Innovation Gap e fattori che favoriscono le opportunità di innovazione

La crescente divergenza tra la curva dei margini di profitto e quella della domanda di mercato, si può spiegare secondo gli studi dell’Osservatorio Deloitte anche in funzione dell’Innovation gap che caratterizza il settore del Wealth Management. I trend di mercato in atto, mostrano opportunità di innovazione, che sono ancora parzialmente sfruttate.
Cambiamenti nel settore: negli ultimi tre anni, più di 50 Fintech hanno avuto successo nel mercato Europeo del Wealth Management con modelli di business basati sulle nuove tecnologie, mentre player tradizionali hanno mantenuto il loro tradizionale modello di business basato sull’interazione personale e sul sistema legacy.
Cambiamenti demografici: il cambiamento generazionale verso i millennials sta diventando sempre più evidente; dal 2020 essi rappresenteranno il 50% dei lavoratori a livello globale e si prevede che la loro ricchezza raddoppierà tra il 2015 e il 2020 rendendoli il prossimo segmento di clienti chiave.
Congiuntura economica: mentre la ricchezza delle famiglie milionarie (lato della domanda) è aumentata più del 60% tra il 2000 e il 2015 in Europa, nello stesso periodo, la redditività dei consulenti finanziari (lato dell’offerta) è diminuita con margini di profitto in calo del 40%
Mercato offshore: sullo sfondo di un’agenda regolamentare globale, la percezione del tradizionale business Wealth sta peggiorando; di conseguenza, i centri di Wealth management come la Svizzera (-7%), Regno Unito (-21%) o Lussemburgo (-11%) hanno subito un rallentamento di patrimoni dal 2009
Nuovi servizi: le soluzioni di investimento digitali come i robo advisor vengono scelte in Europa da clienti private con AUM di 3 €mld che riflettono una piccola quota dei 18 €tln detenuti in asset finanziari dalle famiglie europee
Innovazione si, ma non troppa
I player tradizionali hanno intrapreso negli ultimi dieci anni percorsi di digitalizzazione, in continuità rispetto al modello core, come fattore abilitante per modelli di servizio più efficienti e omnicanali: con la riduzione dei costi in cima alla lista della C-agenda, l’innovazione consente di raggiungere efficienza su ampia scala.
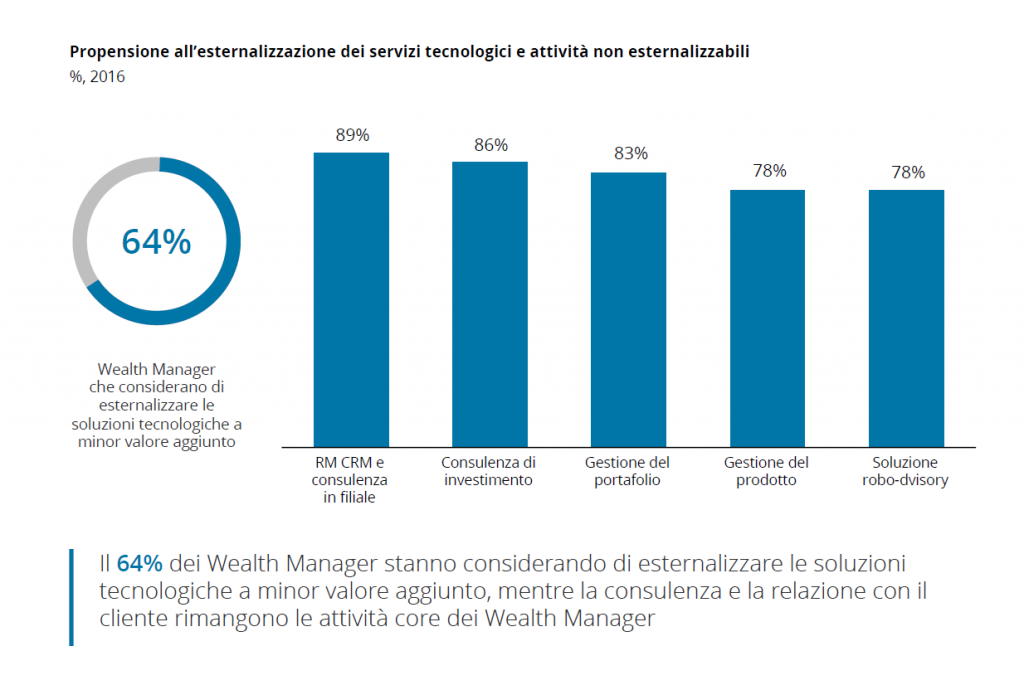
Oltre il 50% dei Wealth Manager sta esplorando l’opportunità di esternalizzazione di alcune attività (attività standard, servizi di back office e servizi non core) verso operatori terzi dotati di un’infrastruttura e soluzioni tecnologiche in grado di raggiungere livelli di efficienza maggiore, al fine di concentrare gli investimenti sulle piattaforme RM (Relationship Management) in grado di offrire un’esperienza a 360° per il Cliente.
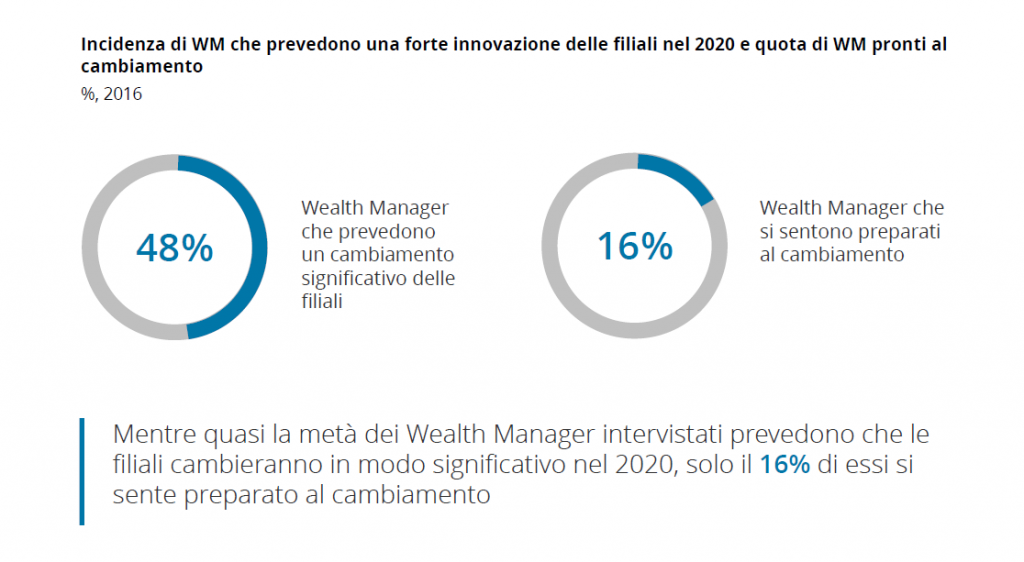
Le soluzioni digitali ampliano infatti i paradigmi di interazione con il Cliente. Il modello distributivo sta abbandonando le soluzioni tradizionali (punti di contatto fisici) con modalità di ingaggio del Cliente a distanza o da remoto; nonostante tutto meno del 20% dei WM dichiarano di essere preparati ai modelli distributivi PHIDigital.
Terza e non ultima novità, riguarda il modello di offerta, dove l’innovazione gioca il ruolo più importante con l’introduzione dei servizi di robo-advisory e portfolio management avanzati.
Ne è evidenza il fatto che, molti giganti del settore (solo per citarne alcuni UBS, JP Morgan, Goldman Sachs), inizialmente scettici, hanno adottato o stanno implementando strategie di Robo-advisory, in particolar modo verso segmenti di Clientela Affluent o HNW.
WealthTech: un rischio o un’opportunità?
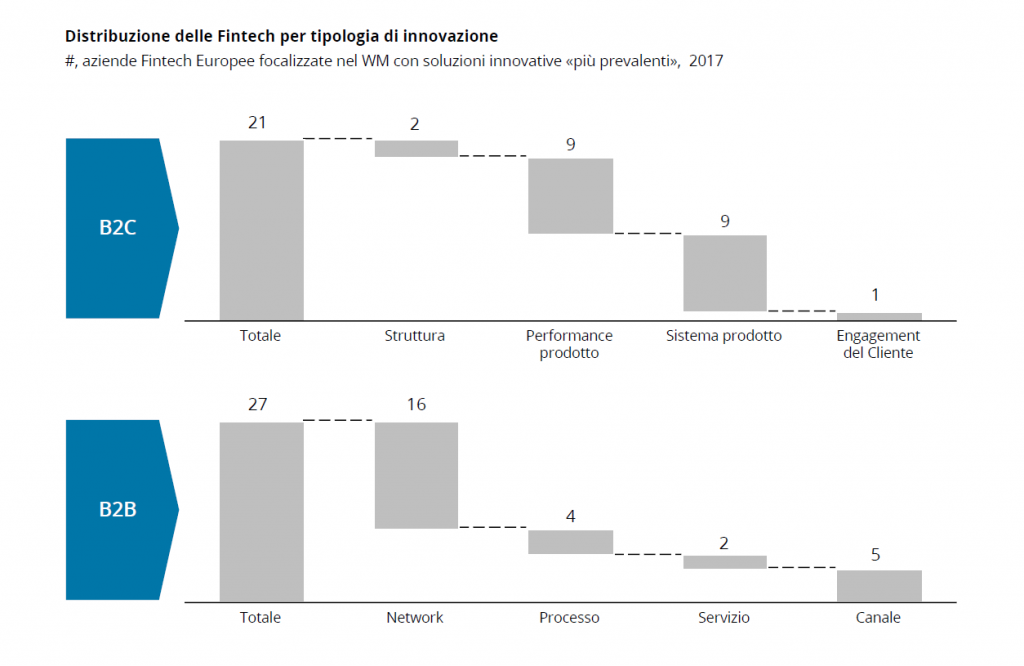
I nuovi Wealth Manager stanno giocando la partita sull’ascolto del Cliente spostando la competizione anche su altre forme di ricavo. Contrariamente a quanto si possa pensare, anche le innovazioni introdotte dalle Fintech e WealthTech si focalizzano sul core business (74%), solo in alcuni casi si tratta invece delle cosiddette innovazioni adiacenti o di vere e proprie trasformazioni.
Da un lato ci sono le WealthTech B2B che propongono ai player tradizionali, che hanno necessità di implementare nuovi servizi digitali per i loro clienti, software innovativi, tool di analytics/ modelli predittivi e altre soluzioni digitali per la gestione del capitale. In particolar modo, queste offrono opportunità di abbattimento dei costi aiutando gli istituti finanziari ad automatizzare i processi manuali, ottimizzare l’asset allocation e centralizzare i processi di gestione del portafoglio. La domanda per i software offerti dalle B2B risulta in aumento anche come conseguenza della crescente pressione regolamentare. Ne sono un esempio le soluzioni di Risk Management che vedono una crescente adoption da parte dei player tradizionali.
D’altro canto, le B2C tech puntano su prodotti e servizi innovativi come robo-advisory, piattaforme peer-2-peer, servizi di micro-investimenti, digital familiy office con soluzioni rigorosamente digital-only. Se le prime possono diventare degli acceleratori per gli Incumbent, le B2C WealthTech possono mettere a rischio la quota di mercato dei Wealth Manager tradizionali modificando le aspettative e i comportamenti di acquisto della Clientela.
Verso nuovi modelli di business
L’analisi delle forze in gioco mostra una forte accelerazione verso il digitale grazie alla maturità di tecnologie abitanti nuovi attori Tech e un progressivo cambiamento della Domanda.
Nonostante tutto, il Wealth Management è tuttora caratterizzato da innovazioni incrementali dei modelli di business esistenti, ma questo forse non basta. Gli operatori del mercato devono mettere in discussione le strategie del passato concentrandosi sulle aspettative del Cliente. Quanto sono ancora efficaci i programmi e le strategie di fidelizzazione?
Le evidenze di mercato confermano la tesi che nei prossimi anni i Wealth Manager dovranno essere in grado di soddisfare le esigenze di Clienti diversi con differenti livelli di autonomia e digital attitude. La vera sfida per l’Advisor è mantenere la sua centralità anche in un contesto di crescente disintermediazione dei servizi tradizionali di portfolio management.
Per questo motivo, a nostro avviso, la vera innovazione del Wealth Management passa da modelli ibridi (e cosiddetti ecosistemi) in cui l’operatore grazie all’impiego di sistemi AI e cognitive analytics, è in grado di offrire servizi di assistenza evoluti e continuativi su misura (finanziari e non) che intervengono in ciascun momento di vita del singolo.
La strategia dei prossimi 5-10 anni richiede la comprensione del ruolo che ogni operatore dovrà rivestire nella catena del valore per il cliente da cui definire quanto digitalizzare e in che modo innovare le varie componenti nel modello di business.
In particolar modo, indipendentemente dalla scelta che si farà (modello di business), i Wealth Manager devono accettare la necessità di investire in nuove capabilities e asset, da un lato integrando nell’organico specialisti fintech e data scientist e dall’altro sostituendo sistemi legacy e centralizzando la gestione dei dati. L’assenza di questi due elementi potrà condizionare il modello di profittabilità dei prossimi anni.
I casi di successo mostrano come le partnership con le Wealth Tech possono solo accelerare il percorso di trasformazione consentendo di sperimentare nuovi servizi per i clienti un time-to-market competitivo per colmare in tempi brevi il famoso Innovation gap e aprire una nuova fase di crescita.
Contatti
Carlo Murolo, Senior Partner, Head of FS Industry, Deloitte Consulting
Luigi Capitanio, Senior Executive, Monitor Deloitte Strategy Consulting
Martina Dell’Anna, Senior Associate, Monitor Deloitte Strategy Consulting
References
Deloitte Private Banking & Wealth Management Database (2017)
European Commission (2015): EU Industrial R&D Investment Scoreboard
Deloitte (2016): Millennial Survey
Fortune (2015): 50 Most Innovative Companies
HBR (2016): To Go Digital, Leaders Have to Change Some Core Beliefs
Deloitte and WealthBriefing (2016): Innovation in Wealth Management
Deloitte (2015): Connecting with clients and reinventing value propositions