The European Commission expressed its intention to review the Solvency Capital Requirement (SCR) calculation under the Standard Formula (SF) before December 2018.
To answer this need, at the beginning of 2017 EIOPA launched a dedicated project aimed at looking for possible simplifications in the SCR calculation, ensuring a proportionate and technically consistent supervisory regime.
The final set of advises was submitted by the Authority to the European Commission last 28 February 2018. Among the relevant items quoted in the set of final advises we have:
- the mortality and longevity risk calibration differently from what communicated in the consultation paper, EIOPA confirms both the longevity (20%) and the mortality (15%) risk parameter stresses, without increasing the risk granularity
- the interest rate risk sub-module EIOPA confirms that current formula should be amended and, differently from what communicated in the consultation paper, advises to adopt a relative shift approach, with parameters that vary in function of the maturity (m)

As the impact of this new methodology is material for the undertaking exposed to the low yield environment (expected decrease of -14% of the Solvency Ratio), EIOPA suggests to gradually move towards the new approach in case of downward shocks, calculating a capital requirement base on a stressed yield curve that will be coincide with the one of the new calculation in the next 3 years, decreasing by j/3 of the difference (new-current) each year j.
Differently from what communicated in the consultation paper, EIOPA confirms both the longevity (20%) and the mortality (15%) risk parameter stresses. Indeed, while the stakeholders agreed on the assessment carried out by the Authority on the longevity risk, they criticised the methodology proposed for the mortality one: as the uncertainty increases over time, the translation of changes in life expectation into instantaneous levels of shocks overstates the value for short durations, penalizing contract with shorter term compared to those lasting for the whole life of the insured. EIOPA agrees with this feedback from the industry, given the simplifications applied to the approach and the results obtained looking at a more granular level.
Given the mixed feedback received on granularity, EIOPA suggests maintaining its advice of having a unique stress applied to all the age groups. This allows to both save implementation costs and not add complexity (because of the interaction with the BE model points).
The life underwriting risk module should reflect, at least, the risk of increased insurance liabilities values resulting from changes in level, trend or volatilities of mortality rates, where an increase/decrease (mortality/longevity risk) of these rates leads to an increase in the value of the insurance liabilities. The losses resulting from changes in the level of mortality rates can be captured by the use of the best estimate mortality tables, while those resulting from changes in the trend can be considered via using the estimated trend for the forecast and development of future cohort mortality tables. Mortality sensitivities can be measured by changes in life expectancies, which can be captured using a stochastic mortality model. EIOPA made use of the Lee-Carter (LC) and Cairns-Blake-Dowd (CBD) models, calibrated to data sourced from the Human Mortality Database (HMD) – no other specific national database was used.
More than the 80% of the EEA population was considered in the calibration, using data from Belgium, Denmark, France, Germany, Greece, Italy, Netherlands, Poland, Spain, Sweden and UK, tracked over the period 1985 – 2013/14/15 (depending on the availability in the HMD; Germany data have only been taken after the reunion dated 1990). The mortality table were extrapolated up to 120 years using the Kannisto rule. As EIOPA does not have access to insured population data, the Authority made the hypothesis that the mortality rates are the same as the one of the general population; there is no consensus on whether these should be higher or lower: in general, insured people are wealthier and should leave longer, but on the other hand some claim that the recent improvements in mortality benefit mainly the general population.
Based on the parameters estimates for each model and country, EIOPA simulated 5000 cohort mortality tables, deriving the life expectancy for each age and time (average value and 0.50% – 99.50% quantiles) and calculating the appropriate shocks to apply to the mortality rates to match

where the expected shocked life expectancy is defined as EIOPA then combined the different shocks into a weighted average over all the countries and later between the two models (LC and CBD). This methodology undergoes thee simplifications:
- the analysis is based on the general population of 11 countries rather than on their insured population
- it does not consider events that do not belong to the dataset, e.g. new cures
- the stresses defined are “equivalent stresses”, applied to all mortality rates of an insured person over the projection. They should instead depend on the age and calendar year of the projection.
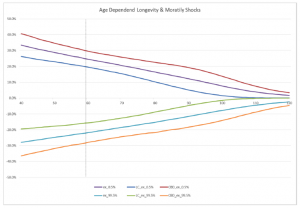
Given this outcome and looking at an age close to 60 years, EIOPA initially proposed to confirm the longevity stress (20%) and to review the mortality one (from 15% to 25%) but then went back on its steps, confirming the mortality one too.
The Authority came up to this decision because of the degree of uncertainty due to the model simplifications and because of the results obtained using a more granular approach: a stress of 25% is too high when short durations (remaining term to maturity) are considered
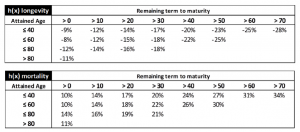
To make these calculation EIOPA has considered the age dependent shocked temporarily like expectancy

optimizing the stress h for each age x and horizon n.
The review of the interest tare risk module is an EIOPA own initiative, driven by the questionable appropriateness of the current approach that is not suitable anymore to represent the real 1 in 200 years shock event: due to the relative calculation of the shocks, the absolute one becomes smaller with decreasing rates and negative rates are not even stressed. This view is shared by the NSAs, that already suggested to review the formula back in 2016, in response to a questionnaire sent by EIOPA.
Although some stakeholders pointed out that the review of the interest risk module should go in hand with the review of the Ultimate Forward Rate (UFR) and the correlation of the entire market risk module, EIOPA prefers to focus on resolving the issues identified, recognizing the importance to define adequate shocks, without waiting until 2020, when the LTG package will be reviewed. EIOPA confirms that no extrapolation toward the UFR is needed on the stressed yield curves (it would increase the complexity, putting the stakeholders in charge of the calculation, without producing appropriate stresses beyond the LLP; furthermore, long term expected rates also change with a changing economic environment). To calibrate the models, EIOPA used its historical risk free data, that cover the period 04.01.1999 up to 2018, containing interest rate values belonging to different environments.
In the consultation paper EIOPA tested three approaches [see Dell’Acqua Silvia, “EIOPA consults on the advices for the SCR review under SF”]:
- symmetric 200 bps minimum shock with a static interest rate floor
- combined approach
- shifted approach
concluding that [C] was not appropriate and proposing one of the other two. Most stakeholders disagreed with EIOPA, commenting that:
- is too simplistic and massively overestimates the risk in the low yield environment; in addition, the derivation of the lower bound is questionable (e.g. why not derive it based on the cost of holding cash?)
- is too complex for the SF and lacks an economic rationale (expert judgement needed); furthermore, because of the min/max operators, the implied forward rates exhibit an erratic behaviour, which makes the calibration of Interest Rate models within the ESG quite challenging
- is suitable, simple, data driven, economically sound and risk sensitive.
In light of the comments received, EIOPA proposes to use the shifted approach, revising its calibration. The idea of the shifted approach is to shift the x-axis upwards, apply a relative stress and shift the x-axis downwards by the same shift amount the equation can be re-written as
 that can be also re-written into its final form

whose parameters values are reported in the table below. The values corresponding to maturities not specified shall be either interpolated or set equal to those corresponding to the min/max maturity specified:
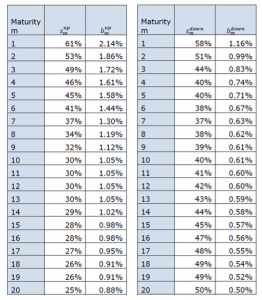
EIOPA reviewed the calibration, proposing that
- the shift parameter shall be different for upward and downward stresses
- for upward stresses, a constant value of 3.5% is adopted, being
- close to the one (3.1%) calculated minimizing the differences of the stresses yield curve under the current SF
- in line, in terms of resulting stresses, with those of 14 different internal models
- for downward stresses, a maturity dependent (m) parameter is adopted being
- economically justified because the lower interest rates have been observed for short maturities
- in line with the hypothesis made by some internal model users
- once the shift parameters are determined, the shifted historical time series can be computed and the annual rolling relative changes derived, giving origin to the relative stress factors, calibrated with a Principal Component Analysis on non-standardized data (they could also be determined as the empirical 0.50% and 99.50% realizations, but the PCA analysis seems more appropriate to capture the high correlation within the data)
- the last calibration step is to select and aggregate a representative data set, needed because the SF defines on single calibration, independent of the currency.


