ESAs draw consumers’ attention to how rises in inflation and interest rates might affect their finances

Mag 16 2023

The three European Supervisory Authorities (EBA, EIOPA and ESMA – ESAs) today published an interactive factsheet to help consumers understand how the recent increases in inflation and interest rates can affect their money. This includes the financial products and services that consumers currently hold or plan to buy, such as loans, savings, financial investments, insurance and pensions…

https://www.esma.europa.eu/press-news/esma-news/esas-draw-consumers-attention-how-rises-inflation-and-interest-rates-might

Euro digital: la rivoluzione che verrà*
a cura di Emilio Barucci

Mag 16 2023
Euro digital: la rivoluzione che verrà*a cura di Emilio Barucci

Grazie all’euro digitale, tra qualche anno sarà possibile effettuare un pagamento elettronico presso un negozio con un grado di privacy simile a quello che sperimentiamo oggi utilizzando le banconote. Sarà possibile tenere i nostri denari formalmente presso una banca ma, di fatto, presso la banca centrale senza avere timore che il bancomat non ce li restituisca. Queste sono le principali novità che l’euro digitale promette di portare con sé nella nostra vita di tutti i giorni.

Il suo disegno comporta scelte politiche che sono strettamente legate ad aspetti tecnologici. Si tratta di valutazioni complesse che fanno capo al Parlamento e alla Commissione Europea. I nodi principali da sciogliere riguardano il livello di privacy, i costi del servizio, il ruolo del pubblico e del privato, il livello di diffusione della nuova moneta.

Dovremo attendere le decisioni politiche per capire come sarà l’euro digitale emesso dall’Eurosistema. Anche la stessa decisione di emetterlo deve essere ancora presa, ma ci sono tutte le condizioni perché si vada in questa direzione. Se questo sarà il caso, la domanda da porsi è la seguente: con quali strumenti effettueremo pagamenti in futuro, tramite banconote, euro custoditi in un deposito bancario o euro digitali custoditi presso un wallet? Le banconote sono destinate a svolgere un ruolo sempre più marginale, il punto è capire come ci orienteremo tra depositi bancari e wallet di euro digitali.

Questi interrogativi portano a due diverse questioni. Nel breve periodo, il problema è incentivare l’adozione dell’euro digitale superando l’inerzia che ogni nuovo strumento di pagamento si porta appresso, nel lungo periodo bisogna capire quale delle due forme è destinata a prevalere, una sola o ambedue?

Il destino dipenderà da quattro considerazioni che ruotano attorno all’euro digitale.

I denari depositati in banca fruttano degli interessi, non si sa ancora con precisione probabilmente anche il wallet in euro digitale sarà remunerato, ma in misura minore rispetto ai depositi bancari. La sua adozione dipenderà dal livello dello spread nella remunerazione tra le due monete.

Il costo dei due servizi potrebbe differire in quanto l’Eurosistema gestirà l’infrastruttura dell’euro digitale mentre i servizi di pagamento al cittadino saranno gestiti dagli intermediari, il ruolo della banca centrale sarà dunque più centrale rispetto a quanto accade adesso nei pagamenti elettronici, questo potrebbe portare ad una qualche forma di sussidio dei servizi di pagamento in euro digitale a carico dell’Eurosistema e, quindi, ad un risparmio per il cittadino. L’euro digitale potrebbe svolgere la funzione di servizio universale.

Sul fronte della privacy non ci dovrebbe essere partita, i pagamenti in euro digitale avranno un livello di privacy almeno pari a quello degli attuali pagamenti effettuati online, il livello sarà superiore nel caso dei pagamenti di prossimità e di piccolo ammontare.

Anche sul fronte dei rischi finanziari l’euro digitale dovrebbe essere superiore rispetto ai pagamenti effettuati tramite deposito bancario, che scontano la possibilità che la banca possa fallire. 

La BCE sta cercando di costruire l’euro digitale in modo tale che il livello di adozione non sia né troppo elevato né troppo basso scongiurando da un lato il rischio che l’euro digitale sia marginale rispetto agli attuali sistemi di pagamento, fallendo così l’obiettivo del recupero di centralità della moneta di banca centrale, e dall’altro di drenare una parte rilevante della raccolta bancaria compromettendo l’attività di intermediazione creditizia con un danno per tutta la società. Il trade-off è tra soddisfare l’esigenza del cittadino e il recupero della centralità monetaria, da un lato, e garantire un bene pubblico quale di fatto è l’intermediazione creditizia dall’altro.

Per raggiungere questo difficile obiettivo, la BCE sta mettendo a punto un meccanismo di remunerazione, vincoli al possesso/alle transazioni in euro digitale e sta cercando di definire la divisione del lavoro tra pubblico e privato. E’ ancora presto per capire cosa succederà, le valutazioni/scelte preliminari sono state condivise con l’industria (intermediari e negozianti) e con le associazioni dei consumatori. L’impostazione che emerge appare solida, il rischio è che possa apparire complessa, scongiurando l’adozione da parte dei cittadini, e che possa essere superata rapidamente dagli eventi, dall’innovazione finanziaria o dai cittadini che potrebbero un domani voler effettuare pagamenti in euro digitale senza vincoli come espressione di libertà, una richiesta che potrebbe trovare ascolto presso le istituzioni politiche Europee. Questo scenario porterebbe ad un massiccio utilizzo dell’euro digitale con un declino della moneta commerciale. Se così fosse, potremmo assistere ad un ridimensionamento strutturale del ruolo degli intermediari creditizi, uno scenario che cambierebbe radicalmente il sistema finanziario. 

Nel tratteggiare quelli che potrebbero essere gli scenari futuri, rischiamo di fare il conto senza l’oste che è rappresentato dalla tecnologia necessaria per emettere l’euro digitale. Alcune funzionalità (utilizzo online/offline, diverso grado di privacy, meccanismo di funding/defunding) richiedono tecnologie che sono disponibili ma che non sono mai state sviluppate per un progetto di così larga portata. Questo è forse l’aspetto che fa tremare davvero i polsi ai banchieri centrali: un conto è emettere banconote, gestire le riserve di qualche migliaio di intermediari, come fa adesso l’Eurosistema, un conto sarà gestire la base monetaria interfacciandosi con milioni di cittadini. Andando a toccare la base monetaria in formato elettronico, i rischi con l’euro digitale saranno davvero molto più rilevanti di quelli che dovette fronteggiare James Bond nel film Agente 007-Missione Goldfinger quando i malfattori volevano contaminare le riserve di oro della Federal Reserves.

Nonostante i rischi e i cambiamenti anche significativi che si prospettano per il sistema finanziario, l’euro digitale si farà perché è il progresso tecnologico a reclamarlo. Siamo di fronte ad un cambiamento delle abitudini dei cittadini dettato dalle nuove tecnologie. Riguardo ciò che ci aspetta possiamo trarre ispirazione da un altro Premio Nobel per l’Economia, Angus Deaton, che nei suoi studi sulla povertà ci invita a guardare il progresso come un fattore che da sempre accompagna la crescita del benessere dell’umanità nonostante gli incidenti di percorso. Sono convinto che sarà così anche per l’euro digitale senza escludere una fase di sperimentazione che sarà tutt’altro che lineare e che lascerà vinti e vincitori sul suo cammino.

*Estratto dalle conclusioni del libro dell’autore Euro digitale, una sfida da vincere nell’interesse di tutti, EGEA editore

Il termometro dei mercati finanziari (12 maggio 2023)
a cura di E. Barucci e D. Marazzina

Mag 13 2023
Il termometro dei mercati finanziari (12 maggio 2023)a cura di E. Barucci e D. Marazzina

L’iniziativa di Finriskalert.it “Il termometro dei mercati finanziari” vuole presentare un indicatore settimanale sul grado di turbolenza/tensione dei mercati finanziari, con particolare attenzione all’Italia.

Significato degli indicatori

  • Rendimento borsa italiana: rendimento settimanale dell’indice della borsa italiana FTSEMIB;
  • Volatilità implicita borsa italiana: volatilità implicita calcolata considerando le opzioni at-the-money sul FTSEMIB a 3 mesi;
  • Future borsa italiana: valore del future sul FTSEMIB;
  • CDS principali banche 10Ysub: CDS medio delle obbligazioni subordinate a 10 anni delle principali banche italiane (Unicredit, Intesa San Paolo, MPS, Banco BPM);
  • Tasso di interesse ITA 2Y: tasso di interesse costruito sulla curva dei BTP con scadenza a due anni;
  • Spread ITA 10Y/2Y : differenza del tasso di interesse dei BTP a 10 anni e a 2 anni;
  • Rendimento borsa europea: rendimento settimanale dell’indice delle borse europee Eurostoxx;
  • Volatilità implicita borsa europea: volatilità implicita calcolata sulle opzioni at-the-money sull’indice Eurostoxx a scadenza 3 mesi;
  • Rendimento borsa ITA/Europa: differenza tra il rendimento settimanale della borsa italiana e quello delle borse europee, calcolato sugli indici FTSEMIB e Eurostoxx;
  • Spread ITA/GER: differenza tra i tassi di interesse italiani e tedeschi a 10 anni;
  • Spread EU/GER: differenza media tra i tassi di interesse dei principali paesi europei (Francia, Belgio, Spagna, Italia, Olanda) e quelli tedeschi a 10 anni;
  • Euro/dollaro: tasso di cambio euro/dollaro;
  • Spread US/GER 10Y: spread tra i tassi di interesse degli Stati Uniti e quelli tedeschi con scadenza 10 anni;
  • Prezzo Oro: quotazione dell’oro (in USD)
  • Euribor 6M: tasso euribor a 6 mesi.
  • Spread 10Y/2Y Euro Swap Curve: differenza del tasso della curva EURO ZONE IRS 3M a 10Y e 2Y;

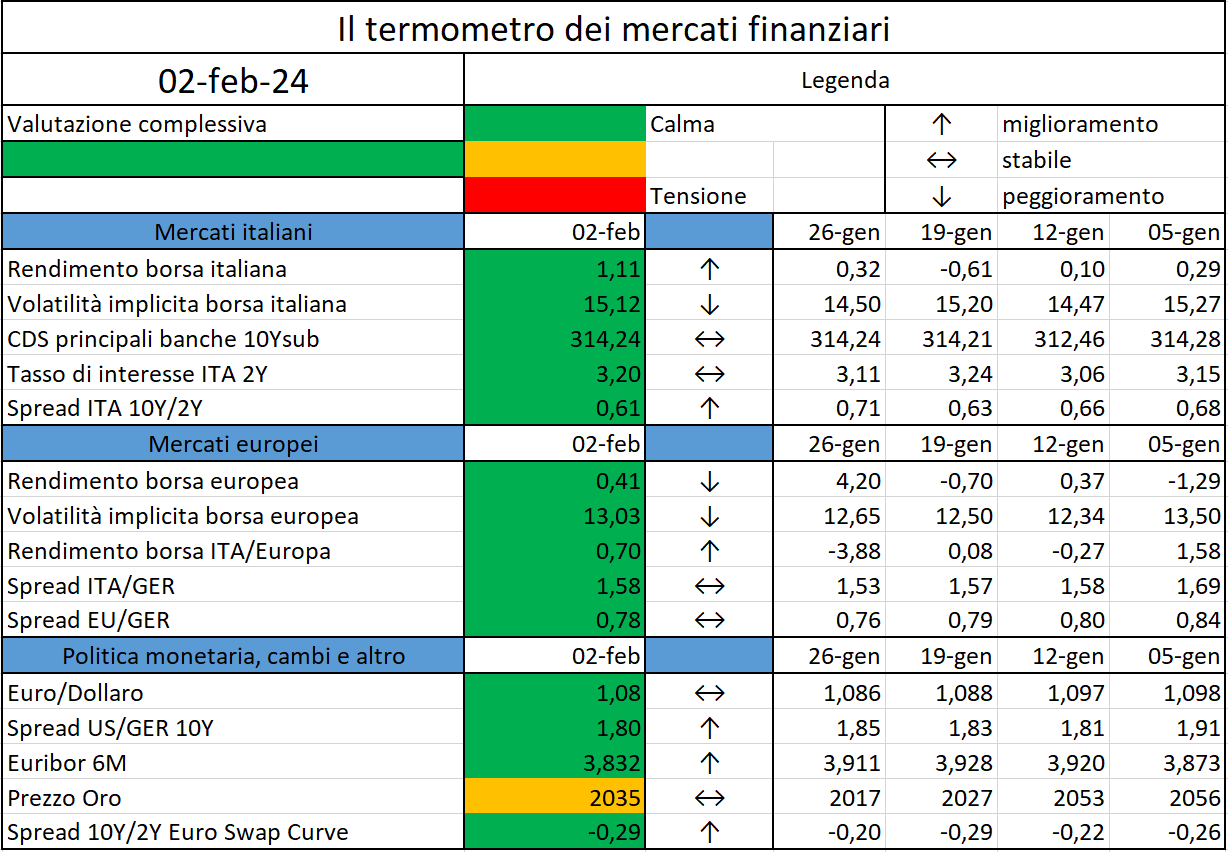
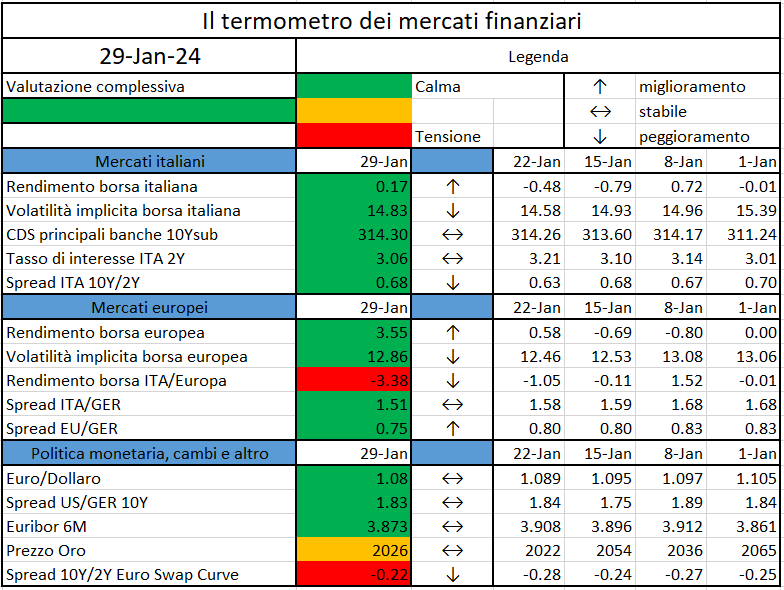
I colori sono assegnati in un’ottica VaR: se il valore riportato è superiore (inferiore) al quantile al 15%, il colore utilizzato è l’arancione. Se il valore riportato è superiore (inferiore) al quantile al 5% il colore utilizzato è il rosso. La banda (verso l’alto o verso il basso) viene selezionata, a seconda dell’indicatore, nella direzione dell’instabilità del mercato. I quantili vengono ricostruiti prendendo la serie storica di un anno di osservazioni: ad esempio, un valore in una casella rossa significa che appartiene al 5% dei valori meno positivi riscontrati nell’ultimo anno. Per le prime tre voci della sezione “Politica Monetaria”, le bande per definire il colore sono simmetriche (valori in positivo e in negativo). I dati riportati provengono dal database Thomson Reuters. Infine, la tendenza mostra la dinamica in atto e viene rappresentata dalle frecce: ↑,↓, ↔  indicano rispettivamente miglioramento, peggioramento, stabilità rispetto alla rilevazione precedente.

Disclaimer: Le informazioni contenute in questa pagina sono esclusivamente a scopo informativo e per uso personale. Le informazioni possono essere modificate da finriskalert.it in qualsiasi momento e senza preavviso. Finriskalert.it non può fornire alcuna garanzia in merito all’affidabilità, completezza, esattezza ed attualità dei dati riportati e, pertanto, non assume alcuna responsabilità per qualsiasi danno legato all’uso, proprio o improprio delle informazioni contenute in questa pagina. I contenuti presenti in questa pagina non devono in alcun modo essere intesi come consigli finanziari, economici, giuridici, fiscali o di altra natura e nessuna decisione d’investimento o qualsiasi altra decisione.

Stress testing with multi-facetedliquidity: the central bank collateral framework as a financial stability tool
a cura di S. Dell’Acqua e E. Merlan

Mag 10 2023

The paper studies the central bank collateral framework and its impact on banks’ liquidity under an
adverse stress test scenario. We construct a stress test model that accounts for a granular and multifaceted representation of the liquidity of marketable and non-marketable assets…

https://www.ecb.europa.eu/pub/pdf/scpwps/ecb.wp2814~142d4a795f.en.pdf?29742c045bc7d80aa84e92349c27cfc0

SII Standard Formula: lapse risk and DPHB in a context of increasing rates
a cura di Silvia Dell’Acqua

Mag 10 2023
SII Standard Formula: lapse risk and DPHB in a context of increasing ratesa cura di Silvia Dell’Acqua

This article is about the risks faced by life insurance companies in a context of increasing rates. It starts with a brief recap of the Solvency II (SII) directive, and, after showing the recent development of the economic scenario, it reports how these risks are measured by the Standard Formula (SF), pointing out the solutions hinted by the market to overcome the drawbacks of the regulatory model, together with a description of a potential reinsurance treaty aimed at mitigating the impact on the capital requirements and position.

SII operates in a risk-based framework and requires insurers to hold sufficient capital to cover several quantifiable risks in very unfavorable situations. The capital adequacy is measured by the Solvency Ratio (SR), expressed as a ratio of Own Funds (OF – available capital, broadly Excess of Assets over Liabilities, EAoL) to Solvency Capital Requirement (SCR). According to the SF calculation, the SCR, to hold in addition to the Technical Provisions (TP), is obtained as the aggregation of modules of selected capital requirements, that cover the risks considered. Each capital requirement is calibrated as a Value at Risk (VaR) measure of the Basic OF (BOF), as impacted by that risk, based on their variation over one year, subject to a stress with a confidence level of 99.50%. As for the Assets, the TP are valued at a “fair price” and consist of a Best Estimate Liability (BEL) plus a Risk Margin (RM). The latter represents the theoretical compensation for the cost of holding regulatory capital against the risk that the future experience will be worse than the assumptions adopted for the BEL calculation. BEL values are defined as the present value of future expected Cash Flows (CFs), discounted by the means of a Risk-Free Rates (RFR) term structure, monthly published by EIOPA (European Insurance and Occupational Pension Authority), together with the prediction of its upward and downward stresses, used in the SCR Interest Rate (IR) risk module.

The following chart shows the evolution of the RFR published by EIOPA in the past four years: the economic scenario has completely changed from a “low lasting yield” perspective to a baseline where there are no signs rates will be dropping any time soon. From 21YE to 22YE a 300-bps rise has been experienced in the very short term, turning into a term structure that is no more increasing monotone and looks almost flat.

Less than two weeks ago, both the European Central Bank (ECB) and the United States Federal Reserve (FED) raised again the interest rates, reaching benchmarks of respectively 3.25% and 5.25%, the highest levels registered since November 2008 and August 2007. These were respectively the seventh and eighth consecutive rate rises carried out by the two institutions. The ECB indicated its intent to continue the hikes going forward, while the FED hinted this could be the last in its own historic series. Both decisions were taken to tackle the inflation and bring it down to a moderate level. The ECB’s one came after an increase to 7% of the headline inflation rate registered in April and the estimates published by the International Monetary Fund (IMF) suggesting a core inflation (that excludes food and energy prices) not reaching the ECB target (2%) until 2025, albeit its recent slight decrease to 5.6% in April. Even though higher interest rates help to curb soaring prices, they can also take a toll in the real economy, increasing the borrowing cost: indeed, a recent ECB survey showed that the banks have tightened access to credit, with the biggest drop in demand for loans registered over a decade. This trend could set a domino effect, dragging further on economy growth, that has barely moved during the last quarter.

Besides that, when rates increase, the market values of Assets decrease, boosting the unrealized losses of banks and life insurance companies holding the financial securities. Apart from the challenges coming from the regulatory capital absorption, this situation becomes a true issue when the customers withdraw their money, whether in a form of cash deposit or policy, forcing the institution to sell the Assets and turn the losses from theorical (unrealized) to actual (realized); the true issue becomes a big problem when it goes in hand with the lack of liquidity.

The financial market has recently attended three of these examples: the default of the Silicon Valley bank in mid-March, the rescue of Credit Swiss by its competitor UBS and the acquisition of First Republic by JP Morgan. In all the three cases, the bankruptcy risk, and the fear of losing their savings, encouraged the clients to leave, triggering a self-fulfilling prophecy.

On the life insurances side, the statistics recently published by ANIA (references [1] and [2]), the National Associations of Italian Insurers, showed a significant increase in lapses (lapse rate from 5.5% in 2020 to 6.7% in 2022), with a boost registered in the last quarter of 2022, that continued in the first months of 2023, turning into negative net flows (premiums minus benefits) for the life insurance companies. In 2022 the total outflows were around 78.5 billion, 70% of which attributable to lapses. Out of these 54.5 billion, 17 were registered in the last quarter (+12.5% compared to 2021) and in February 2023, the lapses reached a peak of 7 billion, with an annual increase around 47%. The saving and investment insurance policies seem no longer able to compete with the high yields provided by BTPs or other deposit accounts.

As said, the SII Directive aims at minimizing the risk for the policyholders to incur a loss in case of failure of the insurance institutions: the SR shall be higher than 100%, and the higher the better. The directive requires a calculation of the BEL that embeds the likelihood of policyholders to exercise contractual options, including lapses and surrenders, supposing a rational conduct in accordance with the market movements, and requires to hold a SCR to cover several risks, among which the rise or fall of the interest rates (IR risk) and the withdrawal of money by the policyholder (Lapse risk).

In a context of high rates, a rationale policyholder is expected to surrender its saving or unit linked insurance policy to buy an alternative instrument that provides a higher yield. The modelling of the Dynamic Policyholder Behavior (DPHB) is particularly relevant in stochastic scenarios, where the dynamic lapses are path dependent. The regulation does not provide a specified formula, but hints some guidelines to follow, such as the need of the risk to be bidirectional and the need of considering the interaction between the DPHB and the Future Management Actions (FMA), that directly influence the contract return, to compare to the market one. The directive also requires all the relevant contractual options to be considered and the exercise rate to be set on both statistical evidence and a sound Expert Judgement, clarifying that the lack of data in extreme scenario does not prevent from assuming the option to be exercised. If the DPHB modelling works properly, in a situation of profitable business and increasing interest rates, the OF drop because of the increase in TP lead by the higher cost of exercise of the options embedded in the contract.

Under the SF, the IR risk capital requirement is defined as the larger of the following:

  • the capital requirements for the risk of an increase in the term structure of interest rates (the increase is applied as a relative change to each maturity, with a scalar that goes from 70% for the 1y maturity to 20% for maturities equal or higher than 90y, and cannot be lower than 100bps in absolute value)
  • the capital requirements for the risk of a decrease in the term structure of interest rates (the increase is applied as a relative change to each maturity, with a scalar that goes from 75% for the 1y maturity to 20% for maturities equal or higher than 90y; no stress being applied to base negative rates).

The interest rate risk sub-module flows into market risk module with a correlation to the Equity, Property and Spread risks that varies according to the biting scenario, with the interest up being the most diversified. The exposure to the IR risk follows the Asset/Liabilities duration gap: positive gaps (Assets longer than Liabilities) suffer an increase in interest rates, negative gaps suffer a decrease in interest rates. Life insurance companies tend to adjust their Assets duration to match the liabilities one, therefore avoiding a significant interest rate risk capital absorption. Usually, the business model of life insurance companies is long termed, being their liabilities characterized by quite high durations, and the duration gap slightly negative, but this can vary from undertaking to undertaking and, within the same undertaking, from segregated fund to segregated fund. In a context of increasing rates, the discount effect on the liability side is stronger than on the Asset side, resulting in a gain/loss of OF for negative/positive durations gaps, accompanied by an increase in the SCR IR risk module, that comes from the nature of the stress: a relative shock gets bigger in absolute terms when applied to a higher base. However, the IR risk magnitude can be kept under control by matching the durations, while the lapse risk remains challenging in context of high rates. Indeed, in this scenario, policyholders are expected to lapse more, and profitable businesses suffer from both a decrease in OF and an increase in SCR, with a significant impact in the lapse risk module, driven by the mass scenario. Indeed, the lapse risk capital requirement measures the adverse changes in liabilities due to a change in expected exercise rates and is defined as the larger of the following:

  • capital requirement for the risk of a permanent instantaneous 50% increase in lapse rates, with stressed rates not exceeding 100% (lapse up scenario)
  • capital requirement for the risk of a permanent instantaneous 50% decrease in lapse rates, with a correspondent absolute variation not exceeding 20% (lapse down scenario)
  • capital requirement for the risk of an instantaneous 40% (70% for mutual pension business) lapse rate of the outstanding policies at the calculation date (lapse mass scenario).

As discussed in the following, the SF appears to underestimate the IR risk (both in case of downward and upward movement), and to overestimate the lapse mass risk. To make up for the former issue, with the goal of ensuring a better protection to the policyholders, in September 2021 the European Commission (EC) published a legislative package aimed at amending the SII Directive. The latter issue, instead, has been investigated by the market, where life insurance companies adopting the SF looked for different solutions aimed at mitigating the massive increase in the SCR driven by the lapse mass scenario in a context of high rates.

Albeit everybody knows how hard is to predict the future rate environment, the following charts show that the EIOPA expectations of a rate decrease / increase (as a stress at a 99.50% confidence level over a 1-year period) have proved not to be adequate compared to the actual 1-year movement registered back in December 2019 (19YE_dw vs 20YE_base) and December 2021 (21YE_up vs 22YE_base). The areas between the green/blue dotted line and the orange/red one indicate the underestimation of the downward/upward risk by the SF, with the actual movement over one year much larger compared to the one expected to happen one every 200 years.

To fix this issue, the EC hinted to modify the IR risk calibration into a relative shift approach, with a phase-in mechanism of 5 years. The details of the calculation will be released in an update of the Delegates Acts, likely following the proposal from EIOPA, with shocked interest rates in the downward scenario floored to a minimum of -1.25%. The legislative proposal published by the EC is now being discussed by Member States, Stakeholders, and the European Parliament (EP), and the finalization of the legislative process may last few years.

Concerning the capital requirement needed to cover the lapse risk, the nature of the shock envisaged by the SF for the mass scenario (40% of immediate redemptions) seems to be unrealistic, also when compared to the stress level indicated by EIOPA in the 2021 Stress Test (20% of immediate redemptions) which is also like the average shock calibrated by the companies adopting the internal model. Furthermore, it can be questioned the good sense of maintaining the same base lapse assumptions and DPHB rules after this kind of shock: probably, it would be more realistic to decrease the base lapse level. As shown in the following bar diagrams (Fig 1 and Fig 2, reference #[3]), together with the increase in the interest rates and the DPHB application, the lapse mass scenario has significant hit the SII position of undertakings using the SF, where the lapse mass risk has doubled in terms of aggregate SCR, becoming the predominant lapse scenario among the three.

In its July 22 report on the SII trends [3], ANIA pointed out that the current methodology of the SF presents dome critical elements, including assumptions and parameters inconsistent with the real Dynamics of the PHB; it also hinted the adoption of specifical reinsurance contracts to be too little, although, back in July 2021, EIOPA recommended to consider similar solutions in its “Opinion on the use of risk mitigating techniques by insurance and reinsurance undertakings”. To mitigate these issues, life insurance companies started looking for different solutions aimed at increasing the SR, both reducing the SCR or increasing the OF. Based on the public information as at 22YE, different undertakings have already implemented mass lapse reinsurance treaties. An example of mass lapse treaty is provided in the following.

A mass lapse reinsurance treaty is a stop-loss cover against the lapse mass risks, that limits the losses in OF in a range defined by:

  • an attachment point, set based on the Best Estimate lapse rate level increased by an extra lapse rate of about 15%-30% (the lower this is, the higher the risk transfer) and
  • a detachment point, usually corresponding to the regulatory shock (i.e., 40% lapse rate or higher).

The following chart shows an illustrative reinsurance structure with an attachment and detachment points corresponding to a lapse rate of respectively 20% and 40%.

The resulting payout follows the potential losses in OF faced by the undertaking between the attachment and detachment points and grows linearly: no reimbursements are due before the attachment point and no further reimbursements are due after the detachment point. The maximum payout payable by the reinsurer, generally referred to as the “Risk Notional”, dotted line area in the chart, represents the difference in OF losses measured in the detachment and attachment points and is used to derive the reinsurance premium. The reinsurance premium is indeed represented by a fee of the Risk Notional and is set by the reinsurer based on a number of factors, such as the company’s best estimate lapse rates, the type of business, the distribution channels, and the level of risk transfer to achieve (the lower the attachment lapse rate, the higher risk transfer). The duration of the reinsurance cover is set upon request and is usually higher than 2 years, to allow for the Solvency II eligibility, where the SCR is defined over a 1-year horizon.

Beside the reduction in the exposure to potential actual mass lapse events, the key impacts on the SR are driven by the reduction in:

  • SCR, determined by the reduction of the mass lapse required capital
  • RM, tamed by the mass lapse cover, depending on the reinsurance treaty duration
  • OF, because of reinsurance costs, typically spanning a range of 1% – 5% of the maximum theoretical loss carried by the reinsurer.

References:

  • ANIA, TRENDS Newsletter by study office – Year XIX – number 04, April 2023
  • ANIA, TRENDS Life net flows and liabilities – Year XII – number 04, February 2023
  • ANIA, TRENDS Solvency – Year III – number 07, July 2022
  • EIOPA, Opinion on the use of risk mitigation techniques by insurance undertakings, July 2021