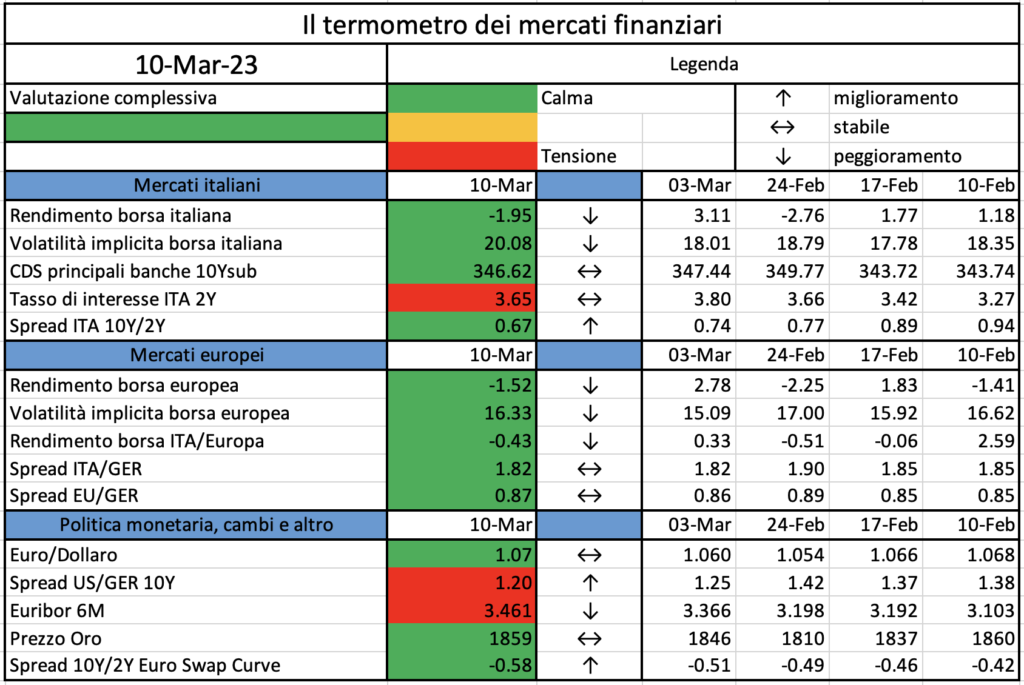
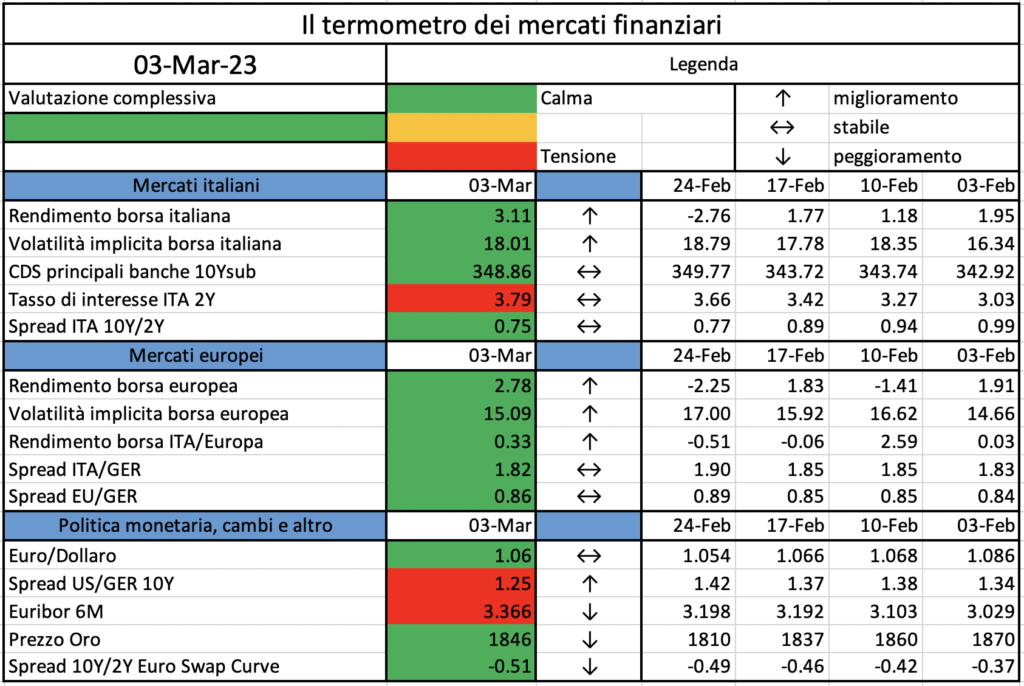
Il termometro dei mercati finanziari (6 Gennaio 2023)
a cura di E. Barucci e D. Marazzina

Gen 08 2023
Il termometro dei mercati finanziari (6 Gennaio 2023)a cura di E. Barucci e D. Marazzina

L’iniziativa di Finriskalert.it “Il termometro dei mercati finanziari” vuole presentare un indicatore settimanale sul grado di turbolenza/tensione dei mercati finanziari, con particolare attenzione all’Italia.

Significato degli indicatori

  • Rendimento borsa italiana: rendimento settimanale dell’indice della borsa italiana FTSEMIB;
  • Volatilità implicita borsa italiana: volatilità implicita calcolata considerando le opzioni at-the-money sul FTSEMIB a 3 mesi;
  • Future borsa italiana: valore del future sul FTSEMIB;
  • CDS principali banche 10Ysub: CDS medio delle obbligazioni subordinate a 10 anni delle principali banche italiane (Unicredit, Intesa San Paolo, MPS, Banco BPM);
  • Tasso di interesse ITA 2Y: tasso di interesse costruito sulla curva dei BTP con scadenza a due anni;
  • Spread ITA 10Y/2Y : differenza del tasso di interesse dei BTP a 10 anni e a 2 anni;
  • Rendimento borsa europea: rendimento settimanale dell’indice delle borse europee Eurostoxx;
  • Volatilità implicita borsa europea: volatilità implicita calcolata sulle opzioni at-the-money sull’indice Eurostoxx a scadenza 3 mesi;
  • Rendimento borsa ITA/Europa: differenza tra il rendimento settimanale della borsa italiana e quello delle borse europee, calcolato sugli indici FTSEMIB e Eurostoxx;
  • Spread ITA/GER: differenza tra i tassi di interesse italiani e tedeschi a 10 anni;
  • Spread EU/GER: differenza media tra i tassi di interesse dei principali paesi europei (Francia, Belgio, Spagna, Italia, Olanda) e quelli tedeschi a 10 anni;
  • Euro/dollaro: tasso di cambio euro/dollaro;
  • Spread US/GER 10Y: spread tra i tassi di interesse degli Stati Uniti e quelli tedeschi con scadenza 10 anni;
  • Prezzo Oro: quotazione dell’oro (in USD)
  • Spread 10Y/2Y Euro Swap Curve: differenza del tasso della curva EURO ZONE IRS 3M a 10Y e 2Y;
  • Euribor 6M: tasso euribor a 6 mesi.

I colori sono assegnati in un’ottica VaR: se il valore riportato è superiore (inferiore) al quantile al 15%, il colore utilizzato è l’arancione. Se il valore riportato è superiore (inferiore) al quantile al 5% il colore utilizzato è il rosso. La banda (verso l’alto o verso il basso) viene selezionata, a seconda dell’indicatore, nella direzione dell’instabilità del mercato. I quantili vengono ricostruiti prendendo la serie storica di un anno di osservazioni: ad esempio, un valore in una casella rossa significa che appartiene al 5% dei valori meno positivi riscontrati nell’ultimo anno. Per le prime tre voci della sezione “Politica Monetaria”, le bande per definire il colore sono simmetriche (valori in positivo e in negativo). I dati riportati provengono dal database Thomson Reuters. Infine, la tendenza mostra la dinamica in atto e viene rappresentata dalle frecce: ↑,↓, ↔  indicano rispettivamente miglioramento, peggioramento, stabilità rispetto alla rilevazione precedente.

Disclaimer: Le informazioni contenute in questa pagina sono esclusivamente a scopo informativo e per uso personale. Le informazioni possono essere modificate da finriskalert.it in qualsiasi momento e senza preavviso. Finriskalert.it non può fornire alcuna garanzia in merito all’affidabilità, completezza, esattezza ed attualità dei dati riportati e, pertanto, non assume alcuna responsabilità per qualsiasi danno legato all’uso, proprio o improprio delle informazioni contenute in questa pagina. I contenuti presenti in questa pagina non devono in alcun modo essere intesi come consigli finanziari, economici, giuridici, fiscali o di altra natura e nessuna decisione d’investimento o qualsiasi altra decisione

IVASS proposes amendments to Regulation n.18 on TP
a cura di Silvia Dell’Acqua

Gen 08 2023
IVASS proposes amendments to Regulation n.18 on TP a cura di Silvia Dell’Acqua

Following the guidelines published by EIOPA last 6 July 2022 on the evaluation of Technical Provisions (TP) and the identification of Contract Boundaries (CB) under the SII framework, last 22 December 2022 the Italian Insurance Supervisory Authority, IVASS, published the Consultation Document no. 10/2022, that amends the Regulation no. 18/2016 concerning the application rules for the TP calculation. Any comment from the industry shall be sent to IVASS by next 20 February 2023 and once the consultation phase will be over, the comments received and the consequent resolutions by IVASS will be shared to the public.

The final goal of the consultation document is to avoid an unlevel playing filed, characterized by several divergent practices adopted by the industry in the TP evaluation. To this aim, IVASS clarifies topics such as

  • Contractual Boundaries (CB)
  • Assumptions and Expert Judgment (EJ)
  • Expense modelling and allocation
  • Dynamic Policyholder Behaviour (DPHB)
  • Future Management Actions (FMA)
  • Time Value of Options and Guarantees (TVOG) and Economic Scenarios Generators (ESG)
  • Expected Profits In Future Premiums (EPIFP)

CONTRACTUAL BOUNDARIES

Contract Boundaries (CB) determine the premiums and obligations that belong to the contract, considering rights and risks for the undertakings. In Title II (General principles and application rules for the TP calculation), Chapter I (Recognition of Obligations), Art. 7 has been amended to clarify that a contract can be unbundled if and only if two (or more) parts of it are equivalent in terms of risk to two (or more) contracts that could be sold separately; while Art. 8bis and 8-ter have been inserted to regulate that a financial guarantee / coverage has a discernible effect on the economics of a contract only when linked to the payment of future premiums, providing the policyholder with a discernible financial advantage. The assessment, either qualitative or quantitative, should compare the present value of the expected cash flows of the contract with and without the financial guarantee / coverage and should appraise when the difference is discernible. When the benefits depend on the market returns, for sake of comparison, the risk-free yields shall be adopted without Volatility Adjustment (VA) or Matching Adjustment (MA) and a stochastic evaluation shall be carried out. Finally, Art. 8-quarter has been inserted to clarify that CB are expected to remain constant, however a reassessment can be triggered by changes in the contract terms or the relevant external environment. To ensure coherency in the evaluation, CB should remain constant through all the scenarios of the stochastic valuation, as well as in the stressed scenarios adopted for the SCR calculation.

ASSUMPTIONS AND EXPERT JUDGEMENT (EJ)

EJ is widely used by the undertakings when setting assumptions for valuation purposes and can modify the results in a sensible manner. Therefore, in Title II (General principles and application rules for the TP calculation), Chapter IV (Assumptions underlying the TP calculation), Art. 30-bis, 30-ter, 30-quarter, 30-quinquies, 30-sexies have been inserted to clarify that, from a corporate governance profile, the usage of EJ shall be commensurate to the resulting impact (also considering extreme scenarios not yet experienced by the undertaking), and shall follow a validated and well documented process (strengthened, when appropriate, by stress tests and sensitivity test), where the assumptions shall be defined following criteria that do not change over time, adapted to the usage they are intended for and approved at a sufficiently high hierarchical level, according to their relevance (it must be clarified how much the uncertainty around the assumptions can vary the final outcomes). The assumptions definition, together with the EJ adopted, shall be documented in a transparent manner, describing the methodologies, the panel of experts and the period of validity and any material deviation from actual data or previous settings. Finally, the undertaking should also identify potential situations where the assumptions would not be valid.

EXPENSE MODELLING and ALLOCATION

In Title II (General principles and application rules for the TP calculation), Chapter IV (Assumptions underlying the TP calculation), Art. 32-bis has been included to clarify that administrative and trading expenses shall be considered in the projection and the reimbursements of investment management expenses shall be considered as other incoming cash flows (and other outcoming cashflows in case the reimbursement is shared with the policyholders or other third parties). Art. 35 has been integrated to specify that general expenses shall be projected in a realistic manner, consistent over time, in coherence with a long-term commercial strategy; Art. 37 has been integrated to regulate the usage of inflation to increase the costs over time.

DYNAMIC POLICYHOLDER BEHAVIOUR

In Title II (General principles and application rules for the TP calculation), Chapter V (treatment of financial guarantees and contractual options), Art. 41-bis, 41-ter, 41-quarter have been inserted to regulate the need of defining the assumption based on both statistical evidence (when representative of future conduct) and a sound EJ (if needed). Lack of data in extreme scenario shall not prevent the undertaking from assuming the option to be exercised. The dependency on the trigger event and the exercise rate of the option is bidirectional: both increases and decreases shall be considered. Finally, all relevant contractual options shall be considered, including the option to pay additional premiums (top ups) or to vary their amount

FUTURE MANAGEMENT ACTIONS (FMA)

In Title II (General principles and application rules for the TP calculation), Chapter VI (Future Management Actions and hypothesis on future profit sharing), Art. 42-bis, 42-ter have been introduced to regulate the need of formalization for the process that defines the FMA and their relations with the new business. Specifically, the FMA plan, approved by the administrative, management or supervisory body, shall be either in the form of a single document or a set of documents accompanied by an inventory, where all the assumption for the FMA used in the Best Estimate calculation are reported. Realistic assumptions on NB and on other related topics (asset allocation, profit sharing or duration gag) shall be considered and shall not be influenced by the application of contract boundaries.

TVOG and ECONOMIC SCENARIO GENERATOR

In Title III (Methodologies for the TP calculation), Chapter I (Assessment of proportionality), Art. 44 has been amended to better define the principle of proportionality, that shall not materially change the value of the liabilities. In Chapter III (Methodologies for the evaluation of contractual options and financial guarantees), Art. 52-bis has been inserted to regulate the need of stochastic evaluations in presence of any kind of profit-sharing mechanism with future benefits depending on the return of the assets and in presence of other financial guarantees (like technical rates), even more so when combined with options (like surrender options), whose dynamic modelling increases the value in extreme scenarios. Finally, in Chapter IV (economic scenario generators), Art. 56-bis has been inserted to regulate that the ESG modelling adequately reflects the volatility of the assets by considering all the relevant sources of volatility, including spread risk and default risk and negative interest rates.

EXPECTED PROFITS IN FUTURE PREMIUMS

In Title III (Methodologies for the TP calculation), Chapter IX (expected profits in future premiums), Art. 75 has been amended to clarify that when calculating the EPIFP all the assumptions (mortality, lapse, expenses, DPHB, FMA, …) shall remain unchanged, but the expectation to receive future premiums, that must be nullified (consequently, the volumes of some expenses may be influenced); Art. 75-bis has been inserted to regulate that an alternative calculation can be adopted, if a similar result is provided.

Reference:

  • IVASS, Documento di consultazione n. 10/2022, 22 December 2022

EIOPA publishes monthly technical information for Solvency II Relevant Risk Free Interest Rate Term Structures – end-December 2022

Gen 08 2023

Today, the European Insurance and Occupational Pensions Authority (EIOPA) published technical information on the relevant risk-free interest rate term structures (RFR) with reference to the end of December 2022…

https://www.eiopa.europa.eu/media/news/eiopa-publishes-monthly-technical-information-solvency-ii-relevant-risk-free-interest-15_en

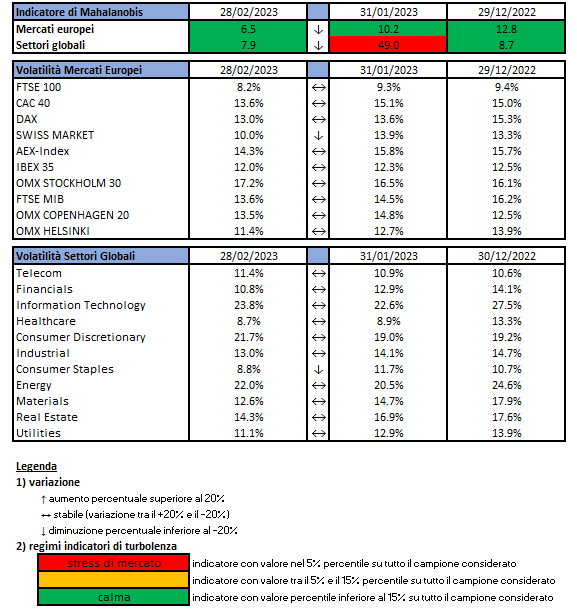
Indice di turbolenza dei mercati (30 Dicembre 2022)

Gen 03 2023
Indice di turbolenza dei mercati (30 Dicembre 2022)

a cura di Gianni Pola e Antonello Avino

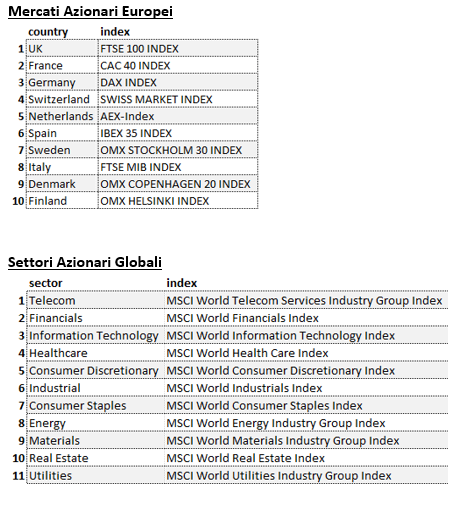
Gli indici utilizzati sono:

Questa immagine ha l'attributo alt vuoto; il nome del file è Immagine-4.png

Le volatilità riportate sono storiche e calcolate sugli ultimi 30 trading days disponibili. Per ogni asset-class dunque sono prima calcolati i rendimenti logaritmici dei prezzi degli indici di riferimento, successivamente si procede col calcolo della deviazione standard dei rendimenti, ed infine si procede a moltiplicare la deviazione standard per il fattore di annualizzazione.

Per il calcolo della distanza di Mahalnobis si procede dapprima con la stima della matrice di covarianza tra le asset-class. Si considera l’approccio delle finestre mobili. Come con la volatilità, si procede prima con il calcolo dei rendimenti logaritmici e poi con la stima storica della matrice di covarianza, come riportato di seguito.

Supponendo una finestra mobile di  T periodi, viene calcolato il valore medio e la matrice varianza covarianza al tempo t come segue:

Questa immagine ha l'attributo alt vuoto; il nome del file è image-6.png

La distanza di Mahalanobis è definita formalmente come:

Questa immagine ha l'attributo alt vuoto; il nome del file è image-7.png

Le parametrizzazioni che sono state scelte sono:

  • Rilevazioni mensili
  • Tempo T della finestra mobile pari a 5 anni (60 osservazioni mensili)

Le statistiche percentili sono state calcolate a partire dalla distribuzione dell’indicatore di Mahalanobis dal Dicembre 1997 al Dicembre 2019 su rilevazioni mensili.

Ulteriori dettagli sono riportati in questo articolo.

Disclaimer: Le informazioni contenute in questa pagina sono esclusivamente a scopo informativo e per uso personale. Le informazioni possono essere modificate da finriskalert.it in qualsiasi momento e senza preavviso. Finriskalert.it non può fornire alcuna garanzia in merito all’affidabilità, completezza, esattezza ed attualità dei dati riportati e, pertanto, non assume alcuna responsabilità per qualsiasi danno legato all’uso, proprio o improprio delle informazioni contenute in questa pagina. I contenuti presenti in questa pagina non devono in alcun modo essere intesi come consigli finanziari, economici, giuridici, fiscali o di altra natura e nessuna decisione d’investimento o qualsiasi altra decisione deve essere presa unicamente sulla base di questi dati.

Il termometro dei mercati finanziari (16 Dicembre 2022)

Dic 18 2022
Il termometro dei mercati finanziari (16 Dicembre 2022)

a cura di Emilio Barucci e Daniele Marazzina

L’iniziativa di Finriskalert.it “Il termometro dei mercati finanziari” vuole presentare un indicatore settimanale sul grado di turbolenza/tensione dei mercati finanziari, con particolare attenzione all’Italia.

Significato degli indicatori

  • Rendimento borsa italiana: rendimento settimanale dell’indice della borsa italiana FTSEMIB;
  • Volatilità implicita borsa italiana: volatilità implicita calcolata considerando le opzioni at-the-money sul FTSEMIB a 3 mesi;
  • Future borsa italiana: valore del future sul FTSEMIB;
  • CDS principali banche 10Ysub: CDS medio delle obbligazioni subordinate a 10 anni delle principali banche italiane (Unicredit, Intesa San Paolo, MPS, Banco BPM);
  • Tasso di interesse ITA 2Y: tasso di interesse costruito sulla curva dei BTP con scadenza a due anni;
  • Spread ITA 10Y/2Y : differenza del tasso di interesse dei BTP a 10 anni e a 2 anni;
  • Rendimento borsa europea: rendimento settimanale dell’indice delle borse europee Eurostoxx;
  • Volatilità implicita borsa europea: volatilità implicita calcolata sulle opzioni at-the-money sull’indice Eurostoxx a scadenza 3 mesi;
  • Rendimento borsa ITA/Europa: differenza tra il rendimento settimanale della borsa italiana e quello delle borse europee, calcolato sugli indici FTSEMIB e Eurostoxx;
  • Spread ITA/GER: differenza tra i tassi di interesse italiani e tedeschi a 10 anni;
  • Spread EU/GER: differenza media tra i tassi di interesse dei principali paesi europei (Francia, Belgio, Spagna, Italia, Olanda) e quelli tedeschi a 10 anni;
  • Euro/dollaro: tasso di cambio euro/dollaro;
  • Spread US/GER 10Y: spread tra i tassi di interesse degli Stati Uniti e quelli tedeschi con scadenza 10 anni;
  • Prezzo Oro: quotazione dell’oro (in USD)
  • Spread 10Y/2Y Euro Swap Curve: differenza del tasso della curva EURO ZONE IRS 3M a 10Y e 2Y;
  • Euribor 6M: tasso euribor a 6 mesi.

I colori sono assegnati in un’ottica VaR: se il valore riportato è superiore (inferiore) al quantile al 15%, il colore utilizzato è l’arancione. Se il valore riportato è superiore (inferiore) al quantile al 5% il colore utilizzato è il rosso. La banda (verso l’alto o verso il basso) viene selezionata, a seconda dell’indicatore, nella direzione dell’instabilità del mercato. I quantili vengono ricostruiti prendendo la serie storica di un anno di osservazioni: ad esempio, un valore in una casella rossa significa che appartiene al 5% dei valori meno positivi riscontrati nell’ultimo anno. Per le prime tre voci della sezione “Politica Monetaria”, le bande per definire il colore sono simmetriche (valori in positivo e in negativo). I dati riportati provengono dal database Thomson Reuters. Infine, la tendenza mostra la dinamica in atto e viene rappresentata dalle frecce: ↑,↓, ↔  indicano rispettivamente miglioramento, peggioramento, stabilità rispetto alla rilevazione precedente.

Disclaimer: Le informazioni contenute in questa pagina sono esclusivamente a scopo informativo e per uso personale. Le informazioni possono essere modificate da finriskalert.it in qualsiasi momento e senza preavviso. Finriskalert.it non può fornire alcuna garanzia in merito all’affidabilità, completezza, esattezza ed attualità dei dati riportati e, pertanto, non assume alcuna responsabilità per qualsiasi danno legato all’uso, proprio o improprio delle informazioni contenute in questa pagina. I contenuti presenti in questa pagina non devono in alcun modo essere intesi come consigli finanziari, economici, giuridici, fiscali o di altra natura e nessuna decisione d’investimento o qualsiasi altra decisione deve essere presa unicamente sulla base di questi dati.