The European Securities and Markets Authority (ESMA), the EU financial market regulator and supervisor, has published its annual market report on EU carbon markets…
Ott
26
2025
The European Securities and Markets Authority (ESMA), the EU financial market regulator and supervisor, has published its annual market report on EU carbon markets…

L’iniziativa di Finriskalert.it “Il termometro dei mercati finanziari” vuole presentare un indicatore settimanale sul grado di turbolenza/tensione dei mercati finanziari, con particolare attenzione all’Italia.
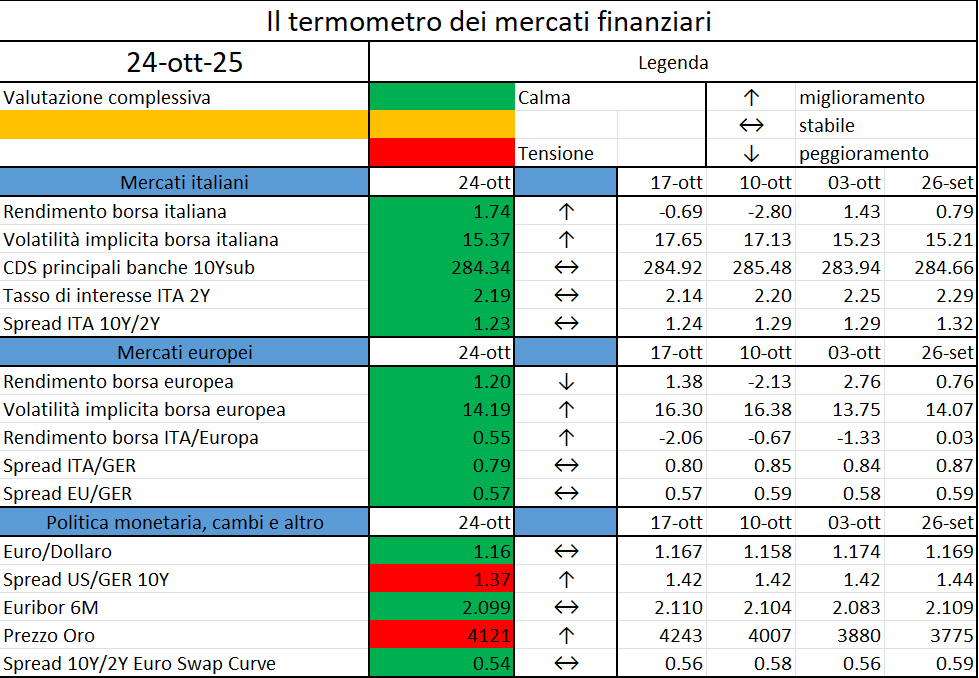
I colori sono assegnati in un’ottica VaR: se il valore riportato è superiore (inferiore) al quantile al 15%, il colore utilizzato è l’arancione. Se il valore riportato è superiore (inferiore) al quantile al 5% il colore utilizzato è il rosso. La banda (verso l’alto o verso il basso) viene selezionata, a seconda dell’indicatore, nella direzione dell’instabilità del mercato. I quantili vengono ricostruiti prendendo la serie storica di un anno di osservazioni: ad esempio, un valore in una casella rossa significa che appartiene al 5% dei valori meno positivi riscontrati nell’ultimo anno. Per le prime tre voci della sezione “Politica Monetaria”, le bande per definire il colore sono simmetriche (valori in positivo e in negativo). I dati riportati provengono dal database Thomson Reuters. Infine, la tendenza mostra la dinamica in atto e viene rappresentata dalle frecce: ↑,↓, ↔ indicano rispettivamente miglioramento, peggioramento, stabilità rispetto alla rilevazione precedente.
The simultaneous rise in volatility across assets signals a widespread risk-off sentiment among investors…
La Banca d’Italia diffonde le proiezioni macroeconomiche per l’Italia nel triennio 2025-27. Le proiezioni sono elaborate dagli esperti della Banca d’Italia e sono basate sulle informazioni disponibili al 10 ottobre…
Since our last meeting in April, global economic activity has remained subdued but steady, despite ongoing trade policy headwinds. This resilience partly reflected a frontloading of demand in anticipation of tariffs, which temporarily boosted activity but is unlikely to be sustained…
https://www.ecb.europa.eu//press/key/date/2025/html/ecb.sp251017~cb692052ae.en.html
The European Securities and Markets Authority (ESMA), the EU’s financial markets regulator and supervisor, has today published its second consolidated report on sanctions and measures imposed in Member States in 2024…
https://www.esma.europa.eu/press-news/esma-news/esma-publishes-second-consolidated-report-sanctions

L’iniziativa di Finriskalert.it “Il termometro dei mercati finanziari” vuole presentare un indicatore settimanale sul grado di turbolenza/tensione dei mercati finanziari, con particolare attenzione all’Italia.
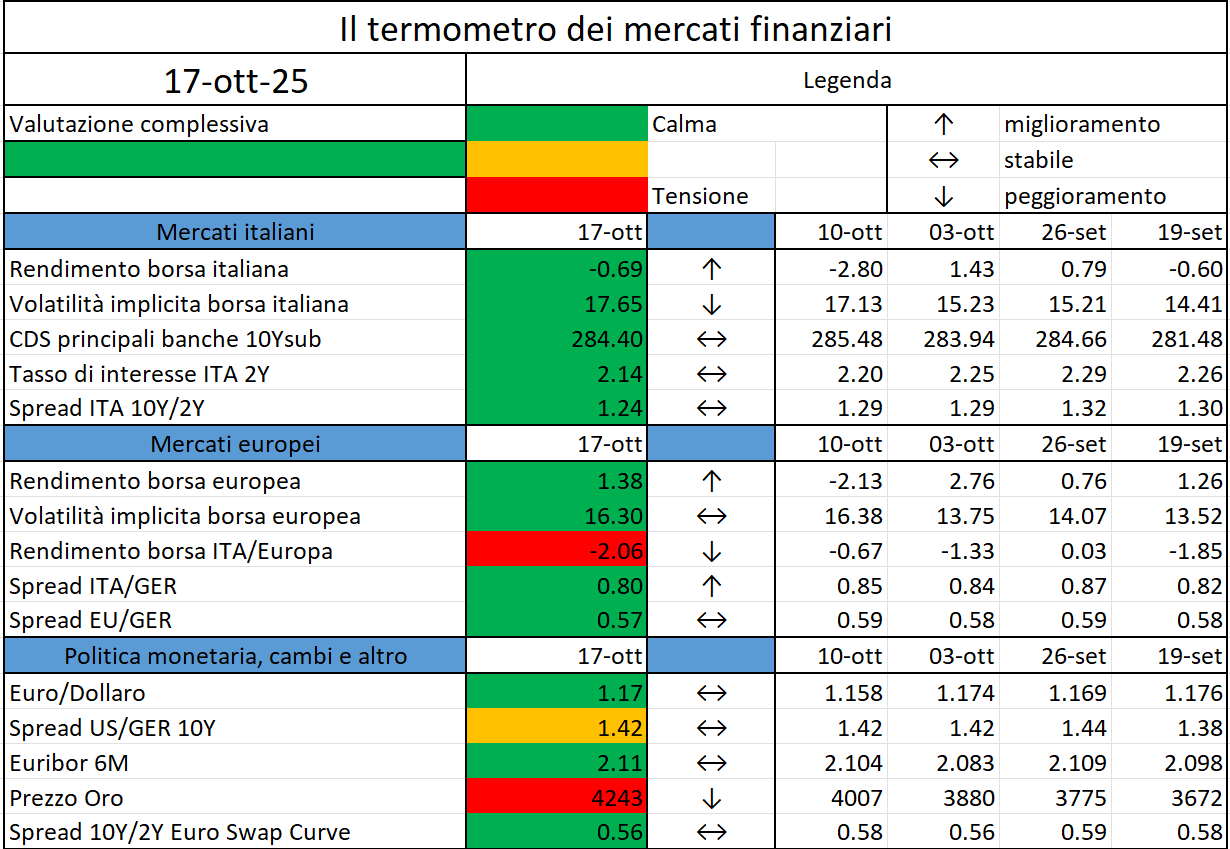
I colori sono assegnati in un’ottica VaR: se il valore riportato è superiore (inferiore) al quantile al 15%, il colore utilizzato è l’arancione. Se il valore riportato è superiore (inferiore) al quantile al 5% il colore utilizzato è il rosso. La banda (verso l’alto o verso il basso) viene selezionata, a seconda dell’indicatore, nella direzione dell’instabilità del mercato. I quantili vengono ricostruiti prendendo la serie storica di un anno di osservazioni: ad esempio, un valore in una casella rossa significa che appartiene al 5% dei valori meno positivi riscontrati nell’ultimo anno. Per le prime tre voci della sezione “Politica Monetaria”, le bande per definire il colore sono simmetriche (valori in positivo e in negativo). I dati riportati provengono dal database Thomson Reuters. Infine, la tendenza mostra la dinamica in atto e viene rappresentata dalle frecce: ↑,↓, ↔ indicano rispettivamente miglioramento, peggioramento, stabilità rispetto alla rilevazione precedente.
The European Securities and Markets Authority (ESMA), the EU’s financial markets regulator and supervisor, has published its Final Reports on the Regulatory Technical Standards (RTS) on central counterparties’ (CCPs) authorisations, extensions of authorisation and model validations, following the review of the European Market Infrastructure Regulation (EMIR 3)…
Il lavoro esamina le valutazioni di borsa delle dieci principali società tecnologiche statunitensi, analizzando in che modo esse siano influenzate dalla redditività attuale e attesa. A tal fine viene applicato un modello basato sui dividendi futuri per stimare i tassi di crescita degli utili impliciti nei prezzi azionari, la cui plausibilità viene poi valutata attraverso un’analisi dei fattori sottostanti…
EBA ha pubblicato due pareri in risposta alle modifiche apportate dalla Commissione UE al progetto di norme tecniche di regolamentazione (RTS) che specificano la composizione e i requisiti di liquidità della riserva di attività ai sensi del Regolamento sui mercati delle criptoattività (MiCAR)…
https://www.dirittobancario.it/art/disaccordo-eba-commissione-ue-sui-requisiti-di-liquidita-micar
