Today, the European Insurance and Occupational Pensions Authority (EIOPA) published technical information on the relevant risk free interest rate term structures (RFR) with reference to the end of January 2022…
Feb
06
2022
Today, the European Insurance and Occupational Pensions Authority (EIOPA) published technical information on the relevant risk free interest rate term structures (RFR) with reference to the end of January 2022…
The European Securities and Markets Authority (ESMA), the EU securities regulator, today publishes its fourth annual statistical report on the Alternative Investment Fund (AIF) sector…
“Reforming the face of finance” is crypto’s primary sales pitch, but the sector needs to offer a few basic components before being welcomed into the arms of the traditional finance sector…
https://cointelegraph.com/news/3-things-the-crypto-sector-must-offer-to-truly-mainstream-with-tradfi

L’indicatore di Mahalanobis permette di evidenziare periodi di stress nei mercati finanziari. Si tratta di un indicatore che dipende dalle volatilità e dalle correlazioni di un particolare universo investimenti preso ad esame. Nello specifico ci siamo occupati dei mercati azionari europei e dei settori azionari globali.
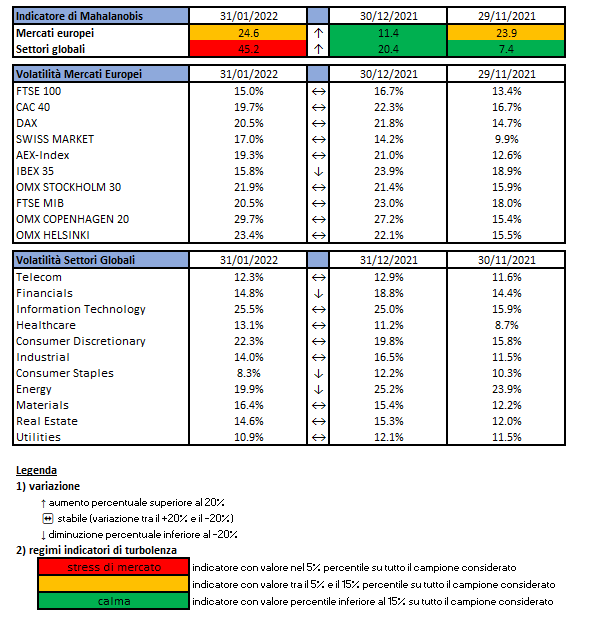
Gli indici utilizzati sono:

Le volatilità riportate sono storiche e calcolate sugli ultimi 30 trading days disponibili. Per ogni asset-class dunque sono prima calcolati i rendimenti logaritmici dei prezzi degli indici di riferimento, successivamente si procede col calcolo della deviazione standard dei rendimenti, ed infine si procede a moltiplicare la deviazione standard per il fattore di annualizzazione.
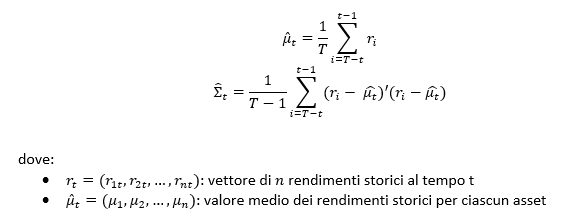
Per il calcolo della distanza di Mahalnobis si procede dapprima con la stima della matrice di covarianza tra le asset-class. Si considera l’approccio delle finestre mobili. Come con la volatilità, si procede prima con il calcolo dei rendimenti logaritmici e poi con la stima storica della matrice di covarianza, come riportato di seguito.
Supponendo una finestra mobile di T periodi, viene calcolato il valore medio e la matrice varianza covarianza al tempo t come segue:
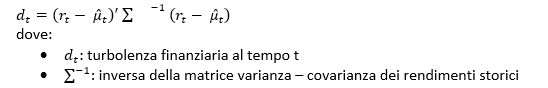
La distanza di Mahalanobis è definita formalmente come:
Le parametrizzazioni che sono state scelte sono:
Le statistiche percentili sono state calcolate a partire dalla distribuzione dell’indicatore di Mahalanobis dal Dicembre 1997 al Dicembre 2019 su rilevazioni mensili.
Ulteriori dettagli sono riportati in questo articolo.
Disclaimer: Le informazioni contenute in questa pagina sono esclusivamente a scopo informativo e per uso personale. Le informazioni possono essere modificate da finriskalert.it in qualsiasi momento e senza preavviso. Finriskalert.it non può fornire alcuna garanzia in merito all’affidabilità, completezza, esattezza ed attualità dei dati riportati e, pertanto, non assume alcuna responsabilità per qualsiasi danno legato all’uso, proprio o improprio delle informazioni contenute in questa pagina. I contenuti presenti in questa pagina non devono in alcun modo essere intesi come consigli finanziari, economici, giuridici, fiscali o di altra natura e nessuna decisione d’investimento o qualsiasi altra decisione deve essere presa unicamente sulla base di questi dati.

L’iniziativa di Finriskalert.it “Il termometro dei mercati finanziari” vuole presentare un indicatore settimanale sul grado di turbolenza/tensione dei mercati finanziari, con particolare attenzione all’Italia.
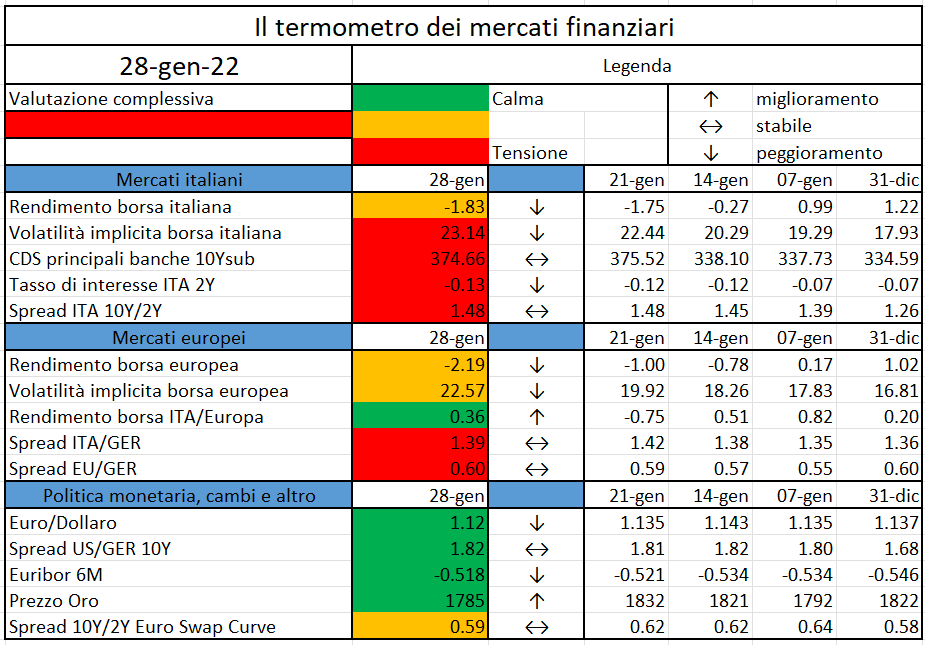
Significato degli indicatori
I colori sono assegnati in un’ottica VaR: se il valore riportato è superiore (inferiore) al quantile al 15%, il colore utilizzato è l’arancione. Se il valore riportato è superiore (inferiore) al quantile al 5% il colore utilizzato è il rosso. La banda (verso l’alto o verso il basso) viene selezionata, a seconda dell’indicatore, nella direzione dell’instabilità del mercato. I quantili vengono ricostruiti prendendo la serie storica di un anno di osservazioni: ad esempio, un valore in una casella rossa significa che appartiene al 5% dei valori meno positivi riscontrati nell’ultimo anno. Per le prime tre voci della sezione “Politica Monetaria”, le bande per definire il colore sono simmetriche (valori in positivo e in negativo). I dati riportati provengono dal database Thomson Reuters. Infine, la tendenza mostra la dinamica in atto e viene rappresentata dalle frecce: ↑,↓, ↔ indicano rispettivamente miglioramento, peggioramento, stabilità rispetto alla rilevazione precedente.
Disclaimer: Le informazioni contenute in questa pagina sono esclusivamente a scopo informativo e per uso personale. Le informazioni possono essere modificate da finriskalert.it in qualsiasi momento e senza preavviso. Finriskalert.it non può fornire alcuna garanzia in merito all’affidabilità, completezza, esattezza ed attualità dei dati riportati e, pertanto, non assume alcuna responsabilità per qualsiasi danno legato all’uso, proprio o improprio delle informazioni contenute in questa pagina. I contenuti presenti in questa pagina non devono in alcun modo essere intesi come consigli finanziari, economici, giuridici, fiscali o di altra natura e nessuna decisione d’investimento o qualsiasi altra decisione deve essere presa unicamente sulla base di questi dati.

In the paper “A Machine Learning Model for Lapse Prediction in Life Insurance Contracts” [1], written together with Giancarlo Giuffra (Politecnico di Milano), we use a random forest to predict early lapse in life insurance contracts. Estimating the probability of lapse is estimating the probability that a policy-holder leaves a contract before expiry. We apply explainability techniques to understand which (economic and non-economic) variables drive the policy-holders’ lapse decision.
We confirm that a random performs better than the classical logistic model to predict the lapse decision, even if the interactions between features are taken into account. The ML methodology allowed us to discern the relevance of a wide set of exogenous variables to explain the lapse decision. The main result of our analysis is that the important drivers of the lapse decision are the time passed from the incipit of the contract and the time to expiry, as well as the insurance company, the contract size, and premium.
The dataset considered in our analysis comes from one of the Italian largest insurance companies: it covers the 2008-2016 time interval with over one million life insurance contracts. The contracts refer to three different companies belonging to the same insurance group. As the companies refer to different distributors, either bank assurance relationships or financial advisors. The lapse phenomenon is company-specific because the lapse decision may be driven by the commercial policies of distributors.
The dataset contains many interesting pieces of information about each policy-holder, such as age, region, or gender, and about the specific contract, such as size or product type (unit-linked or standard). Moreover, we consider macro-economic variables relevant for the lapse decision such as GDP, disposable income, or risk-free interest rate.
We compare the ability of two classification models for the lapse decision: a logistic regression (considering regularization and interaction among features) and a RF model (see e.g., [3]). The empirical literature on lapses of insurance contracts exploiting classical techniques (in general regressive models) is quite large but often inconclusive. It is difficult to find a unified framework for the non-stationary lapse phenomenon in different markets and times.
In this perspective, ML tools (such as the Random Forest methodology employed in the paper) provide an interesting approach. The appealing feature is that they are model-free, they allow to consider a large set of variables (and their non-linear interactions) and therefore let the data speak for themselves.
To understand whether this guess is correct we compare the ability of two classification models for the lapse decision: a logistic regression (considering regularization and interaction among features) and a random forest model (RF) model. We use a classical RF classifier based on a combination of simple classification trees.
The random forest significantly outperforms the logistic regression. We compare the two models in terms of the area under the precision-recall curve (AUPR). This curve is obtained by plotting the Precision (the percentage of observations classified as positive that are indeed positive) against the Recall (the percentage of positive observations classified as positive).
The AUPR of the random classifier is equal to the percentage of positive observations, i.e., observations belonging to class 1 in the dataset (in our case 17%) while for the perfect classifier the AUPR yields 1.
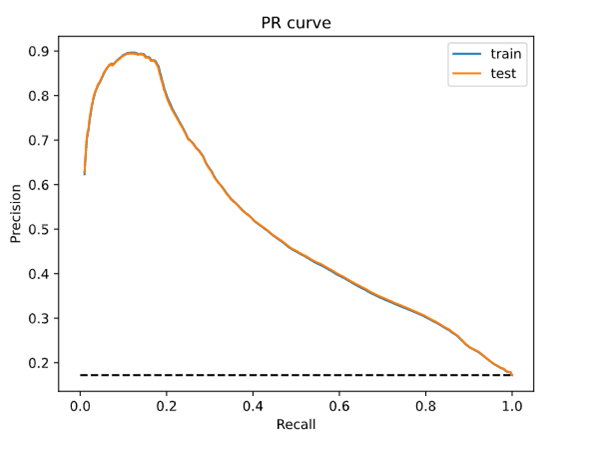
In figure 1, we plot the AUPR for the logistic regression on the train and test sets. Notice that the two curves overlap showing again that there is no evidence of overfitting: the performance of the model on the training set is similar to that obtained on the test set. For recall levels greater than 50% (the percentage of positive observations classified as positive), we observe that the precision of the logistic classifier (the percentage of observations classified as positive that are indeed positive) is always lower than 45%. These results are quite unsatisfactory.
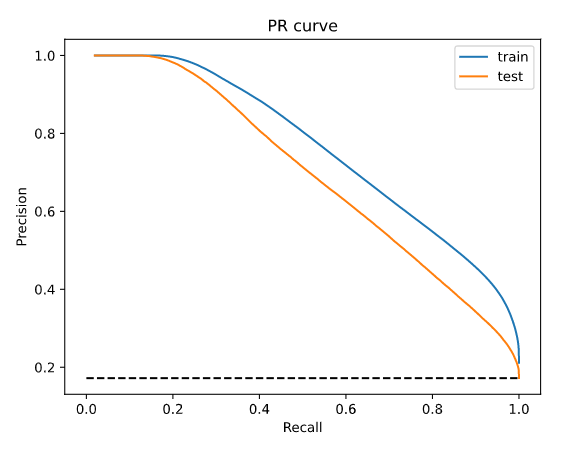
In figure 2, we plot the AUPR of the random forest on train and test sets. Notice that the performances on the two datasets are similar but, as expected, the performance on the training set is slightly better than the performance on the test set. In both cases, the model outperforms considerably the random classifier (that has a precision of 17%) and the logistic regression, see Figure 1. Considering the test set, for recall values equal to 50%, precision is nearly 75%, i.e., to correctly classify 50% of the observed lapses, nearly 75% of the observations classified as lapse are true positive (for logistic regression it was nearly 45%).
The random forest performance significantly beat the linear model. However, the main limit of ML tools is that they appear as black boxes” that are difficult to be interpreted in terms of causal relationships between input and output variables. Several methodologies have been proposed in the literature to cope with the explainability/interpretability of the ML. In the paper, we have used a simple “global” approach.
We build the regression tree that better fits the random forest, i.e., standard features as input and the random forest predictions as output in the training set. We would like to stress that we are approximating a RF made up of fifty trees, each one with (maximum) depth 50, with a single regression tree with a much smaller depth.
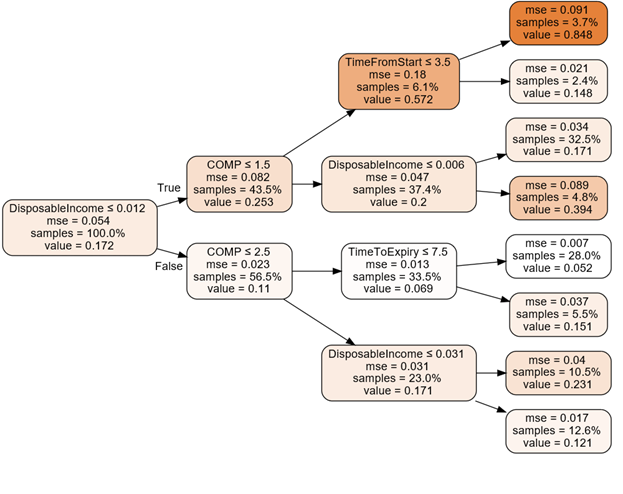
In figure 3, we plot the regression tree fitted on the random forest output.
Each node of the tree contains the following pieces of information:
The variables that appear in this reduced tree are the insurance company of the group (COMP) the Italian disposable income (DisposableIncome) the time from the beginning of the contract (TimeFromStart) and the time left before the expiry of the contract (TimeToExpiry).
We observe that this regression tree only uses four of the variables of the RF model. We notice that observations with disposable income growth rate smaller than 0.012 are more likely to lapse.
We also notice the relevance of the Company (COMP) which acts at the second level of the tree. For example, if the disposable income growth rate is low and the policy is stipulated with Company A (COMP=1), then the probability to lapse increases considerably, reaching a 57% probability. We can conclude that, according to the selected RF model, these are the main drivers of the lapse decision.
According to our analysis, the leaf with the highest lapse probability (84.8%) is obtained with a disposable income growth rate lower (or equal) than 0.012, a policy stipulated with Company A and with time from start smaller (or equal) than 3.5 years. On the other hand, the leaf with the smallest lapse probability (5.2%) is obtained with a disposable income growth rate higher than 0.012, a policy stipulated with Company A or B, and with time to expiry smaller (or equal) than 7.5 years.
These results are interesting because all the above variables turned out to be statistically significant [2], where the same dataset is analyzed considering classical linear models, with the purpose to analyze the lapse rates with respect to major factors of lapses.
[1] Azzone, M., Barucci, E., Moncayo, G. G., & Marazzina, D. (2022). A machine learning model for lapse prediction in life insurance contracts. Expert Systems with Applications, 191, 116261. https://doi.org/10.1016/j.eswa.2021.116261
[2] Barucci, E., Colozza, T., Marazzina, D., & Rroji, E. (2020). The determinants of lapse rates in the Italian life insurance market. European Actuarial Journal, 10(1), 149-178. https://doi.org/10.1007/s13385-020-00227-0
[3] Liaw, A., & Wiener, M. (2002). Classification and regression by random Forest. R news, 2(3), 18-22. https://cogns.northwestern.edu/cbmg/LiawAndWiener2002.pdf
La prova di stress è un esercizio conoscitivo inteso a valutare il grado di preparazione delle
banche nella gestione del rischio climatico…
https://www.bancaditalia.it/media/bce-comunicati/documenti/2022/ssm_pr220127_it.pdf
The European Insurance and Occupational Pensions Authority (EIOPA) published today its third paper in a series of papers on the methodological principles of insurance stress testing…
The hash rate surpassed 1.11 PH/s for the first time ever, breaking the previous high of 1.08 PH/s set on Jan. 13…
https://cointelegraph.com/news/ethereum-hash-rate-scores-new-ath-as-pos-migration-underway
Dfinity Foundation’s Internet Computer blockchain has welcomed its first decentralized exchange named Sonic…
https://cointelegraph.com/news/first-dex-on-internet-computer-launches-others-coming-soon
