The European Securities and Markets Authority (ESMA), the EU’s securities markets regulator, is issuing an Opinion containing proposed reforms to the regulatory framework for EU Money Market Funds (MMFs) …
Feb
18
2022
The European Securities and Markets Authority (ESMA), the EU’s securities markets regulator, is issuing an Opinion containing proposed reforms to the regulatory framework for EU Money Market Funds (MMFs) …
Crypto-asset markets are fast evolving and could reach a point where they represent a threat to global financial stability due to their scale…
https://www.fsb.org/2022/02/assessment-of-risks-to-financial-stability-from-crypto-assets/

L’iniziativa di Finriskalert.it “Il termometro dei mercati finanziari” vuole presentare un indicatore settimanale sul grado di turbolenza/tensione dei mercati finanziari, con particolare attenzione all’Italia.
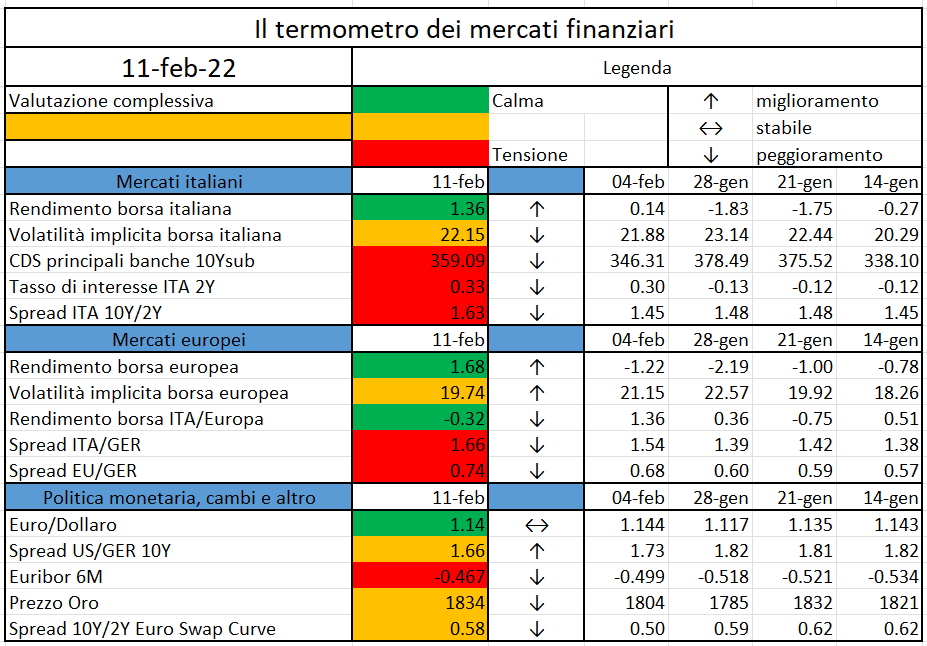
Significato degli indicatori
I colori sono assegnati in un’ottica VaR: se il valore riportato è superiore (inferiore) al quantile al 15%, il colore utilizzato è l’arancione. Se il valore riportato è superiore (inferiore) al quantile al 5% il colore utilizzato è il rosso. La banda (verso l’alto o verso il basso) viene selezionata, a seconda dell’indicatore, nella direzione dell’instabilità del mercato. I quantili vengono ricostruiti prendendo la serie storica di un anno di osservazioni: ad esempio, un valore in una casella rossa significa che appartiene al 5% dei valori meno positivi riscontrati nell’ultimo anno. Per le prime tre voci della sezione “Politica Monetaria”, le bande per definire il colore sono simmetriche (valori in positivo e in negativo). I dati riportati provengono dal database Thomson Reuters. Infine, la tendenza mostra la dinamica in atto e viene rappresentata dalle frecce: ↑,↓, ↔ indicano rispettivamente miglioramento, peggioramento, stabilità rispetto alla rilevazione precedente.
Disclaimer: Le informazioni contenute in questa pagina sono esclusivamente a scopo informativo e per uso personale. Le informazioni possono essere modificate da finriskalert.it in qualsiasi momento e senza preavviso. Finriskalert.it non può fornire alcuna garanzia in merito all’affidabilità, completezza, esattezza ed attualità dei dati riportati e, pertanto, non assume alcuna responsabilità per qualsiasi danno legato all’uso, proprio o improprio delle informazioni contenute in questa pagina. I contenuti presenti in questa pagina non devono in alcun modo essere intesi come consigli finanziari, economici, giuridici, fiscali o di altra natura e nessuna decisione d’investimento o qualsiasi altra decisione deve essere presa unicamente sulla base di questi dati.
Total assets of EU-headquartered credit institutions increased by 4.15%, from €29.74 trillion in September 2020 to €30.98 trillion in September 2021…
https://www.ecb.europa.eu//press/pr/date/2022/html/ecb.pr220210~a997470516.en.html
The European Insurance and Occupational Pensions Authority (EIOPA) published today its Supervisory Convergence Plan for 2022…
https://www.eiopa.europa.eu/media/news/eiopa-publishes-its-supervisory-convergence-plan-2022_en
The European Securities and Markets Authority (ESMA), the EU’s securities markets regulator, has today published its Sustainable Finance Roadmap 2022-2024 (Roadmap)…
Smart contract-capable platform called Avalanche (AVAX) aims to improve blockchain technology particularly in terms of interoperability, scalability and usability…
https://cointelegraph.com/news/what-is-avalanche-network-avax-and-how-does-it-work
Sì al nucleare e sì al gas: così la Commissione Europea si ritrova a doversi difendere da sé stessa e da alcuni Stati Membri. La pubblicazione del secondo atto delegato della Tassonomia verde introdotta nel 2020 ha creato forti dissapori sia all’interno che all’esterno dell’istituzione. Ma prima di addentrarci negli ultimi sviluppi della “questione verde”, capiamo meglio di cosa si tratta la Tassonomia Ue.
Cos’è la Tassonomia verde Ue
Nel dicembre 2019, la Commissione Europea presenta il “Green Deal” europeo, una ambiziosa strategia per combattere il cambiamento climatico e rendere l’economia europea efficiente e competitiva. Il perimetro d’azione è delimitato da tre pilastri: il raggiungimento della neutralità carbonica entro il 2050, la formulazione di una crescita economica dissociata dall’uso delle risorse e l’inclusione di tutti i cittadini europei. Tutto ciò verrà sostenuto finanziariamente da un terzo dei 1800 miliardi di euro di investimento del piano “NextGenerationEU” e dal bilancio settennale dell’UE, ma non basta.
Per centrare questi obiettivi, servono investimenti pubblici e, soprattutto, privati in tutta l’UE che si traduce in una forte necessità di regole il più possibile precise e condivise. In questo contesto Bruxelles redige la cosiddetta Tassonomia, entrata in vigore ufficialmente nel luglio 2020. Si tratta di un “sistema di classificazione che stabilisce una lista delle attività economiche sostenibili per l’ambiente”, fornendo agli investitori un vademecum per riconoscere quali attività siano sostenibili.
Il Regolamento della tassonomia definisce 6 obiettivi ambientali da perseguire: mitigazione del cambiamento climatico, adattamento al cambiamento climatico, uso sostenibile e protezione delle risorse idriche e marine, transizione verso l’economia circolare, prevenzione e controllo dell’inquinamento e protezione e restauro della biodiversità e degli ecosistemi. Una attività economica viene quindi riconosciuta come sostenibile se contribuisce al raggiungimento di almeno uno di questi obiettivi, non ledendo eccessivamente gli altri e rispettando alcune garanzie sociali.
Qui il seme della discordia. Definire i dettagli tecnici di questa “antologia della sostenibilità” non è solo un lavoro titanico ma risulta anche essere una dura battaglia politica. Essere annoverati tra le attività “green” non è una mera questione di classificazione, ma, soprattutto, un punto cruciale per poter attrarre investimenti. Secondo un report di Morningstar[1], durante il 2020 è quasi raddoppiato il flusso di investimenti sostenibili raggiungendo i 223 miliardi di euro. Non proprio briciole.
Nucleare e Gas: in o out?
Data l’eterogeneità e numerosità delle attività economiche, il Regolamento del luglio 2020 non copre tutte le attività economiche, ma lascia spazio a successivi atti delegati per renderlo sempre più completo ed esaustivo. Questi servono per definire meglio cosa può essere finanziato con soldi pubblici destinati agli investimenti verdi, ma anche quali attività si possono inserire nei portafogli di investimento definiti sostenibili per non evitare il “greenwashing”.
Il primo atto delegato entra in atto il 1 gennaio 2022 e già un mese dopo viene pubblicata la bozza del successivo, intitolato “EU Taxonomy Complementary Climate Delegated Act covering certain nuclear and gas activities”. Già prima della pubblicazione, il secondo atto delegato genera forti discussioni, anche all’interno della Commissione stessa. Le nuove regole concedono che, ad alcune condizioni, il gas e il nucleare possano essere considerate energie di transizione sostenibile.
Per quanto riguarda il nucleare, il rapporto pubblicato afferma che le analisi non hanno rivelato alcuna prova scientifica che l’energia nucleare arrechi più danni alla salute umana o all’ambiente rispetto ad altre tecnologie di produzione di elettricità. Inoltre, lo stoccaggio dei rifiuti nucleari in formazioni geologiche profonde – problema principale per l’utilizzo di questa energia – è ritenuto appropriato e sicuro. Queste affermazioni interpretano i risultati del Joint Research Centre (ossia che attualmente non vi sia “alcuna esperienza operativa a lungo termine poiché le tecnologie e le soluzioni sono ancora in fase di dimostrazione e sperimentazione”) guardando al bicchiere mezzo pieno.
Per quanto riguarda le centrali elettriche alimentate a gas naturale, possono essere considerate sostenibili secondo la Tassonomia a patto di tre condizioni: se producono emissioni inferiori a 270 g di CO2 equivalente per ogni kilowattora prodotto, se sostituiscono un impianto a combustibili fossili più inquinante, e se ricevono un permesso di costruzione entro il 31 dicembre 2030. L’utilizzo di gas ed energia nucleare verrebbe quindi etichettato come sostenibile in quanto attività di transizione, cioè di supporto per il raggiungimento di un più alto obiettivo.
I “puristi” della sostenibilità considerano queste decisioni risultano fortemente inaccettabili. Anche la stessa “Platform on Sustainable Finance”, un gruppo di esperti nato all’interno della Commissione stessa con l’obiettivo di assisterla nello sviluppo delle proprie policy di finanza sostenibile, mostra dissenso[2]. Ancora più forte è però il rischio che corre Bruxelles di un’azione legale separata da parte dei Paesi dell’Ue contrari alle nuove proposte sulla Tassonomia, come Austria e Spagna.
Nei prossimi mesi il Parlamento europeo e il Consiglio (con un veto di almeno 20 Paesi che rappresentino almeno il 65% della popolazione dell’Ue) dovranno confermare o meno l’inserimento del nucleare e del gas nella Tassonomia. L’Ue dovrà giocare una partita in equilibrio tra due fuochi: da un lato la necessità di decarbonizzare la propria economia, dall’altro di ridurre la propria dipendenza energetica, in particolare dal gas proveniente dall’est Europa e dalla Russia.
[1] https://www.morningstar.it/it/news/209409/i-record-dei-fondi-sostenibili-europei-nel-2020.aspx
[2] https://ec.europa.eu/info/sites/default/files/business_economy_euro/banking_and_finance/documents/220121-sustainable-finance-platform-response-taxonomy-complementary-delegated-act_en.pdf
L’iniziativa di Finriskalert.it “Il termometro dei mercati finanziari” vuole presentare un indicatore settimanale sul grado di turbolenza/tensione dei mercati finanziari, con particolare attenzione all’Italia.
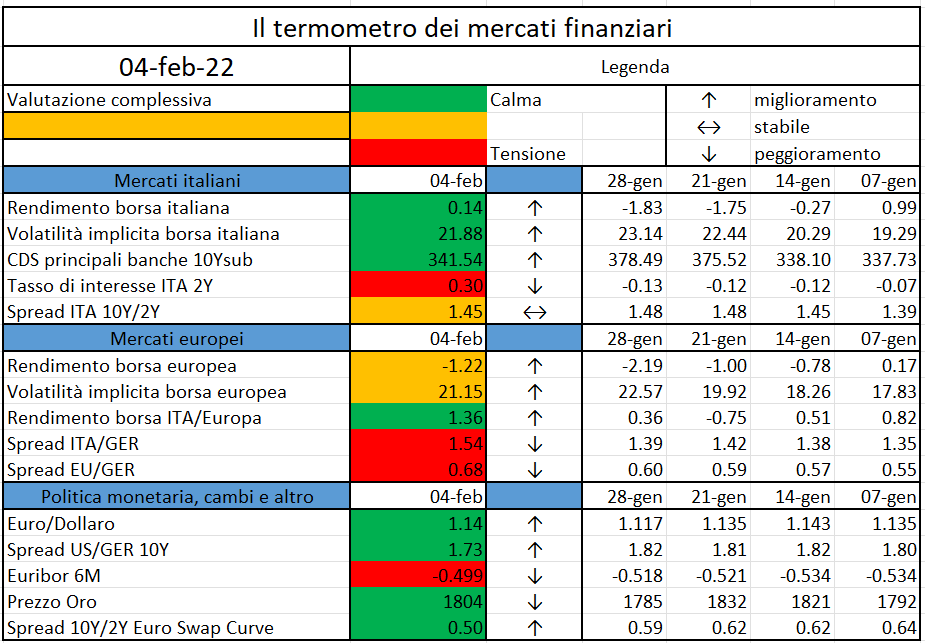
Significato degli indicatori
I colori sono assegnati in un’ottica VaR: se il valore riportato è superiore (inferiore) al quantile al 15%, il colore utilizzato è l’arancione. Se il valore riportato è superiore (inferiore) al quantile al 5% il colore utilizzato è il rosso. La banda (verso l’alto o verso il basso) viene selezionata, a seconda dell’indicatore, nella direzione dell’instabilità del mercato. I quantili vengono ricostruiti prendendo la serie storica di un anno di osservazioni: ad esempio, un valore in una casella rossa significa che appartiene al 5% dei valori meno positivi riscontrati nell’ultimo anno. Per le prime tre voci della sezione “Politica Monetaria”, le bande per definire il colore sono simmetriche (valori in positivo e in negativo). I dati riportati provengono dal database Thomson Reuters. Infine, la tendenza mostra la dinamica in atto e viene rappresentata dalle frecce: ↑,↓, ↔ indicano rispettivamente miglioramento, peggioramento, stabilità rispetto alla rilevazione precedente.
Disclaimer: Le informazioni contenute in questa pagina sono esclusivamente a scopo informativo e per uso personale. Le informazioni possono essere modificate da finriskalert.it in qualsiasi momento e senza preavviso. Finriskalert.it non può fornire alcuna garanzia in merito all’affidabilità, completezza, esattezza ed attualità dei dati riportati e, pertanto, non assume alcuna responsabilità per qualsiasi danno legato all’uso, proprio o improprio delle informazioni contenute in questa pagina. I contenuti presenti in questa pagina non devono in alcun modo essere intesi come consigli finanziari, economici, giuridici, fiscali o di altra natura e nessuna decisione d’investimento o qualsiasi altra decisione deve essere presa unicamente sulla base di questi dati.
The Governing Council confirmed the decisions taken at its monetary policy meeting last December…
https://www.ecb.europa.eu//press/pr/date/2022/html/ecb.mp220203~90fbe94662.en.html
