Today, the European Insurance and Occupational Pensions Authority (EIOPA) published technical information on the relevant risk free interest rate term structures (RFR) with reference to the end of November 2021…
Dic
03
2021
Today, the European Insurance and Occupational Pensions Authority (EIOPA) published technical information on the relevant risk free interest rate term structures (RFR) with reference to the end of November 2021…
The European Securities and Markets Authority (ESMA), the EU’s securities markets regulator, has today published its Final Report on draft Regulatory Technical Standards (RTS) for commodity derivatives under the MiFID II Recovery Package…
The report highlights the merits of EIP-1559 as a tool for making ETH a deflationary cryptocurrency and potentially a better store of value than Bitcoin…
https://cointelegraph.com/news/academic-research-claims-eth-is-a-superior-store-of-value-to-bitcoin
Bitcoin is struggling to surpass the $57,200 resistance against the US Dollar. BTC is declining and it might accelerate lower if there is a close below the $56,000 support...
https://www.newsbtc.com/analysis/btc/bitcoin-below-56k-larger-decline/

L’urgenza di contenere il cambiamento climatico ha obbligato gli Stati, e in particolare l’Unione europea, a spingere sull’acceleratore per coinvolgere i capitali privati nella lotta al riscaldamento del pianeta.
Il Trattato di Parigi del 2015 è stato il vero snodo per tutte le attività di lotta al cambiamento climatico. L’Unione europea ha realizzato un set di regole sul versante della classificazione delle attività economiche per aver una politica di tassonomia che consideri l’impegno delle società nelle tematiche ESG, stabilendo quali attività sono ambientalmente sostenibili e quali no. L’impegno europeo verso la sostenibilità ha acquisito ulteriore slancio nel 2019, con l’insediamento della nuova Commissione Europea e il lancio della agenda 2019-2024, che ha al primo punto il “Green Deal europeo”. Obiettivo della nuova Commissione è rimuovere una serie di misure per rendere più sostenibili e meno dannosi per l’ambiente la produzione di energia e lo stile di vita dei cittadini europei entro il 2050. Il Green Deal sarà finanziato con una ingente quantità di denaro, pubblico e privato. Per il 2030 l’obiettivo sarà quello di mobilitare circa 1.000 miliardi di euro per finanziarlo, più o meno 100 miliardi all’anno con l’obiettivo principale di limitare l’aumento del riscaldamento globale, che secondo le stime del Gruppo intergovernativo sul cambiamento climatico (IPCC) dell’ONU deve rimanere entro gli 1,5 °C.
Questo contesto ha creato la necessità di classificare e valutare le diverse imprese in termini ESG. Il Rating ESG (o Rating di sostenibilità) infatti è un giudizio sintetico che certifica la solidità di un emittente, di un titolo o di un fondo dal punto di vista degli aspetti ambientali, sociali e di governance. Non sostituisce il Rating tradizionale ma è complementare e il suo scopo è quello di aumentare le informazioni disponibili e quindi migliorare le valutazioni e le scelte. Questa misura di ESG Rating potrebbe essere accostata ai rating creditizi, valutazioni da parte di un analista o di un team di analisti dove viene misurata l’affidabilità di un’impresa o di uno strumento finanziario, i Rating ESG nascono per sintetizzare il grado di sostenibilità dell’impresa, nelle tre dimensioni ambientali, sociali e di governance. Nonostante questa apparente analogia, i Rating ESG si differenziano da quelli creditizi per due ragioni, in primis, nel caso dei rating creditizi, esiste una misura osservabile che deve essere stimata, il default dell’impresa o dello strumento finanziario entro un orizzonte temporale definito. Viceversa, per i Rating e gli Score ESG le grandezze osservabili sono molteplici sia di natura quantitativa che qualitativa. In secondo luogo, per i Rating creditizi esiste una regolamentazione specifica e un’autorità che autorizza le agenzie di Rating a poter emettere valutazioni.
Gli indici che attualmente nel 2021 hanno la maggiore reputazione sulle tematiche ESG sono: S&P Dow Jones ESG Indices, MSCI ESG Indices, Thomson Reuters ESG. Questi indici sono gestiti da provider che raccolgono le informazioni dalle imprese e le suddividono nelle diverse voci che compongono una valutazione ESG. La creazione di un indice affidabile richiedere di aver a disposizione diversi dati qualitativi dell’impresa. Qui possiamo già osservare un passaggio delicato, in quanto in assenza di un ente che certifica la trasparenza del dato fornito, le valutazioni ottenute non possono essere garantite. Questo è proprio il punto focale: le valutazioni ESG non sono sempre trasparenti e talvolta è difficile verificarle.
Detto ciò, il dato qualitativo viene trasformato in quantitativo. Nella maggior parte dei quesiti raccolti, viene formulata una domanda dicotomica come ad esempio “L’impresa fa report sugli investimenti per l’ambiente o L’impresa investe in armi?”, questa informazione viene trasformata in una dummy, che assume valore 0 in caso la risposta sia falso, 1 altrimenti. Ci sono alcuni quesiti che non possono essere riassunti semplicemente con un quesito dicotomico, come per le “Emissioni Totali di CO2 stimate annuali”, dove viene riportato il valore totale delle emissioni in tonnellate. Per esempio Coca-Cola, secondo il Thomson Reuter Index, ha un’emissione totale sul 2020 di 5.240.000 tonnellate di CO2. Per utilizzare questo dato per la costruzione dell’indice, viene calcolata la mediana per tutto il cluster di società a disposizione, e se il dato si trova sopra la mediana, viene attribuito il valore 1, altrimenti 0.
In questo lavoro è stato utilizzato il Thomson Reuter ESG Score, composto da 420 valutazioni differenti sul tema ESG:
Il pilastro ambientale misura l’impatto di un’azienda sui sistemi naturali viventi e non viventi, inclusi aria, terra e acqua, nonché su interi ecosistemi. Il pilastro sociale misura la capacità di un’azienda di generare fiducia e lealtà nei confronti dei propri dipendenti, clienti e società, attraverso l’utilizzo delle migliori pratiche di gestione. Infine, il pilastro della corporate governance misura i sistemi e i processi di un’azienda, che assicurano che i membri del consiglio di amministrazione e i dirigenti agiscano nel migliore interesse dei suoi azionisti a lungo termine.
L’obiettivo della valutazione ESG è quello di sviluppare uno strumento quantitativo al fine di valutare le opportunità di profitto e i rischi di perdite che si verificano a causa del processo di transizione energetica. Lo sviluppo di un fattore comune per le imprese si basa sulla raccolta di una grande quantità di informazioni rilevanti per il clima e la governance fornite dalle diverse banche dati, così da poter comporre un indice sintetico. Roncalli[1] propone un indice Brown minus Green Score (BGS), con un valore che oscilla tra 0 e 1, dove 1 rappresenta un’azienda “Brown” mentre 0 un’azienda “Green” e quindi tanto più vicino si avvicina allo 0 tanto migliore è la società analizzata in termini ESG.
Per sviluppare questo fattore di rischio comune è necessario lo sviluppo di un sistema di punteggio per determinare se un’impresa è green, neutral o brown con un approccio fondamentale per valutare il carbon risk delle diverse aziende. L’algoritmo ideato da Roncalli prevede di utilizzare 4 distinti database ESG: Thomson Reuters ESG, MSCI ESG Ratings, Sustainalytics ESG ratings e il questionario sul cambiamento climatico Carbon Disclosure Project (CDP). Ogni valore raccolto dalle seguenti banche dati viene classificato in tre diverse dimensioni che potranno influire sul valore in borsa di un’impresa in caso di cambiamenti imprevisti verso un’economia a basse emissioni di carbonio, il presente lavoro permette di trarre qualche evidenza preliminare sulla relazione tra criteri ESG e performance (futura) dei titoli azionari. Le 3 classi sono le seguenti:
1. Value Chain che misura l’impatto di una politica climatica o di un sistema commerciale sulle diverse attività di un’azienda: logistica in entrata e catena di fornitori, produzione manifatturiera, vendite, ecc.;
2. Public Perception, l’immagine ambientale esterna di un’impresa: valutazioni, controversie, divulgazione di informazioni ambientali, ecc.;
3. Non Adaptability, la capacità dell’impresa di passare a una strategia a basse emissioni di carbonio senza sforzi e perdite sostanziali.
Come detto prima, più si avvicina a 1 la variabile, più “marrone” è l’azienda. Ogni variabile viene trasformata in una dummy [0-1], dove 1 corrisponde ad un valore brown e 0 corrisponde a un valore green. Quindi, vengono creati tre punteggi che corrispondono alla media aritmetica delle osservazioni contenute in ogni dimensione: la value chain VC, la public perception (PP) e la non adaptability (NA). Ne consegue che ogni punteggio ha un intervallo compreso tra 0 e 1.
Una volta inferite le 3 classi ed i relativi punteggi medi viene calcolato il Brown minus Green score, realizzato come una media pesata dei 3 valori, dove viene attribuito un peso maggiore alla variabile Value Chain ritenuta quella a maggior contenuto informativo. Il BGS score è così ottenuto:

Come possiamo osservare i valori di interesse sono dipendenti dal tempo, infatti ogni anno vengono riformulati i diversi quesiti e quindi si ottengono valutazioni su base annuale. Per costruzione dell’indicatore, possiamo affermare che maggiore è il valore BGS, più marrone è l’azienda.
Molti vantaggi possono essere attribuiti al fattore BGS ma rimangono dubbi invece nella costruzione del database ESG, poiché i punteggi BGS sono derivati da diversi database. Un ulteriore dubbio nella costruzione del database riguarda la trasformazione di variabili continue e discrete in dummy. Inoltre, il problema più importante è che nel tempo i punteggi tendono a rimanere allo stesso livello. Alcuni test eseguiti da Gorgen et al. (2019) hanno mostrato che meno del 5% delle imprese si è spostato tra i portafogli verde, neutro e marrone durante il periodo di studio. Questo fenomeno lo si osserva anche nell’esperimento proposto in seguito, infatti le società tendono a non mostrare grossi cambiamenti tra gli anni.
È stata realizzata l’analisi di un database ESG costruito ex novo. Sono state selezionate, 100 società diverse, scelte in base alla capitalizzazione di mercato e alla presenza di un rating ESG. Purtroppo essendo tematiche nuove, non tutte le società forniscono tali informazioni, ed ad oggi rimane impossibile tracciare tutto l’universo investibile in termini ESG, solo le società con una determinata struttura possono permettersi un monitoraggio ESG. Le valutazioni ESG sono state estrapolate da Eikon Reuters, è stato utilizzato il Thomson Reuters ESG, che è un format suddiviso in 4 sezioni [Envirorment, Social, Governance, Controversy]. Ognuno di questi gruppi è composto da un gran numero di quesiti ESG, circa 400 totali. Come discusso in precedenza le risposte sono poi trasformate in variabili binarie. Una volta trasformate le risposte, si è proceduto alla riclassificazione delle domande nelle 3 classi: Value Chain, Public Percepition e Non Adaptability.
Una volta attribuita la classificazione, si è calcolata la media semplice per ognuno dei 3 gruppi. Successivamente si procede con il calcolo del BGS score:
Si osserva come la Value Chain abbia un peso maggiore in quanto è la variabile più importante nel processo di transazione ecologica. Si è calcolato il BGS per tutte le società del paniere, così facendo abbiamo una valutazione quantitativa dei valori ESG per ogni impresa e questi parametri sono confrontabili tra loro. In tale modo si è costruita una misura adimensionale che ci consente uno stock picking in base ai parametri che riguardano la transizione ecologica e sociale. Riportiamo nella tabella i punteggi BGS delle prime 5 del database in ordine alfabetico:
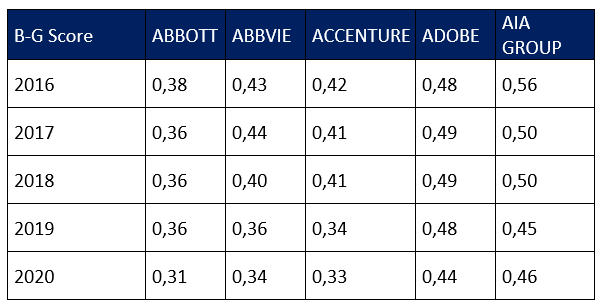
Tabella 1 – Recap BGS prime 5 società ordine alfabetico
Nella tabella sono rappresentati i valori del parametro BGS nel periodo 2016-2020. Si osserva già a prima vista di come l’evoluzione del parametro sia contenuta nel tempo. Questo è un effetto che si osserva nella maggior parte delle società e può essere esplicato analizzando la struttura delle imprese, infatti la transazione verde richiede investimenti fissi, che producono i loro effetti non sul breve periodo ma sul medio-lungo periodo. Se prendiamo per esempio una società energetica, e consideriamo le emissioni di CO2, la diminuzione del totale delle emmissioni è un processo che richiede molto tempo. Questo vale per molti dei parametri che rientrano nella classificazione Value Chain. La bassa variazione del parametro purtroppo ci fornisce un basso contenuto informativo.
Si può osservare nel grafico in basso la suddivisione per quartili di tutto il paniere preso in considerazione.
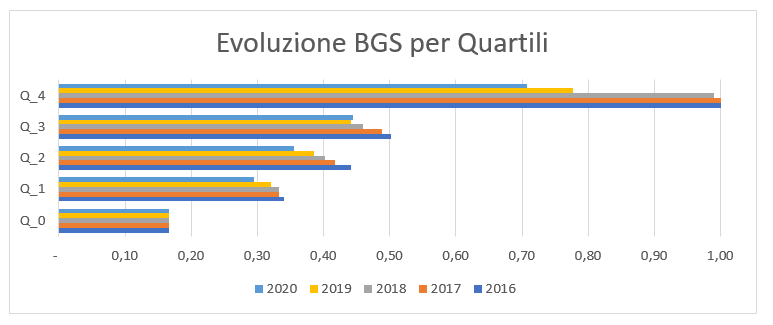
Figura 1 – Evoluzione BGS per quarter dal 2016 al 2020
Dall’istogramma appena mostrato si osserva che, prese le 100 società, e suddivise per quartili in base al loro parametro BGS, si può osservare come la tendenza è quella di diminuzione del parametro. Ciò dimostra come il paniere utilizzato, composto dalle società con la maggior capitalizzazione di mercato, stia migliorando la propria posizione in termini ESG.
A rinforzare questa tesi possiamo osservare la correlazione cross-sectional tra il parametro BGS e il rendimento azionario year-over-year dei titoli.
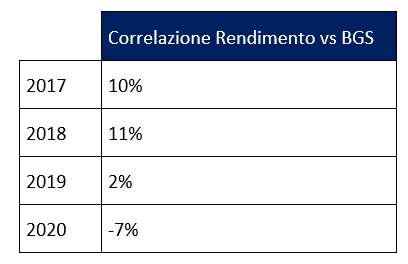
Tabella 2 – Correlazione BGS e rendimento azionari titoli dal 2016 al 2020
La correlazione non assume valori significativi. Tuttavia è evidente come la correlazione scenda in modo monotono, dunque nel corso degli anni la relazione tra criteri ESG e performance muove nella direzione corretta: titoli a più alto parametro BGS riportano mediamente rendimenti più alti. Infatti oggi per una società creare esternalità negative in termini ambientali, espone la stessa a rischi sul rendimento del titolo. Per questo motivo osserviamo come la correlazione nel tempo sia diventata negativa, ad un incremento del valore azionario dell’impresa, possiamo affermare corrisponde ad un miglioramento in termini ESG.
La bassa intensità della correlazione può essere spegata dal fatto che in primis si è utilizzato un unico provider ESG, nel lavoro di Roncalli a cui ci siamo ispirati l’autore del modello ipotizzava di utilizzare 4 diversi data provider, al fine di limare i bias informativi di un singolo emittente e diversificare le fonti di informazioni. Un altro motivo può essere ricercato nella composizione del database, infatti è stata utilizzata la logica di selezionare le società a maggior capitalizzazione sul mercato equity, questa scelta è stata assunta in quanto poche società hanno un’informativa completa in termini ESG. In questo modo il settore maggiormente coperto è quello delle tecnologie.
In conclusione si può affermare come questa metodologia di scoring e riclassificazione delle società abbia un grande potenziale di applicazione, infatti con i giusti strumenti, creare e monitorare questo tipo di database è relativamnete semplice da un punto di vista computazionale, ma qui nasce il vero problema del modello. L’aggiornamento annuale delle valutazioni ESG non permette di aver abbastanza informativa per monitorare in tempo reale il posizionamento della singola impresa in termini ESG. Quindi un’impresa con un buon punteggio ESG nell’anno precendente viene acquistata in logica di comporre un portafoglio “green”, ma se nel corso dell’anno avvengono significativi cambi, questi non sono rappresentati in nessun modo nei vari parametri ESG, e saranno solo osservabili all’aggiornamento dei dati l’anno successivo. Al contrario il prezzo azionario sarà subito influenzato da queste variazioni, e quindi viene a crearsi un lag temporale tra la variazione di prezzo e la modifica del parametro ESG. Per far in modo che tale metodologia possa essere applicata, dovrebbe essere introdotto un parametro ESG più reattivo ed elastico rispetto a quello che ora abbiamo sul mercato. Infatti, nell’ipotesi di avere un parametro ESG aggiornato mensilmente o addirittura settimanalmente si avrebbe a disposizione un dato più completo.
La metodologia qui proposta per la valutazione delle imprese in termini ESG, essa ha buoni vantaggi e grande futuribilità, infatti questo consentirebbe ai vari operatori sul mercato di quantificare quanto il loro portafoglio sia esposto in termini ESG. Oltre a ciò, avendo un parametro solido e flessibile si potrebbe anche utilizzarlo in fase di ottimizzazione di portafoglio.
[1] “Measuring and Managing Carbon Risk in Investment Portfolios”, Thierry Roncalli, August 2020.

L’iniziativa di Finriskalert.it “Il termometro dei mercati finanziari” vuole presentare un indicatore settimanale sul grado di turbolenza/tensione dei mercati finanziari, con particolare attenzione all’Italia.
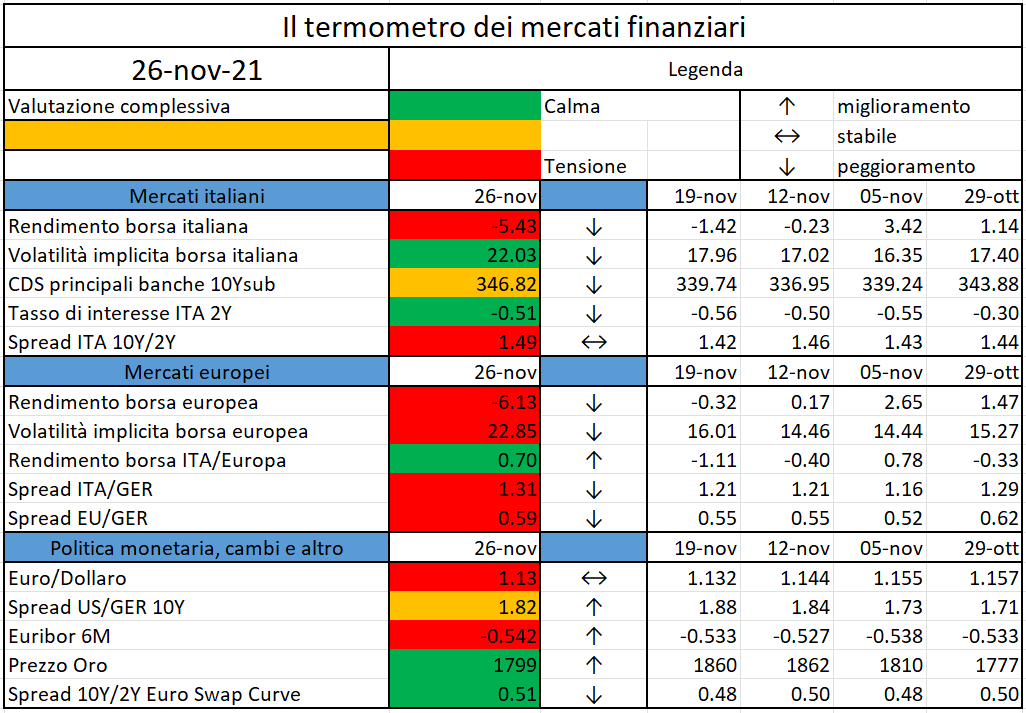
Significato degli indicatori
I colori sono assegnati in un’ottica VaR: se il valore riportato è superiore (inferiore) al quantile al 15%, il colore utilizzato è l’arancione. Se il valore riportato è superiore (inferiore) al quantile al 5% il colore utilizzato è il rosso. La banda (verso l’alto o verso il basso) viene selezionata, a seconda dell’indicatore, nella direzione dell’instabilità del mercato. I quantili vengono ricostruiti prendendo la serie storica di un anno di osservazioni: ad esempio, un valore in una casella rossa significa che appartiene al 5% dei valori meno positivi riscontrati nell’ultimo anno. Per le prime tre voci della sezione “Politica Monetaria”, le bande per definire il colore sono simmetriche (valori in positivo e in negativo). I dati riportati provengono dal database Thomson Reuters. Infine, la tendenza mostra la dinamica in atto e viene rappresentata dalle frecce: ↑,↓, ↔ indicano rispettivamente miglioramento, peggioramento, stabilità rispetto alla rilevazione precedente.
Disclaimer: Le informazioni contenute in questa pagina sono esclusivamente a scopo informativo e per uso personale. Le informazioni possono essere modificate da finriskalert.it in qualsiasi momento e senza preavviso. Finriskalert.it non può fornire alcuna garanzia in merito all’affidabilità, completezza, esattezza ed attualità dei dati riportati e, pertanto, non assume alcuna responsabilità per qualsiasi danno legato all’uso, proprio o improprio delle informazioni contenute in questa pagina. I contenuti presenti in questa pagina non devono in alcun modo essere intesi come consigli finanziari, economici, giuridici, fiscali o di altra natura e nessuna decisione d’investimento o qualsiasi altra decisione deve essere presa unicamente sulla base di questi dati.

With the implementation deadline of the new International Financial Reporting Standards rapidly approaching, it is worth recalling the ensuing implications: this article provides an idea of what to expect and how to respond, covering an overview of the framework and introducing the actions required to put that into practice. The topic is under the spotlight: last mid-September the Italian Regulator, IVASS, concerned by the great impact the new principles will have on the financial position, economic result, and operation resources of the companies, launched a survey (due date 31.12.21) requiring qualitative information on IFRS9 and 17 about budget and costs, roles and responsibilities, governance and DQ, technical choices for the implementation, synergies with SII and a view on the cost/benefit balance.
In a nutshell, one can say that, compared to IFRS4, IFRS17 takes a long-term view, tends to postpone the profit profile, and immediately shows all the losses, without allowing for compensations. It globally increases the consistency on the accounting of insurance contracts (not just in Europe), providing a disclosure of the profit drivers, and deeply changing the estimation of insurance contracts, based on market consistent evaluations for the Liabilities and expected profits.
As ruled by the IASB (International Accounting Standards Board), an independent group of experts responsible for the development and publication of IFRS Standards, IFRS17 (Insurance Contracts) and IFRS9 (Financial Instruments) will replace IFRS4 and IAS39 starting from the 1st of January 2023. IFRS17 aims at increasing consistency on the accounting of insurance contracts and at providing a more effective measurement of revenues, while IFRS9 aims at addressing the deficiencies of the financial accounting risen over time, by regulating the classification and measurement of financial instruments, the impairment of financial assets and the hedge accounting. IFRS9 came into force last 1st January 2018, but the undertakings are temporary exempted for its application (in case of deferral, specific information must be disclosed in their financial statements) to have a chance for an implementation alongside IFRS17, pursuing the minimization of accounting mismatches and a profitable ALM strategy. Indeed, the IFRS17 principles require the undertakings to classify their Liabilities into 2 categories (FVTPL – Fair Value Through Profit and Loss, and FVTOCI – Fail Value Through Other Comprehensive Income), used for the Assets too, allowing, without forcing (no imposed constraints), for a coherence: a suitable accounting choice made for both helps to reduce the profit volatility. This article is not meant to cover IFRS9 and explores IFRS17 starting from the new principles, explaining the consequences it brings and ending with a description of the enablement of technology and processes required to comply to it and the actions the companies should take to react.
Even though the deadline for IFRS17 has already been deferred twice (from 2021 to 2022 in November 2018 and from 2022 to 2023 in March 2020) not all the aspects of the standards have been yet clarified: last July 2021 the IASB issued an ED (Exposure Draft) with few amendments concerning the requirements for entities that first apply IFRS17 and IFRS9 at the same time (to avoid accounting mismatches in the comparative period, the undertakings may opt for the “Classification overlay approach”, presenting info on financial assets as if IFRS9 was applied) and a Final Draft is expected for the end of the year to unravel the requirements of grouping the portfolio into annual cohorts, criticized by both the EFRAG (European Financial Reporting Advisory Group) and the ARC (Accounting Regulatory Committee). The former, last 31.03.2021, endorsed to the European Commission (EC) all the requirements set by IFRS17 with this exception; the latter, last 16.07.21, voted in favour of the EC draft proposal for the IFRS17 implementation at European level with an option to carve out the annual cohorts for Segregated Funds, that was regulated last 23.11.21 in the EU Official Journal with a sort of “temporary measure” valid until next 31.12.27, when the topic will be re-examined by the EC. Given the asymmetric accountability of IFRS17 (losses immediately recognized and profits deferred over time), the application of annual cohorts would add costs (no possibility of offsetting) without reflecting the true economic nature of certain insurance products, designed with intergenerationally-mutualisation and widespread in the European Latin countries. The European Companies must now choose whether to applying or not the carve out: if the option will not be confirmed in 2027, the today application will then result in the need of a restatement. Hence, Companies have now to choose between postponing an issue or playing in an unlevel field with respect to the competitors who choose to apply it. EFRAG is a private association composed of stakeholders and national organizations that promotes the European view in the field of financial reporting, to make it considered by the IASB in its standard setting process; it advises the European Commission on whether new or revised IFRS are compliant to the IAS regulation and can be adopted in European Union; the ARC provides opinion to the European Commission on proposals adopting IFRSs at European level.
Let us explore the principles of IFRS17.
The perimeter of application is given by insurance, investment with DPF and reinsurance contracts, whose definition remains unchanged from IFRS4, albeit the significancy of the insurance risk shall now be tested on the present value of future potential cash flows, rather than on their nominal value. All the calculations shall be carried out at a very granular level (UoA – Unit of Account), that excludes the opportunity for offsetting profitable and onerous contracts and increases the frequency of loss recognition and reduction in available capital: the UoA shall at least distinguish the portfolio (contracts subject to similar risks, managed together), the profitability (onerous, profitable, likely to become onerous) and the cohort (year of issuance). The profitability is assessed by an “Onerous Contract Test” (OTC) at recognition, that somehow replaces the IFRS4 LAT (Liability Adequacy Test). This “label”, defined at a certain point in time, does not change in the future, albeit the profitability can: every change is either captured in an accountant reserve, called CSM (see below) or directly reflected in the Profit and Loss (P&L). Any interaction among different UoA (as in the case of New Business inserted in an existing Segregate Fund with “In Force”, IF, business) shall be captured as “mutualization effect” to re-evaluate their liability value prior to the interaction. The OCT may be performed on a standalone basis (no contribution of the IF, i.e. starting with 0 assets), on a marginal basis (by taking the difference between the IF with-without NB) or on a proportional basis (by splitting the unrealized gains of the IF portfolio between IF and NB).
For what concerns the unbundling, the principle states that an investment component is “distinct” from the insurance one (falling under IFRS9) only if a contract with equivalent terms can be sold in the same market and the two parts are not highly interrelated (i.e. if one can be measured without considering the other): this seems to suggest that hybrid products and UL with death benefit guarantees fall under IFRS17. Still, the NDIC (Non-Distinct Investment Component or Deposit) of a policy, defined as the amount received by the policyholders regardless of whether the insured event has happened, shall be estimated, and disaggregated from the Insurance part: premiums and claims related to the NDIC are directly accounted for in the BS (Balance Sheet), not through the IS (Income Statement); this way, the investment components are identified when revenues and claims are detected. While under the Local Gaap, premiums and outstanding claims are based on an accrual-accounting principle (transactions and events enter in the accounts when they occur and not when amounts are actually paid), under IFRS17 only outstanding claims are while the premiums are considered when cashed in.
The Technical Liabilities are calculated as the Present Value of Future Cash Flows (PVFCFs) plus a provision for risk, the Risk Adjustment (RA), that reflects the level of compensation (to be translated into a disclosed equivalent confidence level) the insurer demands for bearing the uncertainty embedded in the amount and timing of CFs. The RA can be either calculated though a Cost of Capital (CoC) approach or as a Value at Risk that covers the entire period. Even though it requires more calculations, most of companies are opting for the second choice, being quite complicated to translate a confidence level into a CoC value (for the avoidance of doubt, the 6% CoC of SII is not equivalent to a quantile of 99.50%). As depicted in the part of the article that describes the new scheme for the Income Statement (see below), together with the Expected Claims, the RA change compares to the Actual Claims, to capture the non-economic variance: the higher the RA, the higher the uncertainty around the projections.
The discount rates adopted reflect current interest rates and are adjusted to the characteristic of the Liabilities, especially with respect to illiquidity, to counterbalance the credit effect on the asset side. The discount rates can be defined following a bottom-up or top-down approach, that should lead to the same result: in case of spike in the credit spreads, the former would raise the risk-free yields by a proportionate Illiquidity Premium (IP) and the latter would decrease the portfolio yields by a portion of the credit risk. The bottom-up approach reminds the definition of the risk-free rates provided by EIOPA in the SII context, with the IP being like the VA (Volatility Adjustment), calibrated on the undertakings portfolios, rather than on an average European one, but can be also derived in other ways. The undertakings shall define at least four yield curves to project and discount Segregated Funds (SF), Unit Liked (UL), Term and Hybrid products, with the possibility of adopting a more granular split for the SF group, based on their asset mix. The discount rate definition is probably one of the trickiest pieces of the puzzle, having a material impact on both the opening balance sheet and ongoing performance: the projections must be Risk Neutral (RN), but they are somehow meant to be, to a certain extent, Real Word (RW), as they compare to RW actual values: all the differences between projection and reality are indeed reflected into the P&L (either entirely, when connected to the current evaluation, or to a certain portion, when connected to future years – see CSM) and may cause both unintended movements in the BS and unintended postponements of the profit profile, with the latter known as Bow Wave Effect.
If the PVFCFs produces a gain, this is offset by the CSM (Contractual Service Margin), to be amortized over the life of the contract: the CSM is indeed defined as the expected unearned contract profit. At inception, it is equal in magnitude and opposite in sign to the PVFCFs plus the acquisition costs already paid. The CSM should be released into the P&L to best reflect the services already provided and the remaining duration, following an amortization pattern called Coverage Unit. While the unwinding of the CSM follows a predefined pattern, adjusted to account for the experience variance (when duration increases/decreases, the profit distribution gets lower/higher), the unwinding of the RA is governed by a mere recalculation; although they do not follow the same reduction, their decreases are correlated to a certain extent, depending on the type of product: the reduction of the insurance service to be provided should in fact correspond to a reduction in the uncertainty of estimation of insurance risk (higher correlation for protection business, lower correlation for saving business).
The CSM accrues interests based on the discount rate locked in at inception and acts as a cushion to absorb the volatility related to future services (driven for instance by changes in the assumptions) to provide a smoother profit. It cannot become negative (any loss is immediately recognized in the P&L) and it cannot absorb the volatility related to past and current services (i.e. differences between actual and expected claims incurred), that is recognized in the P&L. The CSM is an accountant reserve, that summed up to the technical reserves (PVFCFs + RA) defines the total Liability: LRC – Liability for Remaining Coverage. The LCR sums up to the Liability for Incurred Claims (LIC), that should finance the claims already happened (it can be equated to the IFRS4 Reserve for Outstanding Claims).
With the transition to IFRS17 and setting up of the opening BS, the undertakings will experience a trade-off between the CSM and SE: the higher the CSM (higher future profits), the lower the Shareholder Equity (SE), lower profits distributable today mean higher cushion for the future. This shift of distribution of the profit over time, that impacts the IS, is expected to influence the judgement of analysts and investors.
As opposite to the Local BS, where the evaluations of Assets and Liabilities are based on historical or book values, IFRS17 requires to look at market values, increasing the volatility of the BS, that fluctuates with the market conditions. This peculiarity reminds of SII, and a bridge can be provided to this existing basis (the MVA can be associated to the Underlying Items, the BEL to the PVFCFs, the CSM to the PVFP, the RM to the RA, the TP=BEL+RM to the LFRC=PVFCFs+RA), but all the differences must be kept in mind: above all, the fact that the CSM is an accounting reserve and that the RA shall be evaluated for the ceded business too, being an asset for the company. Moreover, IFRS17 is principle based, while SII is ruled based; IFRS17 applies at global level, SII applies at European level. It is important to underline that the new IFRS accounting numbers are meant to “substitute” the Local Gaap views, without affecting the SII metrics, except for an indirect impact through taxes, depending on local tax rules.
The Standard uses three measurement approaches:
the default one, following the principles outlined above
eligible for short-term contracts (<=1y) and similar to existing approaches for non-life insurance products incorporates two elements: LRC and LIC (Liability for Incurred Claims). The former measures the obligation to provide coverage during the coverage period (rate of net premium: premiums minus directly attributable costs), while the latter, calculated as PVFCFs + RA, measures the present value of claims that have already occurred, whether reported or not. The former does not include a RA, although there is a test for an adjustment for the outstanding risk.
represents a variation of the BBA, suitable for contracts with direct participation features: it assumes that a participating contract pays to the PH an amount equal to the fair value of the underlying items, net of a “variable fee”, charged for the service provided (management of underlying items). Differences in the financial variates are no more recognized in the PL or OCI, but are adjusted against the CSM, that acts as a buffer for changes in future estimates of fee expected to be earned, reducing earnings volatility; it accrues based on current rates rather than at locked-in rates as in the BBA. The VFA can be applied (eligibility of VFA) under the proof that these 3 criteria are met: the PH participates in a share of a clearly identified pool of underlying items; claims are expected to equal a substantial share of the fair value returns from the underlying items; a substantial proportion of any change in the amounts paid to the PH varies with the change in fair value of the underlying items.
IFRS17 shall be applied retrospectively, as if it has always been applied: the cumulative effect of transition is recognized in opening CSM and accumulated OCI for changes in interest rates since the beginning of the contract. Three approaches are allowed and can be combined to determine the optimal approach to transition
theoretically, for each UoA, undertakings should determine the PVFCFs, CSM and discount rate at inception and roll them forward to the transition date; given the difficulties to carry out such an exercise, the companies are allowed to use these two alternative methods
specific adaptations for VFA contracts, that blends a projection of the future to an experience of the past: basically, it consists in determining a CSM at the date of transition and correcting it for the fees of the services already provided in the previous years
can be applied as an alternative to (or together with) the MRA, when the FRA is not applicable (there is no written preference between MRA and FVA) and consists in evaluating the initial CSM as the value a third party would quote the portfolio if it was to buy it: it should consider a sort of “haircut” to the base condition applied by the undertakings in their calculation, to embed the risk this third party would bear and a margin it expects to gain.
For those companies owning onerous portfolios, IFRS17 may appear as an opportunity to “clean them up” and “start over”, by declaring their Loss at transition, lowering the SE, and by managing potential profits in the future. However, time by time, these potential profits will be used to reduce the initial Losses, directly going into the P&L, likely increasing its volatility, until they become CSM (supposing the VFA methodology is applied).
IFRS17 aims at increasing the transparency in the financial statements by providing information about how much the undertakings expect to pay to fulfil their obligations, how much risk they have taken on, how much uncertainty is contained in the amounts reported, what drives the performance. Together with the new measurement principles outlined above, IFRS17 requires a new scheme for the Income Statement (IS), often referred to as Profit and Loss Statement (P&L): differently from the Revenues Accounting (IFRS4), that derives the profit by volumes (Premiums, Claims, …), and similarly do the Deposit Accounting (IAS39), that derives the profit by margins (Loadings, Redemption Penalties, …), the IFRS17 IS shows the key elements that form the profit, based on the Financial Results (or investment performance) and Insurance Service result – indeed, the liabilities embed both the deposits (NDIC) and insurance components, and the financial income of the Underlying Items compares to the capitalization of the Liabilities. As said, the losses are immediately recognized, while the profit is released through the lifetime of the policy by the CSM, that also absorbs potential changes in future services, while the experience variance of the current ones is measured by the difference of Actual and Expected claims and expenses. The initial returns from the NB are lowered by the profit elimination and the NB CSM becomes an alternative measure for the NBV. The Gross Written Premiums (GWP), somehow replaced by the new Insurance Revenue measure, are likely to be published as part of the voluntary disclosure by many firms, now being widely used as KPI. Indeed, most of the current indicators (GWP, net volumes, combined ratios) will be kept by the market, and some others will be reviewed considering the IFRS17 metrics (ROE adjusted to take into consideration the OCI option and CSM). New KPI will be likely defined as the CSM at inception, the change in CSM (increase/decrease in profit) and in its release (duration of liabilities), the % of CSM on the Liabilities, the Investment Result, the growth rate of Insurance Revenue, the Attributable Expenses paid, the OCT and the Reinsurance Result Ratio.
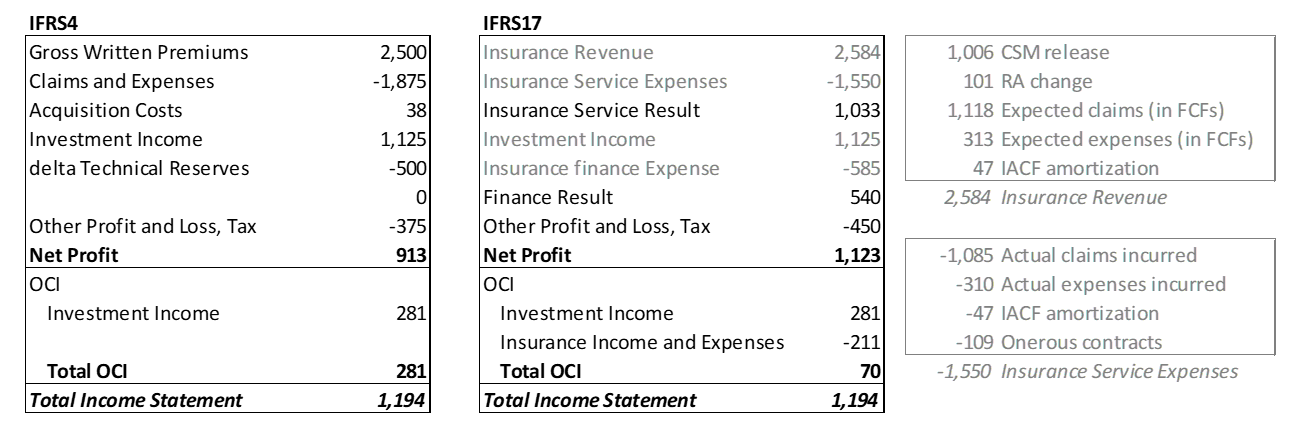
[illustrative figures: please note that the Total Income Statement may differ from IFRS4 and IFRS17]
The choice of classification of the Liabilities defines where to report their impacts to changes in the market discount rates: if FVTPL is chosen, the impact is registered in the P&L; if the FVTOCI is chosen, the impact directly goes into the SE. To clarify the advantages of a coherent Assets and Liabilities FVTOCI classification, let us imagine a certain reporting period during which the market shocks both risk-free rates and credit spreads. Those movements drive changes into the MVA (Market Value of Assets) and, in turn, into Realized and Unrealized Gains and Losses (R/UGL), then reflected into changes to the Liability values (Unwinding, Future Discretionary Benefits, TVOG), driven by the risk-free rates as well. On the Asset side, if those meet the criteria to be classified as FVTOCI, the RGL are recognized in the P&L, while the UGL are frozen in the OCI; on the Liability side, if the FVTOCI is chosen, only the interests accrued at the locked-in rate (measured at inception) are recognized in the P&L, while the delta to the RGL is frozen in the OCI. For a coherent movement of Assets and Liabilities in the BS, the impact of the credit spreads on the UGL shall be embedded in the liability discount, though a proper definition of discount rates, made possible by IP. Differently from the Local Gaap, where, thanks to the Segregated Funds shifting rules, the companies were often encouraged to realize gains in the latest months of the calendar year (to take the advantage of seeing an immediate effect on the asset side, postponing the Liability one to the following year), IFRS17 looks at the long-term future and, by the CSM, postpones the profit: only one umpteenth would go to the P&L.
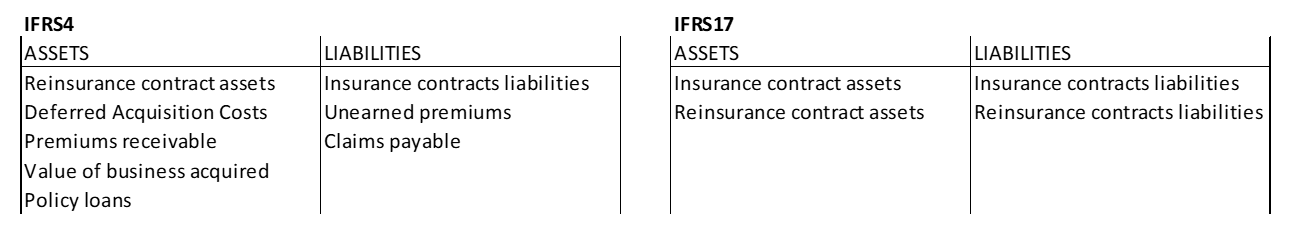
The presentation of the BS changes as well: the IFRS4 DAC (Deferred Acquisition Costs), receivable and unearned premiums are included in the IFRS17 measurement of the Insurance Contract Liabilities.
Please note that the Reinsurance cannot be measured under the VFA. The cedant should evaluate the Reinsurance Assets (RA, or RR – Reinsurance Recoverable) using the same assumptions adopted for the corresponding part of the reinsured underlying contracts, allowing for a Credit Default Adjustment to account for the possibility of the reinsurer to default. Potential losses of the underlying contract cannot be offset by profitable reinsurance arrangements: in an extreme example, an entity with 100% quota share reinsurance and no retained risk would still report a loss, that will even out over the life of the contract.
Besides taking along changes in revenues and earning patterns, IFRS17 requires a revolution of the existing IT infrastructures and systems, processes and operating model, reporting: the high granularity, the back through time evaluations and the increased use of market data come with issues on data quality, data governance and data volume, requiring new data warehouse capabilities; the need of reassessing the profitability and split insurance components from financial ones, the identification of contract boundaries and allocation of expenses combines with the requirement of brand new calculations, implying enhancements to existing cash flows models (different grouping, onerous status, cohorts, new variables), earnings engines and allocation tools (attributable expense assumptions) and the introduction of other calculation engines (specific calculation engine to evaluate, track and amortize the CSM); together with the overhaul of existing planning tools (new cohort-based modelling, new profitability drivers, new pricing assumptions); finally, new charts of accounts must be developed for a more detailed disclosure (new nominal codes to account for CSM accretion/run-off, amortisation, adjustments, and de-recognition).
So, as a recap, one can say that IFRS17 takes a long-term view, tends to postpone the profit profile, and immediately shows all the losses, without allowing for compensations. It globally increases the consistency on the accounting of insurance contracts (not just in Europe), providing a disclosure of the profit drivers, and deeply changing the estimation of insurance contracts, based on market consistent evaluations for the Liabilities and expected profits.
Considering that, the Companies should focus on the technical pricing, by re-examining the profit emergence patterns, the eligibility of the VFA application and the potential loss a specific cohort may show. The design of life insurance product should become even more asset-driven and insurers should upgrade their ALM capabilities to better manage ALM mismatches; they should consider investing more in derivatives. To avoid volatility, insurers should ensure that a contract does not become lossmaking over time: this can be achieved by adopting more conservative modelling choices on the CSM, yield curves, and expenses. Finally, smart technical implementation choices on the Assets and Liabilities classification decrease the likelihood of having to book adverse loss experienced through the P&L account.
Reference:
https://www.ifrs.org/groups/international-accounting-standards-board/
https://eur-lex.europa.eu/legal-content/IT/TXT/PDF/?uri=OJ:L:2021:416:FULL&from=IT
The European Securities and Markets Authority (ESMA), the EU’s securities markets regulator, today publishes the second Risk Dashboard for 2021, covering the third quarter of the year…
Con Open Banking si intende un ecosistema aperto e digitale che consente, anche senza la presenza di accordi prestabiliti, lo scambio di dati e informazioni, non solo finanziarie, tra gli operatori (bancari, finanziari e non) che ne fanno parte…
“The Law Commission’s analysis demonstrates the flexibility of the common law to accommodate technological developments, particularly in the context of smart legal contracts,” said the announcement…
https://cointelegraph.com/news/uk-law-commission-affirms-english-and-welsh-laws-apply-to-smart-contracts
