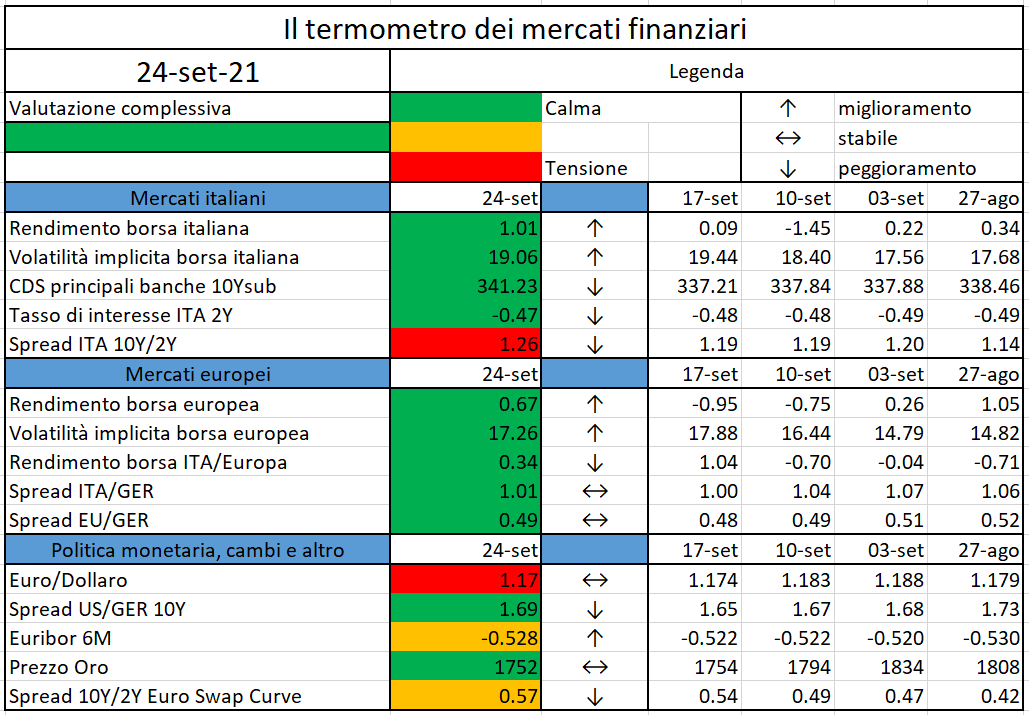
L’iniziativa di Finriskalert.it “Il termometro dei mercati finanziari” vuole presentare un indicatore settimanale sul grado di turbolenza/tensione dei mercati finanziari, con particolare attenzione all’Italia.
Significato degli indicatori
Rendimento borsa italiana: rendimento settimanale dell’indice della borsa italiana FTSEMIB;
Volatilità implicita borsa italiana: volatilità implicita calcolata considerando le opzioni at-the-money sul FTSEMIB a 3 mesi;
Future borsa italiana: valore del future sul FTSEMIB;
CDS principali banche 10Ysub: CDS medio delle obbligazioni subordinate a 10 anni delle principali banche italiane (Unicredit, Intesa San Paolo, MPS, Banco BPM);
Tasso di interesse ITA 2Y: tasso di interesse costruito sulla curva dei BTP con scadenza a due anni;
Spread ITA 10Y/2Y : differenza del tasso di interesse dei BTP a 10 anni e a 2 anni;
Rendimento borsa europea: rendimento settimanale dell’indice delle borse europee Eurostoxx;
Volatilità implicita borsa europea: volatilità implicita calcolata sulle opzioni at-the-money sull’indice Eurostoxx a scadenza 3 mesi;
Rendimento borsa ITA/Europa: differenza tra il rendimento settimanale della borsa italiana e quello delle borse europee, calcolato sugli indici FTSEMIB e Eurostoxx;
Spread ITA/GER: differenza tra i tassi di interesse italiani e tedeschi a 10 anni;
Spread EU/GER: differenza media tra i tassi di interesse dei principali paesi europei (Francia, Belgio, Spagna, Italia, Olanda) e quelli tedeschi a 10 anni;
Euro/dollaro: tasso di cambio euro/dollaro;
Spread US/GER 10Y: spread tra i tassi di interesse degli Stati Uniti e quelli tedeschi con scadenza 10 anni;
Prezzo Oro: quotazione dell’oro (in USD)
Spread 10Y/2Y Euro Swap Curve: differenza del tasso della curva EURO ZONE IRS 3M a 10Y e 2Y;
Euribor 6M: tasso euribor a 6 mesi.
I colori sono assegnati in un’ottica VaR: se il valore riportato è superiore (inferiore) al quantile al 15%, il colore utilizzato è l’arancione. Se il valore riportato è superiore (inferiore) al quantile al 5% il colore utilizzato è il rosso. La banda (verso l’alto o verso il basso) viene selezionata, a seconda dell’indicatore, nella direzione dell’instabilità del mercato. I quantili vengono ricostruiti prendendo la serie storica di un anno di osservazioni: ad esempio, un valore in una casella rossa significa che appartiene al 5% dei valori meno positivi riscontrati nell’ultimo anno. Per le prime tre voci della sezione “Politica Monetaria”, le bande per definire il colore sono simmetriche (valori in positivo e in negativo). I dati riportati provengono dal database Thomson Reuters. Infine, la tendenza mostra la dinamica in atto e viene rappresentata dalle frecce: ↑,↓, ↔ indicano rispettivamente miglioramento, peggioramento, stabilità rispetto alla rilevazione precedente.
Disclaimer: Le informazioni contenute in questa pagina sono esclusivamente a scopo informativo e per uso personale. Le informazioni possono essere modificate da finriskalert.it in qualsiasi momento e senza preavviso. Finriskalert.it non può fornire alcuna garanzia in merito all’affidabilità, completezza, esattezza ed attualità dei dati riportati e, pertanto, non assume alcuna responsabilità per qualsiasi danno legato all’uso, proprio o improprio delle informazioni contenute in questa pagina. I contenuti presenti in questa pagina non devono in alcun modo essere intesi come consigli finanziari, economici, giuridici, fiscali o di altra natura e nessuna decisione d’investimento o qualsiasi altra decisione deve essere presa unicamente sulla base di questi dati.
While carrying out the revision process of SII during 2020, EIOPA realized that insurers and supervisors are adopting several divergent practices regarding the Technical Provisions (TP) evaluation, leading to an unlevel playing field. To address this, EIOPA wishes for a revision of the existing guidelines, by introducing clarifications on the implementation of Future Management Actions (FMA), the usage of Expert Judgment (EJ), the expense modelling and allocation, the assumptions underlying the use of Economic Scenarios Generators (ESG) for the evaluation of Time Value of Options and Guarantees (TVOG), the Dynamic Policyholder Behaviour (DPHB) modelling, and the calculation of Expected Profits In Future Premiums (EPIFP).
Last 11 June 2021, the Authority published a consultation paper on the revision of the TP evaluation. Comments under the form of a survey shall be answered by next 12th of November 2021 and the contributions received and a Final Report will be made available at the end of the public consultation period; EIOPA will then submit the guidelines for adoption by its Board of Supervisors. EIOPA has already conducted an initial analysis of costs and benefits the new guidelines would bring and has already analysed different policy options throughout the policy development process, that are presented in the following, with amendments to the existing regulation underlined.
FUTURE MANAGEMENT ACTIONS
To put the approver in the position of evaluating the consequences of retaining each FMA and the interaction between them, a complete view of all FMA and all the needed information shall be clearly provided.
Guideline 40a – Comprehensive management plan [new]
The FMA plan, approved by the administrative, management or supervisory body, shall be either in the form of a single document or a set of documents accompanied by an inventory, where all the assumption for the FMA used in the BE (Best Estimate) calculation are reported.
Guideline 40b – Consideration of new business (NB) in setting future management actions [new]
Realistic assumptions on NB and on other related topics (asset allocation, bond reinvestment or profit sharing) shall be considered and shall not be influenced by the application of contract boundaries. This does not require to project future profits linked to the NB, but rather to project investments profits based on the assumption of writing NB, if this was the case, for instance leaving unchanged the durations of assets and liabilities (that would otherwise decrease in a run off portfolio, leading to decreasing returns and to an underestimation of the profit sharing).
ASSUMPTIONS and EXPERT JUDGEMENT
EJ is widely used by the undertakings when setting assumptions for valuation purposes and can modify the results in a sensible manner. EIOPA suggests clarifying the framework under the Standard Formula.
Consistent approach under both Standard Formula (SF) and Internal Models (IM)
Option1: introduction of a full set of guidelines on EJ for valuation of TP under SF
Option2: in a specific guidance, introduction of a reference to the guidelines on EJ for IM
Option3: in recitals 1.3 reference to Chapter 4 of the IM guidelines on EJ (current situation)
As the recitals cannot enforce an obligation, EIOPA suggests choosing between Option 1 and 2, that are similar in terms of cost and benefits: undertaking should just slightly amend existing practices, with no material additional costs and supervisor authorities are expected to benefit an easier review of the calculation, with lower administrative costs. EIOPA promotes Option 1 as Option 2 would force the undertakings using SF to refer to guidelines not directly applicable, although ensuring a perfect consistency between SF and IM. All the following guidelines are identical to those established for IM, with an exception for 24a, where “extreme losses conditions” has been replaced with “binary events, …”, a sentence more suitable for a SF context.
Guideline 24a – Materiality in assumptions setting [new]
Undertakings shall set the assumptions and EJ usage considering the materiality of the impact, that should be assessed both in a qualitative and quantitative manner, adopting binary events, extreme events and events not even appeared in historical data. Examples of such events would include environmental issues such as global warming, and legislative or political changes that might impact the sustainability of the business model (either by increasing claim amounts or by reducing the volumes of new business).
Guideline 24b – Governance of assumptions setting [new]
Undertakings shall assure that assumptions and EJ usage are derived and used consistently over time, are fit for their intended use, are approved at level of sufficiently seniority and follow a validated and documented process.
Guideline 24c – Communication and uncertainty in assumptions setting [new]
Undertakings shall establish a formal and documented feedback process between the providers and the users of material EJ and resulting assumptions, avoiding misunderstanding or miscommunication, by making the uncertainty of the assumptions and the associated variation of results crystal clear.
Guideline 24d – Documentation of assumptions setting [new]
The assumptions setting process shall be documented in a transparent manner, including the resulting assumptions and their materiality, the experts involved, the intended use and the period of validity.
Guideline 24e – Validation of assumptions setting [new]
The process for choosing assumptions and using EJ shall be validated. A document should report the validation process, the tool adopted (such as stress testing or sensitivity testing) and the changes of
material assumptions in response to new information, tracking and explaining the main changes as well as deviations of realizations from material assumptions.
EXPENSE MODELLING and ALLOCATION
Thanks to its survey carried out in June 2019, EIOPA found several different practices of how investment management expenses are considered in the calculation of TP.
Proportion of investment management expenses to be considered
Option1: expenses relating to all assets
Option2: expenses relating to investments backing SII TP and SCR
[requires an approximation to be made because of a circular reference to SCR]
Option3: expenses relating to investments backing SII TP
Option4: expenses relating to investments backing SII BE
Option5: expenses relating to investments backing the Local GAAP TP
All the options proposed would lead to a more prudent approaches than the current one (in order of increase in TP) and would impact a different quota share of the market, as reported in the table
Option
Life
Non-Life
Composite
Reinsurance
1
50%
50%
50%
40%
2
50%
40%
50%
50%
3
50%
30%
40%
40%
4
50%
30%
40%
30%
5
80%
90%
70%
90%
EIOPA promotes Option 2, that appears to be the most in line with article 78 (1) (1) of the SII Directive (all expenses that will be incurred have to be considered) and does not preclude the undertakings to pursue Option 1, considering all assets.
Management of expenses that the fund manager reimburses to the undertaking
Option1: reimbursement should be considered as decrease of expenses
Option2: reimbursement should be considered as other cash inflow
Option3: reimbursement should not be considered
In the same survey, EIOPA observed that 60% of the undertakings stated that reimbursements were not considered or not material. EIOPA is in favour of Option 2, that leads to the same value of TP of Option 1, but with a higher SCR, as expenses are stressed. Option 3 would increase both the TP and SCR.
Undertakings shall consider administrative and trading expenses related to an amount of investments at least equal to SII TP + SCR. Reimbursements of investment management expenses shall be considered as other incoming cash flows (and other outcoming cashflows in case the reimbursement is shared with the policyholders or other third parties).
Guideline 30 – Apportionment of expenses [amendment]
Undertakings shall allocate and project expenses in a realistic and objective manner, basing their allocation on both long-term business strategies and recent analyses of the operations, by identifying appropriate expense drivers. Regarding long-term business strategies, in case of run-off, the expense assumptions shall be amended accordingly to the process. Overheads can be allocated following the simplifications outlined in Technical Annex I, only in presence of annual new business and claims occurring uniformly during the coverage period.
Guideline 33 – Changes in expenses [amendment]
Undertakings shall ensure that the assumptions regarding the evolution of expenses over time are appropriate and consider the nature of the expenses involved, the projected inflation and the dependency on other cash flows of the contracts.
TVOG and ECONOMIC SCENARIO GENERATOR
Stochastic modelling of options and guarantees intends to capture their time value, which is not embedded in a deterministic projection. The profit sharing, that woks under asymmetric basis (profits are shared with the policyholders, while losses are completely absorbed by the undertakings), is indeed very sensitive to the scenario considered and the combined effect of financial guarantees and surrender options can boost the impact.
To decide whether a stochastic evaluation is needed to model the uncertainty of certain biometric risk factors, undertaking shall consider the duration of the liabilities and assess the error introduced in the results by the model chosen. Specificities of the risk factors shall be considered, and the level of correlation shall be based on historical data and EJ (removed: “as set out in the guidelines on EJ”).
Guideline 53a – Use of stochastic valuation [new]
Undertakings shall make use of stochastic modelling in presence of any kind of profit-sharing mechanism with future benefits depending on the return of the assets and in presence of other financial guarantees (like technical rates), even more so when combined with options (like surrender options), whose dynamic modelling increases the value in extreme scenarios.
Undertakings shall ensure that their modelling adequately reflects the volatility of their assets, by considering all the relevant sources of volatility, including spread risk and default risk and negative interest rates.
DYNAMIC POLICYHOLDER BEHAVIOUR
The most modelled DPHB relates to surrender options, particularly relevant in stochastic scenarios, where dynamic lapses are path dependent. Undertakings shall properly consider the interaction between the relevant FMA and the DPHB: surrender levels can be linked to the comparison between contract return, directly influenced by the FMA, and a return offered by the market.
The assumptions on the exercise rate shall be based on both statistical evidence (when representative of future conduct) and a sound EJ (if needed). Lack of data in extreme scenario shall not prevent from assuming the option to be exercised.
Guideline 37b – Bidirectional assumptions [new]
The dependency on the trigger event and the exercise rate of the option is bidirectional: both increases and decreases shall be considered.
Guideline 37c – Option to pay additional or different premiums [new]
All relevant contractual options shall be projected, including the option to pay additional premiums (top ups) or to vary their amount.
EXPECTED PROFITS IN FUTURE PREMIUMS
EPIFP are determined as the positive difference between the official calculation of TP without RM (Risk Margin) and a calculation of TP without RM under the assumption that future premiums (and related benefits) expected to emerge from existing contracts will not occur. EIOPA believes that the current set of guidelines fails to provide a clear regulatory framework and that the new one would ease the supervision and would require the undertakings to modify their assumptions and methodologies only slightly.
Detailed guidance on the calculation of EPIFP
Option1: clarification on the assumptions to be used for the calculation
Option2: no further clarification
Guideline 77 – Assumptions used to calculate EPIFP [amendment]
When calculating the EPIFP all the assumptions (mortality, lapse, expenses, time horizon, DPHB, FMA, …) shall remain unchanged, but the expectation to receive future premiums, that must be nullified. Still, the policies should be treated as they continued to be in force (rather than being considered as surrendered) and the calculation should not include penalties, reductions, or any other type of adjustment to the theoretical actuarial valuation. Even if all assumptions on expenses should remain constant, the level of some expenses (such as acquisition or investment management) could be indirectly affected. Some acquisition expenses can be excluded, but all the fixed costs, such as salaries, shall remain unchanged; variable expenses will be only indirectly influenced by lower invested reserves resulting from no future premiums. The actuarial function should always validate EPIFP calculation.
Guideline 78 – Alternative approach to calculate EPIFP [new]
An alternative calculation, validated by the Actuarial Function, can be adopted if the one reported in Guideline 77 is too complex.
Reference:
“Consultation paper on the revision of the guidelines on valuation of technical provision”, EIOPA-BoS-21/302, 11/06/2021
La Commissione europea ha adottato una revisione della Direttiva 2009/138/CE sull’accesso ed esercizio delle attività di assicurazione e di riassicurazione (Solvency II) affinché le imprese di assicurazione possano aumentare gli investimenti a lungo termine nella ripresa dell’Europa dalla pandemia di COVID-19…
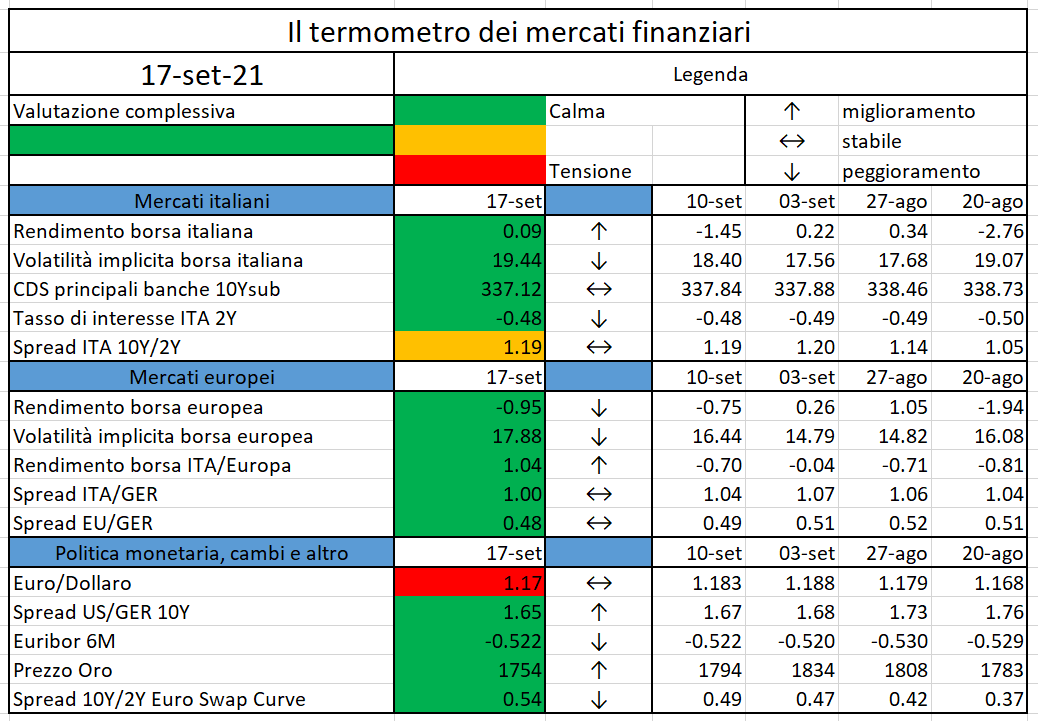
L’iniziativa di Finriskalert.it “Il termometro dei mercati finanziari” vuole presentare un indicatore settimanale sul grado di turbolenza/tensione dei mercati finanziari, con particolare attenzione all’Italia.
Significato degli indicatori
Rendimento borsa italiana: rendimento settimanale dell’indice della borsa italiana FTSEMIB;
Volatilità implicita borsa italiana: volatilità implicita calcolata considerando le opzioni at-the-money sul FTSEMIB a 3 mesi;
Future borsa italiana: valore del future sul FTSEMIB;
CDS principali banche 10Ysub: CDS medio delle obbligazioni subordinate a 10 anni delle principali banche italiane (Unicredit, Intesa San Paolo, MPS, Banco BPM);
Tasso di interesse ITA 2Y: tasso di interesse costruito sulla curva dei BTP con scadenza a due anni;
Spread ITA 10Y/2Y : differenza del tasso di interesse dei BTP a 10 anni e a 2 anni;
Rendimento borsa europea: rendimento settimanale dell’indice delle borse europee Eurostoxx;
Volatilità implicita borsa europea: volatilità implicita calcolata sulle opzioni at-the-money sull’indice Eurostoxx a scadenza 3 mesi;
Rendimento borsa ITA/Europa: differenza tra il rendimento settimanale della borsa italiana e quello delle borse europee, calcolato sugli indici FTSEMIB e Eurostoxx;
Spread ITA/GER: differenza tra i tassi di interesse italiani e tedeschi a 10 anni;
Spread EU/GER: differenza media tra i tassi di interesse dei principali paesi europei (Francia, Belgio, Spagna, Italia, Olanda) e quelli tedeschi a 10 anni;
Euro/dollaro: tasso di cambio euro/dollaro;
Spread US/GER 10Y: spread tra i tassi di interesse degli Stati Uniti e quelli tedeschi con scadenza 10 anni;
Prezzo Oro: quotazione dell’oro (in USD)
Spread 10Y/2Y Euro Swap Curve: differenza del tasso della curva EURO ZONE IRS 3M a 10Y e 2Y;
Euribor 6M: tasso euribor a 6 mesi.
I colori sono assegnati in un’ottica VaR: se il valore riportato è superiore (inferiore) al quantile al 15%, il colore utilizzato è l’arancione. Se il valore riportato è superiore (inferiore) al quantile al 5% il colore utilizzato è il rosso. La banda (verso l’alto o verso il basso) viene selezionata, a seconda dell’indicatore, nella direzione dell’instabilità del mercato. I quantili vengono ricostruiti prendendo la serie storica di un anno di osservazioni: ad esempio, un valore in una casella rossa significa che appartiene al 5% dei valori meno positivi riscontrati nell’ultimo anno. Per le prime tre voci della sezione “Politica Monetaria”, le bande per definire il colore sono simmetriche (valori in positivo e in negativo). I dati riportati provengono dal database Thomson Reuters. Infine, la tendenza mostra la dinamica in atto e viene rappresentata dalle frecce: ↑,↓, ↔ indicano rispettivamente miglioramento, peggioramento, stabilità rispetto alla rilevazione precedente.
Disclaimer: Le informazioni contenute in questa pagina sono esclusivamente a scopo informativo e per uso personale. Le informazioni possono essere modificate da finriskalert.it in qualsiasi momento e senza preavviso. Finriskalert.it non può fornire alcuna garanzia in merito all’affidabilità, completezza, esattezza ed attualità dei dati riportati e, pertanto, non assume alcuna responsabilità per qualsiasi danno legato all’uso, proprio o improprio delle informazioni contenute in questa pagina. I contenuti presenti in questa pagina non devono in alcun modo essere intesi come consigli finanziari, economici, giuridici, fiscali o di altra natura e nessuna decisione d’investimento o qualsiasi altra decisione deve essere presa unicamente sulla base di questi dati.
“This is more than a recovery plan. It is a once in a lifetime chance to emerge stronger from the pandemic, transform our economies, create opportunities and jobs for the Europe where we want to live. We have everything to make this happen”.
This is how Ursula von del Leyen, European Commission President, commented the political agreement at the July 2020 European Council that agreed on the guidelines around the NextGenerationEU (NGEU), the temporary €806.9m instrument designed to boost the recovery.
The structure of the NGEU
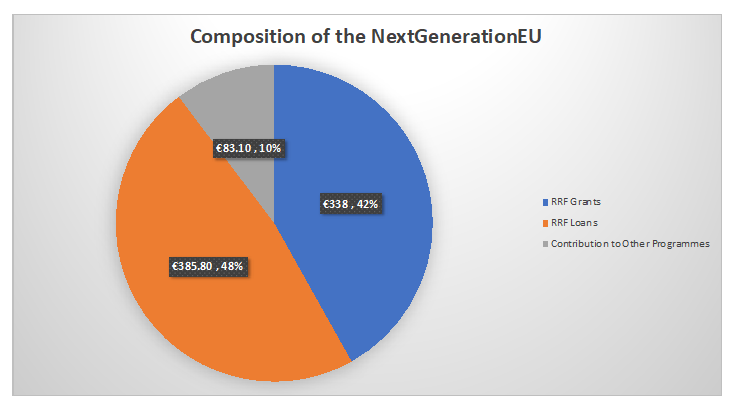
The NGEU is made of a number of different programmes, but its high level structure can be summarised as in the graph below:
The centrepiece of NGEU is the Recovery and Resilience Facility (RRF), an instrument for providing €723.8 billion to Member States to support reforms and investments to address the green and digital transitions with the aim of creating jobs and growth.
Part of the funds, €338.0bn, will be provided in form of grants. The remainder, €385.8bn, will be used to provide loans from the EU to individual Member States on favourable conditions, which will be repaid by those Member States.
The remaining components to the NGEU are totalling €83.1bn of grants and they include other centralised programmes like:
the REACTEU programme (€50.6bn) to help address the economic consequences of COVID-19 in the first years of the recovery
the Just Transition Fund (JTF – €10.9bn) to guarantee that the transition to climate neutrality works for all
the European Agricultural Fund for Rural Development (€8.1bn), to further support farmers
InvestEU (€6.1bn), to support the investment efforts of the European businesses
Financing the NGEU
To finance the NGEU, the European Commission will borrow funds on the capital markets for up to around €800 billion between June 2021 and end-2026 for an average of roughly €150bn of new funding per year.
Such a significant amount of borrowing will make the European Union the biggest super-national debt issuer and as such it will require a step up of the debt management to a level comparable to the ones of big countries. For this reason, a diversified funding strategy has been defined which will make use of both long term EU-bonds (maturity greater than 3 years) and short term EU-bills (maturity below 1 year) issued either through syndication (i.e. the Commission works directly with a group of underwriters) or open market auctions.
The precise targets of such a diversified funding strategy will be defined through an annual borrowing decision and more detailed semi-annual funding plans.
On the 4th of June 2021 the Commission published the first funding plan for the NGEU. The main points of the plan are the following:
The total notional issued for 2021 will be around €80bn.
Short term EU-bills will start to be auctioned starting from September 2021
After that, the Commission will be issuing in general one syndication and one auction per month
In the table below we can see that €45bn (slightly more than 50%) have been already issued between June and July 2021 thanks to very successful syndicated transactions (weighted average bid-to-ask ratio around 10)
The level of yields offered justifies the public interest into these issuances: they in fact offer a material spread over the Bund yield for a AAA counterparty like the European Commission is.
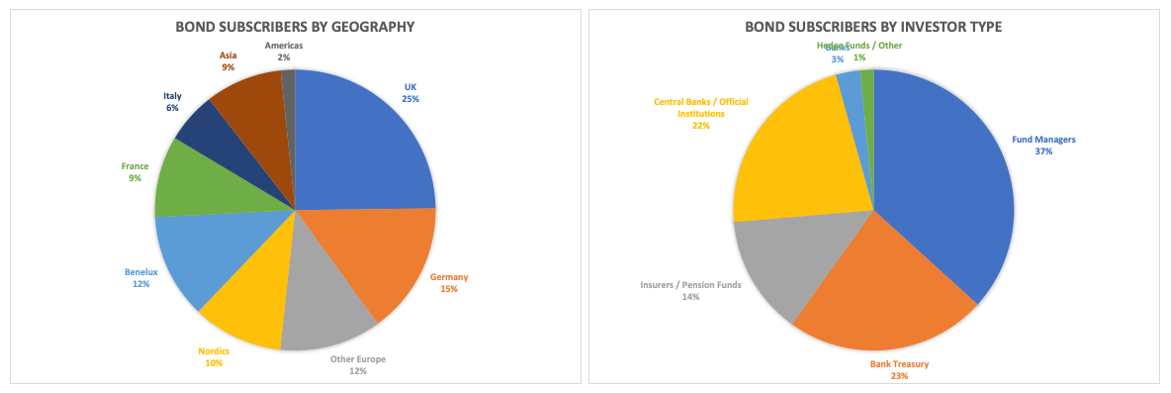
Requests have been received mostly from UK and Europe and from banks and fund managers, as we show in the pie charts below that look at the notional issued weighted average information for the four transactions above.
Distributing the financial support to the Member States
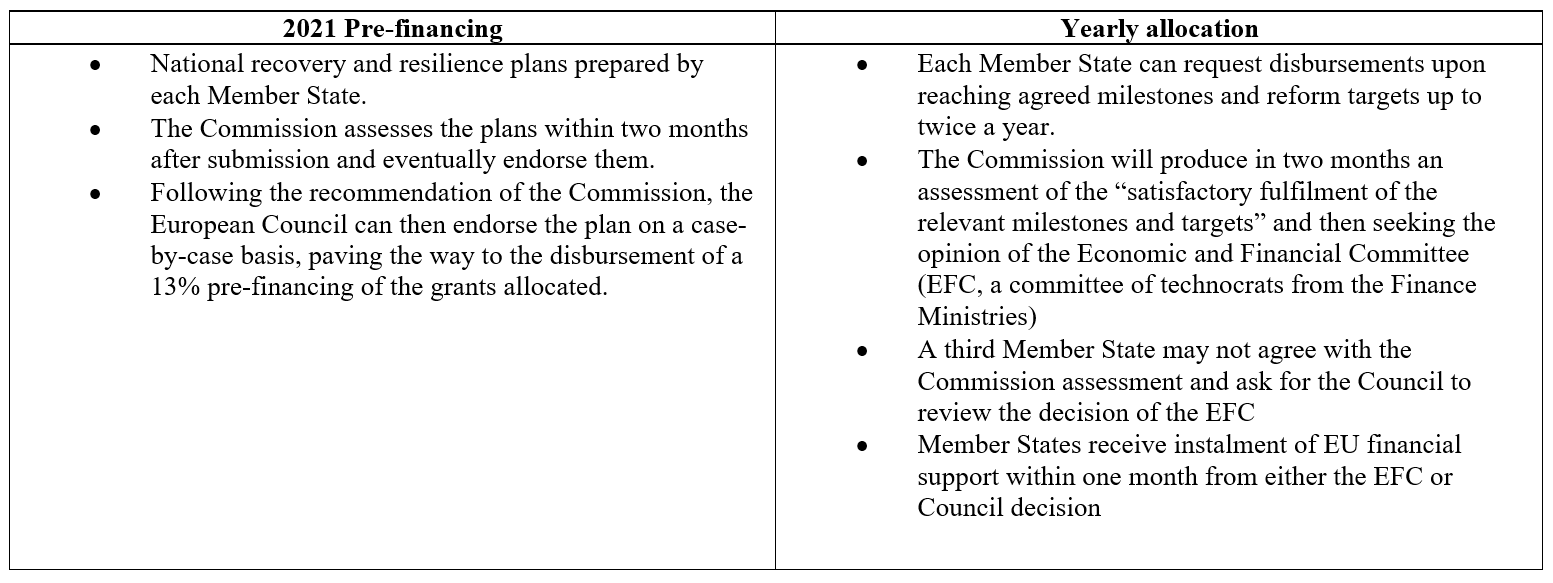
The RRF funding are distributed according to a very precise process which can be divided in two macro stages:
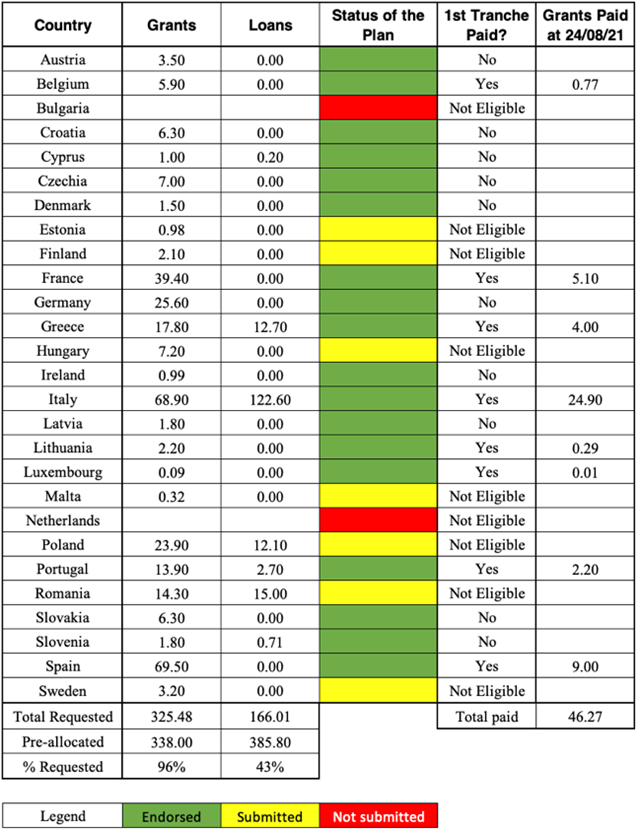
As of the end of August, we can notice a quite scattered and diversified status among different Member States:
Almost all the Member States (26 out 27) have submitted a Recovery and Resilience Plan. The Netherlands, in particular, is still not submitting a recovery plan until a new government is in place.
Out of the 26 plans only 18 have been fully endorsed by the European Commission and 16 of these from the Council as well.
So far only 7 countries have requested loans and of these only 3 (Greece, Italy and Romania) have requested the full amount available. According to Article 14 of the RFR Regulation, countries can request loan support until the 31st of August 2023, so more countries may do so in the future.
The first tranche of prepayment (13% of the total amount required) has been paid so far only to 8 out of all the Member States that have seen their plan approved by both the Commission and the Council: Belgium, France, Greece, Italy, Lithuania, Luxembourg, Spain and Portugal. The amount disbursed so far coincides almost perfectly with the funding as described in the previous section (€46.27bn vs €45bn)
Table 1 – RRF requests, endorsement and pre-payment status
Some details are still not publicly available, like whether the prepayment of the loan part has been disbursed as an actual loan and what the characteristics of such an eventual loan would be.
When we analysed the SURE program in a previous article we calculated the amounts saved by each Member State comparing the yields of the back-to-back loans with the level of public debt available on the secondary market for the same maturity.
An exact comparison is much more difficult because the information on the Commission to Member States loans are still not public and because the grants component doesn’t allow to have an equivalent funding strategy to compare with. To calculate an estimate of the financial impact from receiving the 1st tranche we will hence assume that:
Member States would issue debt on the secondary market at the prevailing rate on the day when the 1st tranche has been disbursed.
The duration mix of the debt issuance is the same as the European Commission funding as depicted in the previous section. This assumption is quite strong as the average maturity of the EU funding is 14 years, well above the average duration of the Italian debt which is around 7 years
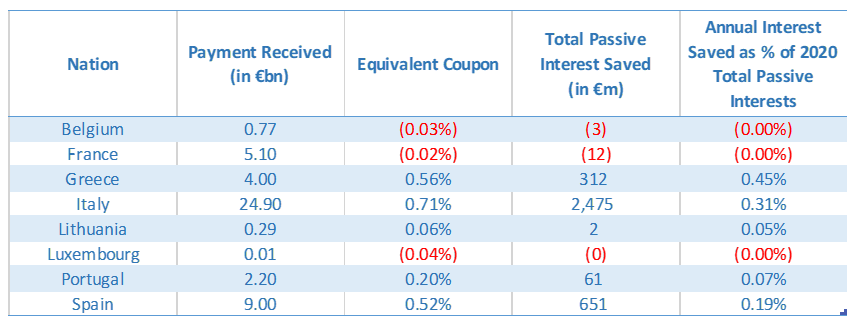
Based on these two assumptions we calculated an “equivalent coupon” at which each country would finance on the market. The results of the analysis are in the following table:
A few comments on the results:
The countries that benefit the most of the financial conditions attached to the NGEU are Greece, Italy and Spain who will save the highest share of the 2020 passive interests amount if they had to go on the market and finance the same amount received
The more core countries like Belgium, France and Luxembourg don’t see a particular benefit nor a significant loss from receiving the grants
From this analysis it looks like the NGEU is starting to deliver on the many promises were made in 2020: it is in fact proving to be a pragmatic way for the European Commission to force Member States to budget for long needed reforms and investments while financially supporting them, especially those paying the highest level of interest on sovereign debt not penalising the core ones at the same time.
Il tema della bankinsurance è da tempo al centro dell’attenzione dell’Istituto anche perché è rappresentativo di un legame che, in Italia, è presente nella stessa governance di IVASS, dove troviamo integrata, dopo la riforma del 2012, la Vigilanza assicurativa nella Vigilanza bancaria…
Nell’ipotesi di società che detengono partecipazioni in compagini operative, la mancanza di reddito derivante dalla volontà della partecipata di non distribuire i dividendi si configura come situazione oggettiva non imputabile alla contribuente, situazione che impedisce il conseguimento dei ricavi…
Questo sito utilizza cookie tecnici e di profilazione, propri e di terze parti, per garantire la corretta navigazione, analizzare il traffico e misurare l'efficacia delle attività di comunicazione.
Questo sito Web utilizza i cookie per migliorarne l'esperienza di navigazione. I cookie classificati come necessari, sono essenziali alle funzioni di base sito e vengono sempre memorizzati nel tuo browser. I cookie di terze parti, che ci aiutano ad analizzare e capire come utilizzi questo sito, vengono memorizzati nel tuo browser solo con il tuo consenso. Di seguito hai la possibilità di disattivare questi cookie. Tieni in conto che la disattivazione di alcuni di questi cookie potrebbe influire sulla tua esperienza di navigazione.
Necessary cookies are absolutely essential for the website to function properly. These cookies ensure basic functionalities and security features of the website, anonymously.
Cookie
Durata
Descrizione
cookielawinfo-checkbox-analytics
1 year
Cookie tecnico impostato dal plugin GDPR Cookie Consent che viene utilizzato per registrare il consenso dell'utente per i cookie nella categoria "Analitici".
cookielawinfo-checkbox-necessary
1 year
Cookie tecnico impostato dal plugin GDPR Cookie Consent che viene utilizzato per registrare il consenso dell'utente ai cookie.
CookieLawInfoConsent
1 year
Cookie tecnico impostato dal plugin GDPR Cookie Consent per salvare le scelte si/no dell'utente per ciascuna categoria.
viewed_cookie_policy
1 year
Cookie tecnico impostato dal plugin GDPR Cookie Consent che registra lo stato del pulsante predefinito della categoria corrispondente.
Analytical cookies are used to understand how visitors interact with the website. These cookies help provide information on metrics the number of visitors, bounce rate, traffic source, etc.
Cookie
Durata
Descrizione
_pk_id.gV3j99y0AE.0928
1 year 27 days
Cookie analitico impostato da Matomo e utilizzato per memorizzare alcuni dettagli sull'utente come l'ID univoco del visitatore
_pk_ses.gV3j99y0AE.0928
30 minutes
Cookie analitico impostato da Matomo di breve durata e utilizzato per memorizzare temporaneamente i dati della visita