Il 31 maggio alle ore 10.30 il Governatore Ignazio Visco presenta le Considerazioni finali in occasione della diffusione della Relazione annuale sul 2020…
Mag
29
2021
Il 31 maggio alle ore 10.30 il Governatore Ignazio Visco presenta le Considerazioni finali in occasione della diffusione della Relazione annuale sul 2020…
The European Securities and Markets Authority (ESMA), the EU’s securities markets regulator, today launched a consultation on amendments to its Guidelines on data transfer between Trade Repositories (TRs) under EMIR…
Circle now hodls the record for receiving the biggest investment round taken in by a crypto entity…
The flagship cryptocurrency faces a higher profit-taking sentiment near its 200-day simple moving average wave…

L’iniziativa di Finriskalert.it “Il termometro dei mercati finanziari” vuole presentare un indicatore settimanale sul grado di turbolenza/tensione dei mercati finanziari, con particolare attenzione all’Italia.
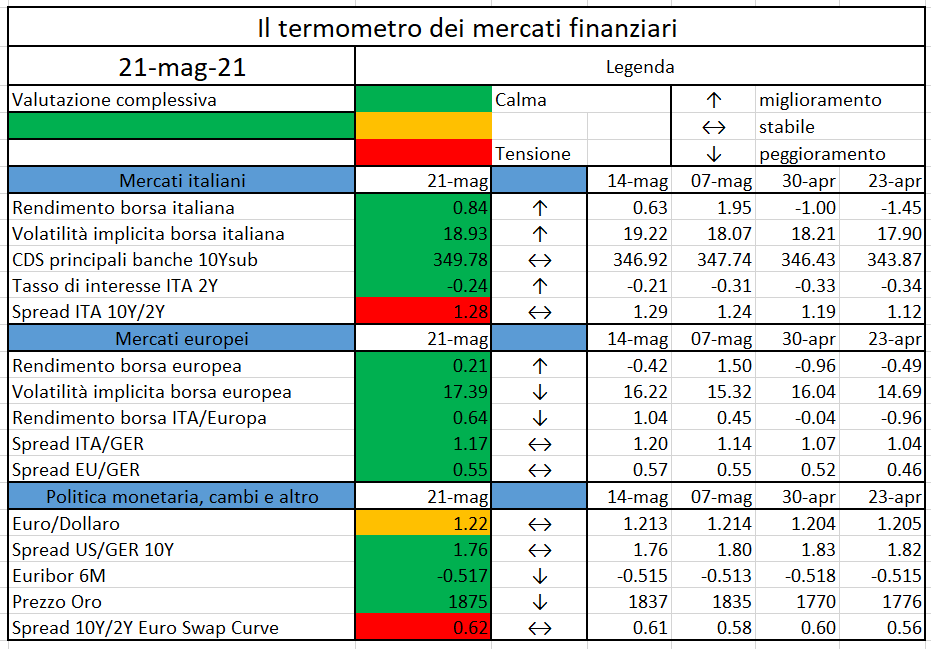
Significato degli indicatori
I colori sono assegnati in un’ottica VaR: se il valore riportato è superiore (inferiore) al quantile al 15%, il colore utilizzato è l’arancione. Se il valore riportato è superiore (inferiore) al quantile al 5% il colore utilizzato è il rosso. La banda (verso l’alto o verso il basso) viene selezionata, a seconda dell’indicatore, nella direzione dell’instabilità del mercato. I quantili vengono ricostruiti prendendo la serie storica di un anno di osservazioni: ad esempio, un valore in una casella rossa significa che appartiene al 5% dei valori meno positivi riscontrati nell’ultimo anno. Per le prime tre voci della sezione “Politica Monetaria”, le bande per definire il colore sono simmetriche (valori in positivo e in negativo). I dati riportati provengono dal database Thomson Reuters. Infine, la tendenza mostra la dinamica in atto e viene rappresentata dalle frecce: ↑,↓, ↔ indicano rispettivamente miglioramento, peggioramento, stabilità rispetto alla rilevazione precedente.
Disclaimer: Le informazioni contenute in questa pagina sono esclusivamente a scopo informativo e per uso personale. Le informazioni possono essere modificate da finriskalert.it in qualsiasi momento e senza preavviso. Finriskalert.it non può fornire alcuna garanzia in merito all’affidabilità, completezza, esattezza ed attualità dei dati riportati e, pertanto, non assume alcuna responsabilità per qualsiasi danno legato all’uso, proprio o improprio delle informazioni contenute in questa pagina. I contenuti presenti in questa pagina non devono in alcun modo essere intesi come consigli finanziari, economici, giuridici, fiscali o di altra natura e nessuna decisione d’investimento o qualsiasi altra decisione deve essere presa unicamente sulla base di questi dati.

The main purpose of this article is to analyze how institutions are preparing to FRTB framework, focusing on the challenges that they are facing especially in terms of transformations. In particular, a key issue is due to the adverse systemic impact of COVID-19 on the EU banking sector, following which the Regulator endorsed a set of measures to provide additional operational capacity for banks and supervisors to respond to the immediate financial stability priorities.
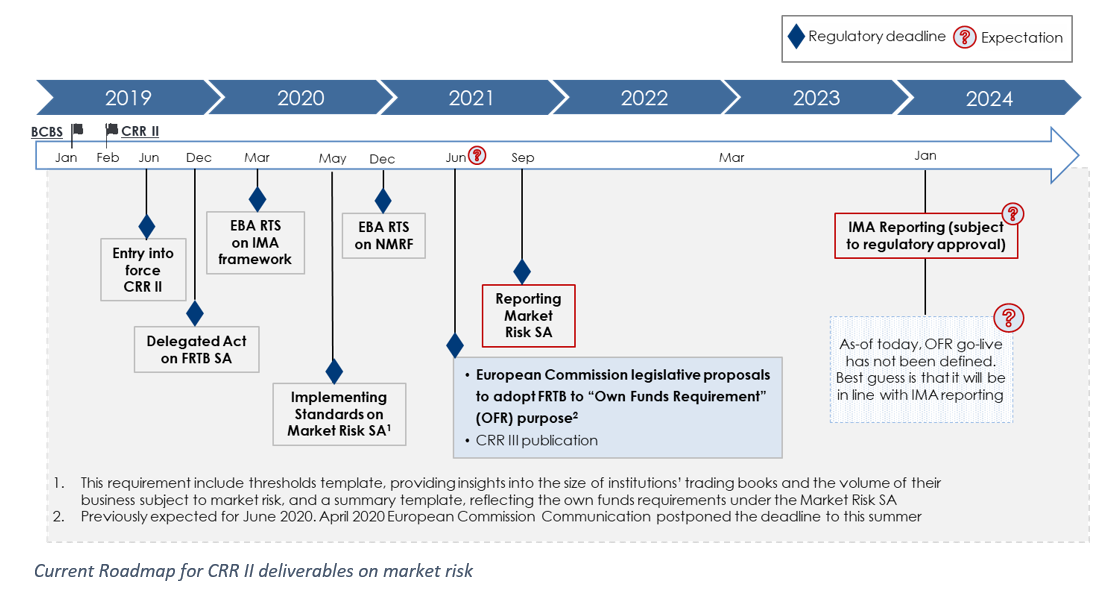
In the first section, a brief overview on the major impacts that the recent outbreak has had on the implementation timeline is presented. In particular the main regulatory milestones have been postponed. Indeed, reporting for the FRTB figures according to Standardized Approach (SA) has been deferred to September 2021 as well as the go-live of FRTB Own Funds Requirements (OFR) is still unknown at this point in time: however, it should be clarified early this summer.
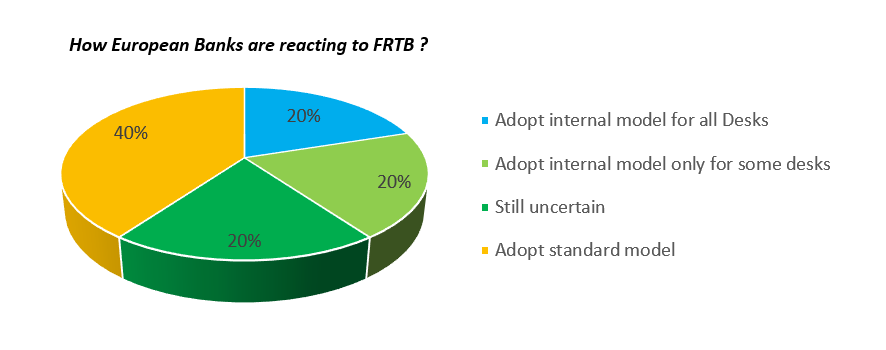
In the second section, focusing on reports and Questionnaires recently published by both GARP and ECB, the most relevant impacts on FRTB metrics and the intended scope of application are summarized. In particular, it has been shown that there is still not a uniform view among European Institutions on the approach to be pursued for the implementation: in fact, for the sample analyzed, about 40% of banks plans to turn off their internal models adopting only standard model, while another 40% is planning to adopt internal model (whose a 20% on the full perimeter of trading desk, whilst the other 20% only on some desks). The remained 20% of banks is still unsure on the model to adopt.
Finally in the third section a deep dive on Italian Market is reported. Indeed, in the recent years, Deloitte Consulting has supported some of the main Italian Banking Groups in the implementation of the new regulatory framework, providing solutions to adapt their businesses to the new regulation and to enhance their IT infrastructure. Based on a multi-year experience on the topic, some of the most impactful areas of concerns will be illustrated. Moreover, possible solutions that banks could evaluate for the enhancements will be proposed, considering pros and cons for each of them.
The ongoing market shocks caused by Coronavirus (COVID-19) pandemic has spot new challenges for Banking Industry. Indeed, since the recent outbreak, the Regulator published supervisory measures, aiming to soften the potential impact of turmoil on market RWA. These interventions implied some changes in the regulatory agenda, postponing the roadmap published by the EBA in June 2019 [1] in order to give banks additional time for both adapting to the new market risk framework and re-prioritize resources in the short term without falling behind in their FRTB development.
How has the ongoing pandemic changed banks’ project milestone?
However despite the absence of clear regulatory guidelines, banks have mostly continued along their pre-Covid paths.
Following these considerations, the expected regulatory timeline should be the following.
A point of concern already raised by the Industry is related to the postponement of regulatory deadlines with significant impact on institutions’ IT infrastructure for the parallel running, which should be performed at least until go-live for OFR.
However, it is worth to highlight that, despite the aforementioned postponements, some regulatory updates have been issued during the last year. In March 2020, EBA published its final draft RTS [4] on the new IMA under the FRTB that conclude the first phase of the EBA roadmap.
These final draft technical standards cover 11 mandates and have been grouped in three different documents:
Another topic addressed during 2020 is related to the capitalization of Non-Modellable Risk Factors, which has always been a point of concern. In particular, on December 2020, EBA published a Regulatory Technical Standard [5] which lays down a specific methodology that institutions have to use for determining the own funds requirements related to NMRF in the new market risk regime. In a nutshell, main sources of innovations of this Regulations are related to:
The methodology set out in these draft RTS ensures a level playing field among credit institutions in the Union on a key component for determining own funds requirements for market risk. They also provide legal certainty on how the level of own funds requirements for NMRFs should be determined. With this publication, a significant milestone is reached towards the implementation of the FRTB standards in the EU.
Banking Industry is still doing a lot of considerations on FRTB Regulation, since the impact of FRTB capital charge is still consistently higher that the current one. According to results published from Industry FRTB QIS Analysis on December 2019 [7][i], the trend of overall impact of FRTB rules[ii] application across QIS 8 – QIS 12 for a sample of 15 banks, shows how FRTB capital impact is still remarkable. It is reduced notably between QIS 10 and QIS 11, but QIS 12 results demonstrate that the FRTB capital requirements have continued to remain highly persistent to 2.09x with respect to Current Capital.
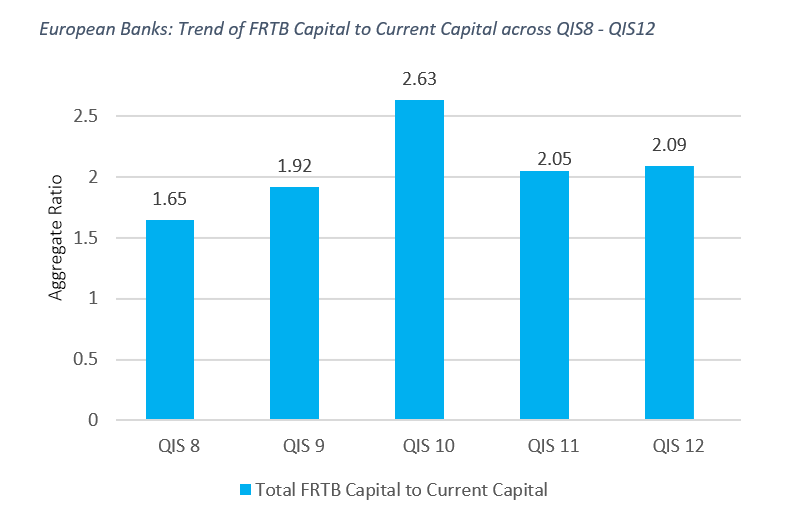
The trend analysis is built upon a sample of banks which have been normalized over past studies to provide a consistent time series. The FRTB capital reduced notably between QIS 10 and QIS 11, compared to total current capital, driven largely by the changes in NMRF capital charge rules, and to a lesser extent, due to adjustment of Sensitivity Based Method (SBM) risk weights for FX and IR risk classes.
With the current FRTB methodology, there is still not a uniform view among European Banks on the approach to be pursued for the implementation. Indeed, according to a survey published by the ECB in February 2020 [8][iii], about 40% of banks under its supervision plan to turn off their internal models adopting only standard model, whilst another 40% is planning to adopt internal model (whose a 20% on the full perimeter of trading desk, whilst the other 20% only on some specific desks). The remained 20% of banks is still unsure on the model to adopt.
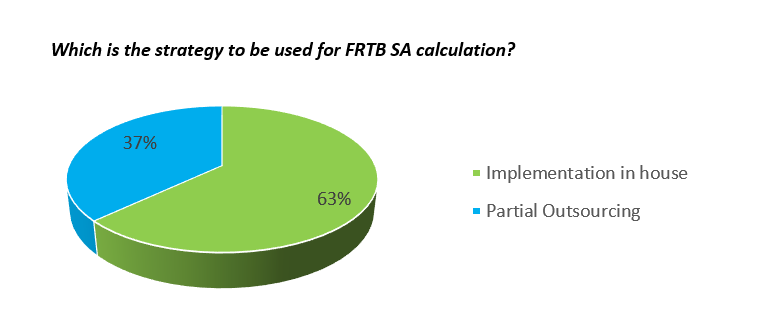
In August 2020 ECBS Supervisory Authority shared a new questionnaire [9] to European Banks in order to verify potential impacts on FRTB SA model after Covid-19 outbreak. There is a remarkable difference between, from one hand, banks using the current internal models approach (typically large banks) and, on the other hand, banks using the current standardized approach (typically small banks). The former have made significantly more progress than the latter, probably because they have a more sophisticated infrastructure and wider resources. Feedbacks from some smaller and medium-sized directly supervised banks show that they may face some issues. 15% of these banks reported to have made negligible progresses implementing the new rules. Furthermore, 10% already admit facing delays in meeting the 2021 reporting requirement, which would not be acceptable from a supervisory perspective. Banks do not plan to outsource the calculation of the FRTB SA capital requirement to any significant extent. 63% decided to carry out their FRTB SA calculations entirely in house, while 37% plan to outsource only some specific elements.
Therefore, how are Italian Banks reacting to the implementation of the new market risk framework?
According to the experience conducted from Deloitte Consulting on major Italian Banking Groups, several challenges have been faced during FRTB development. Some of them have been exploited during the methodological adjustments required from Regulation. Indeed, in order to be fully in line with requirements, important activities have been conducted both in terms of analysis on best solution for new metrics computation (according to Banks operative systems already in place) and in terms of monitoring the trend of the metrics for the evaluation of their impacts on banks operations. Deeping the methodological framework, the main metrics implementation can be summarized in the following list.
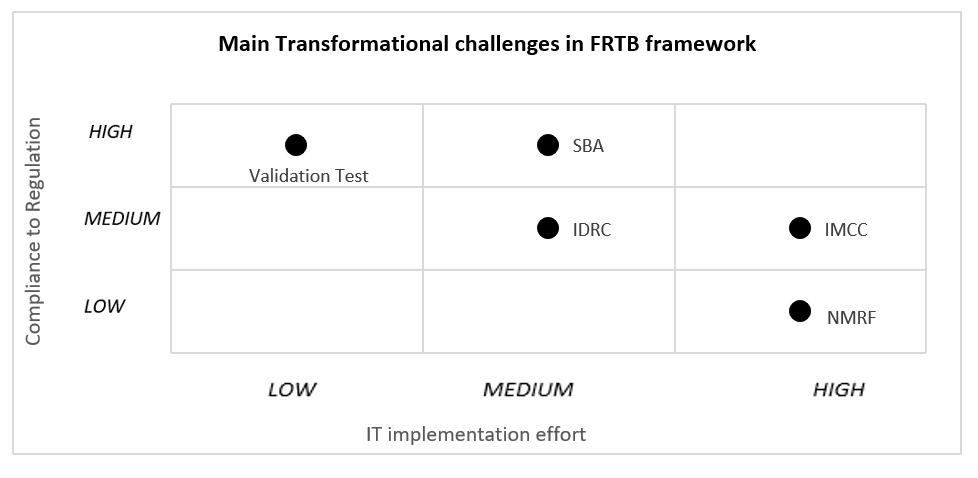
The scatter plot on the main methodological challenges in FRTB development shows how Italian Banks are aligned with regulation in terms of metric computation (axis Y) also based on new RTS of 2020, and what has been the effort for their implementation (axis X), considering as main drivers the following: hardware enhancements, methodological computation and aggregation data logic, perimeter of revaluation, and data storage capacity.
For each variable, three qualitative score levels are assigned to each area of impact (Low, Medium, High) where low effort and low compliance indicate respectively that IT system enhancements have not been so challenging as others, and many open points have still to be clarified before reaching the full compliance to regulation. On the other hand, high effort and high compliance indicate respectively that the implementation has been very difficult to finalize or still to be finalized, and minor points or no points have to be clarified from Banking Authority for the adequacy to regulation.
As can be observed in the chart, the new regulatory framework sets challenges both on SA and IMA point of view.
With reference to the former, the computation of all sensitivities based on buckets and all risk indicators (Delta, Vega, and Curvature) has determined an increase of IT systems performance for the huge amount of data to be collected and aggregated. Nevertheless the FRTB SA is more compliant to Regulation, as expected, due to the fact that reporting phase of standard model will start in the next months.
On the other side, with regard to Internal Model Approach, there are lot of open points still debated in the Industry. According to experience gained in supporting Italian Banking Groups on FRTB development, it is possible to identify some of the most impacting areas in terms of both business model organization and IT system solutions, proposing also different approaches that could be pursued. The main area of impact for implementation can be classified as follows:
The FRTB presents a fundamental change in the market risk framework. The model approval process will be broader and more complex than under the current rules, with significant technical standards and system developments which should be still released. To this purpose, Industry has identified key points of concern about the model approval strategy:
Therefore, an engagement flexibility could ensure that there is sufficient time to carry it out. Finally it is worth to highlight the importance of ensuring sufficient flexibility in the capital requirements implementation timeline, in order to ensure synchronized developments across key jurisdictions.
Since FRTB requires controls at desk-level, beyond at firm-wide level, determine the perimeter of asset class/instruments traded from each desk becomes fundamental, also to identify the granularity of bank’s portfolio. Moreover, considering that some asset classes could be more punitive in terms of capital requirement, it is crucial to identify the best strategy to adopt in order to maximize the profitability of the bank. The key points to be evaluated for the definition of trading desk structure can be summarized as follows:
The definition of trading desk structure is not the only point to be considered for the business organization. Taking into account the high complexity of FRTB framework, it is needed to create more interaction among banking functions, in particular:
Thanks to these considerations, which are the IT impacts?
Banks must be ready to support all the requests that will arise from implementation of FRTB, and this is feasible only with a well-structured IT architecture and with all integrated systems able to interact one with each other.
Based on Deloitte Consulting experience on Italian Banks, the most adopted solution for IT Systems interaction is a “Centralized solution”, where positions/transactions collected from front offices are fed into a central risk engine for the calculation and aggregation of risk metrics. This model uses a separate set of pricing models within the risk engine, which may or may not be fully aligned with the front office pricing models. Adopting a centralized solution, different approaches might be carried out:
1- The in house development of a risk engine that re-price all positions in scope; in this way all positions from Front offices are re-priced and then all metrics are computed and aggregated following FRTB standard. This solution could be less expensive in terms of cost and be more customized but could require more effort in terms of implementation, especially to ensure that the engine runs sufficiently fast to support the FRTB calculations; with the right trade-off, this can result the more suitable solution.
2- Sign a contractual agreement with an external professional business that provides revaluation services for all trades in scope of the bank. This solution reduces consistently the effort of IT implementation, but the cost of these contracts is remarkable.
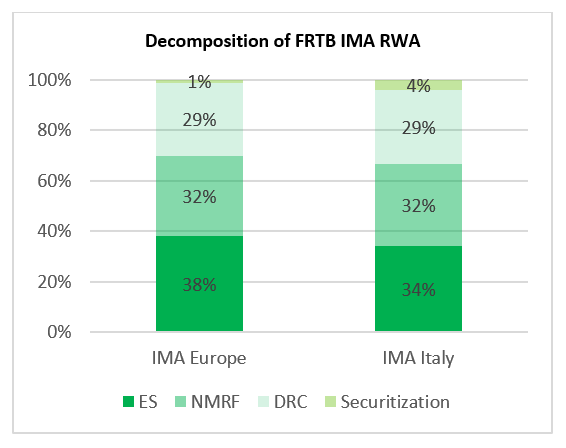
From Deloitte Consulting analysis as of December 2019 on Italian Banks data, the composition of FRTB IMA Risk Weighted Assets (RWA) is similar to that estimated as a part of Industry 2019 QIS study. The graph presents a summary of FRTB IMA RWA decomposition across ES, NMRF, DRC and Securitization. The consistent results also demonstrate that NMRF is a key driver of the high FRTB IMA capital, since it is still too punitive in terms of requirements. Comparing to QIS, where NMRF capital charge is 84% of the ES, on Italian Banks NMRF seems to be still to impacting, being 101% of ES.
Banks that implement internal model have to consider also the effect on desks of P&L and Back-test results, since in case desks do not pass test, they will be capitalized under the standard model, which will be more punitive in terms of capital charge, reducing also their profitability.
The implementation of P&L for Backtesting and PLA test metrics requires that IT systems have a high data storage capacity at disposal in order to store at least one-year observations (250) for all positions of trading desk in scope, and also a consistent computational power to compute, aggregate and visualize all the metrics in reasonable times. For banks that decide to adopt internal model, one of the most difficult challenges could be to pass validation test for all trading desks.
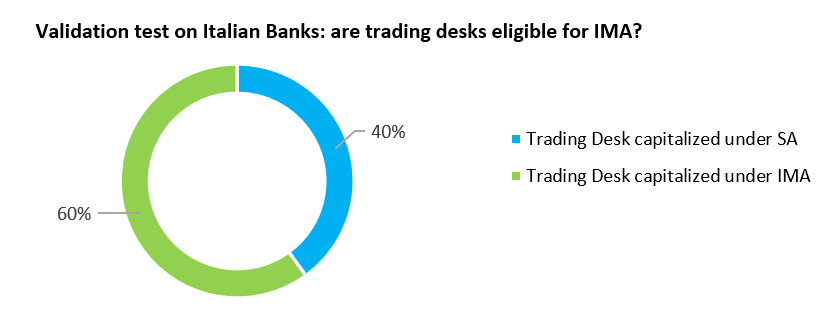
However, what is the Italian Banks expectation? Are their trading desks already eligible to be capitalized under FRTB internal model? From last analysis conducted from Deloitte Consulting, there is still a not negligible percentage of desks that does not pass P&L test, and must be capitalized under standard model.
So how could trading desk re-organize portfolios in order to be eligible for internal model? Considering the IT perspective, it could be useful to simulate movements of portfolio under desks in order to optimize the portfolio composition and the trading desk structure. This solution could give banks the possibility to evaluate faster change in business organization without potential negative effects on daily operativity.
First of all, it is worth to highlight that one of the main challenges which is still debated within the Industry is the definition and enhancement of Non-Modellable Risk Factor framework. Indeed, since EBA published the final version of RTS on 17th December 2020, the implementation is still very challenging to be completed, especially both under operative perspective (since it is required to re-evaluate a different stress period for each asset class) and in terms of capital charge to be absorbed. In fact the capital requirement for non-modellable risk factor is not as marginal as expected (according to Global QIS survey, it is the 84% in average of capital requirement set aside for modellable risk factor). As a consequence also the developments are still opened, and they bring consistent impacts on capital charge computation.
Based on last Deloitte Consulting analysis conducted on Italian Banks supported in FRTB implementation, roughly 55% of Italian Banks current sample of Risk Factors is Non-Modellable under the final FRTB rules. In addition, the impact of risk factors on Non-Modellable capital charge split by asset class has some differences if compared with the European average in terms of size of impact. For Italian Banks Interest Rates and Equity are the most impacting asset classes on the charge, as for European Banks, but with a consistent increase of the size for Italian ones (around 57% and 27% respectively), compared to the European ones (36% and 20% respectively). On the other side, Commodity and FX are the less punitive asset classes on the charge as for the Italian Banks (4% both) as for the European ones, even if in Europe the size of impact on the charge is higher (13% and 10% respectively).
The graph shows the comparison between Italian and European banks in terms of contribution on NMRF charge for each asset class: bank’s expectation is that Non-Modellable risk factor will be the most contributor to the increase of capital charge.
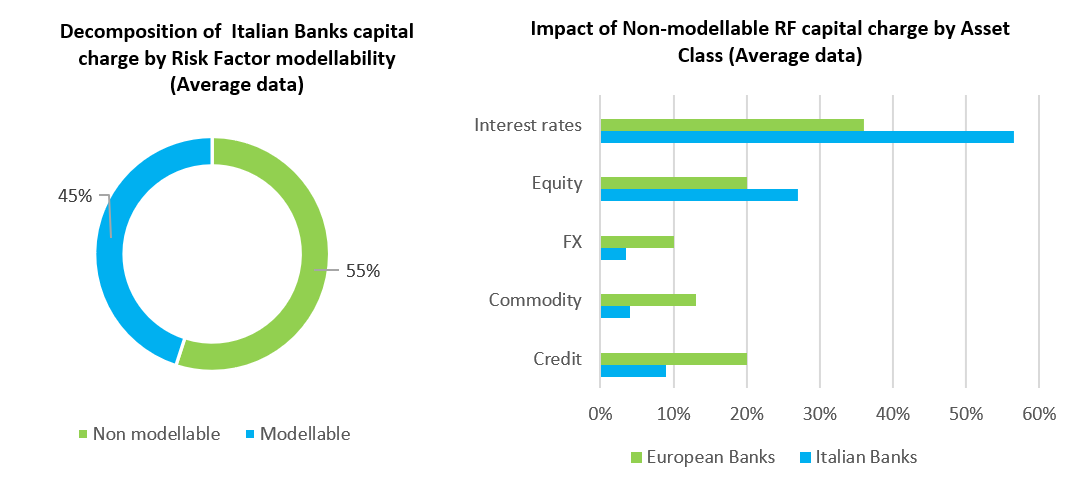
The higher impact respect to the other asset classes is caused especially by more structured instruments in bank’s portfolio, such as IRD, CCS or EQ Option. For Italian institutions, Commodity, FX and Credit Asset classes have a negligible impact on capital requirement. These results are partially shared with the main European Banks. Indeed, following Global Benchmarking initiative report (GBI) on a panel of 26 European banks, Commodity and FX asset classes have a marginal impact, as for Italian Banks; on the other hand, there is a more balanced result among all the other asset classes, in contrast with the impact in Italian Banks, where Equity and Credit are the most remarkable asset classes in terms of capital allocation for non-modellable risk factor.
Finally, also the identification of Risk Factor modellability perimeter requires an important computation effort and as a consequence consistent IT system reinforcements. To this purpose, based on the experience of Deloitte Consulting on Italian Banks, two different solutions on how delineate the non-modellability risk factor perimeter have been identified:
1- Implementation in house: the perimeter of modellability of risk factors in scope is identified only on modellability internal data set. If from one hand this solution could be cheaper in terms of cost, from the other hand there is the possibility to not have the full set of information needed to capture the full perimeter of risk factors. Many banks could face this type of risk, especially if their trading activities is based on a wide range of asset classes for which retrieving data from internal banking system could be more difficult (i.e. exotic options, IRD…)
2- Implementation in outsourcing: through acquisition of modellability flag from data, vendor banks receive a detailed report with non-modellable risk factors of all the asset classes in scope, which is for sure a clearer solution, but the cost of report from data vendor could be very expensive. In addition some institutions have decided to postpone the modellability flag acquisition from Data Vendor until the capital charge computation is not binding for OFR purpose
So what? A possible “hybrid” solution could be adopted, with the acquisition of modellability report only for specific asset classes for which internal data set is not sufficient, whilst for the other asset classes it could be useful a system development that collect internal modellability data. It is certain that also the effort of the implementation could be considered. Will banks be ready to move?
According to the new regulatory framework, institutions must have a separate internal model to measure the Default Risk Charge (DRC) of trading book positions: to this purpose, when using Internal Model to compute this measure, banks have to apply PD subject to a floor of 0.03%. However, the Industry considers the aforementioned floor is not risk sensitive and is expected to materially increase the capital requirements for holding highly rated (AAA/AA) sovereign and covered bonds. This could challenge the economics of market-making activities in these instruments, which can negatively impact liquidity and funding costs. This can in-turn have a spillover on portfolio composition, incentivizing banks in holding more risky assets, rather than a large volume of highly rated bonds. With respect to sovereigns, an application of a PD floor is inconsistent with the banking book IRBA treatment in the final Basel 3 revised framework. Indeed, CRE32.3 as detailed in “Calculation of RWA for credit risk” (CRE) article 32.3 “IRB Approach: risk components for each asset class- Risk components for corporate, sovereign, and bank exposure”, sovereigns are exempted from the PD floor.
Similarly, looking at their treatment within FRTB, i.e. DRC IMA vs DRC SA, there is also inconsistency. In the final FRTB text on DRC SA, claims on sovereigns, public sector entities and multilateral development banks may, at national discretion, be subject to a zero default risk weight – i.e. be exempted (article MAR22.7 in January 2019 FRTB text).
Deloitte Consulting experience on FRTB implementation shows that many challenges have to be faced when transforming the current operative model to the new one required from regulation, in terms of both business model definition and IT enhancements. Among all the areas involved by the new regulatory framework, it is worth to stress out that is important to clearly define the trading desk structure and its relative business strategy. Therefore it is fundamental the cooperation between Risk Management and Front Office departments since the aforementioned aspects could impact all the FRTB metrics (just think on – for example – modellability assessment and desks correlation) as well as Validation Test results to make trading desks eligible for IMA scope.
Similarly, under a Data Management point of view, the FRTB requires large amount of historical data as well as a greater need for analysis and burdensome computation against these data. Therefore well-structured and connected IT systems are fundamental in order to grant the revaluation of all positions of the perimeter in scope, especially for what concerns the modellability/non modellability perimeter. Focusing on the NMRF, with last December RTS the capacity of systems to re-evaluate, store and aggregate data for all the metrics become more challenging than the previous regulation. Closely related to this aspect, another point to be taken into account is the cost of parallel running, since after last RTS, it should be extended at least until go-live for OFR.
Last but not least, FRTB forces banks to re-think about make-or-buy options. Indeed, in the recent years, Data Providers start to offer infrastructure solutions, as well as features like front-office risk engines, aggregation and reporting systems, and Data Management solutions. With a wide variety of opportunities, institutions may evaluate their make-or-buy trade-offs, focusing on their operational efforts on areas where in-house approaches are preferable to ensure flexibility. However, due to the complexity of the new market risk framework and since the first reporting date is rather close, at this stage the buy-option becomes more attractive.
Contacts
Paolo Gianturco, Senior Partner, Deloitte Consulting, pgianturco@deloitte.it
Michael Zottarel, Manager, Deloitte Consulting, mzottarel@deloitte.it
Andrea Rodonò, Senior Consultant, Deloitte Consulting, arodono@deloitte.it
Valentino Caputo, Consultant, Deloitte Consulting, vcaputo@deloitte.it
Acknowledgements
Many thanks to Silvia Manera for the valuable contribution in writing the article.
References
[1] EBA – “EBA roadmap for the new market and counterparty credit risk approaches” – June 2019, https://www.eba.europa.eu
[2] Deloitte NSE – Gianturco, Manera, Zottarel, Rodonò, Bollato – “FRTB tra passato ed incertezza futura: a quando l’ultima puntata? Criticità e riflessioni” – June 2019, https://www.finriskalert.it
[3] Basel Committee on Banking Supervision – Press release “Governors and Heads of Supervision announce deferral of Basel III implementation to increase operational capacity of banks and supervisors to respond to Covid-19” – March 2020, https://www.bis.org
[4] EBA – “Draft technical standards on the IMA under the FRTB” – March 2021, https://www.eba.europa.eu
[5] EBA – “Final draft RTS on the calculation of stress scenario risk measure” – December 2020, https://www.eba.europa.eu/
[7] ISDA, GFMA, IIF – Industry FRTB QIS Analysis – December 2019
[8] ECB Banking Supervision – “Market risk: implementing new rules for internal models” – February 2020, https://www.bankingsupervision.europa.eu/
[9] ECB Banking Supervision – “Market risk: new reporting requirements to start in 2021” – August 2020, https://www.bankingsupervision.europa.eu/press/publications/newsletter/2020/html/ssm.nl200812_4.en.html
[i] Reported results are based on data submitted by 30 participating worldwide banks
[ii] Reported values take into account the aggregate capital requirement for market risk formula defined in January 2019 BCBS Final Text [MAR 33.43]
[iii] The sample of the analysis is represented by the 116 banks directly supervised by the ECB
Banca d’Italia together with the BIS Innovation Hub have launched the second edition of the G20 TechSprint, an international contest to search for innovative solutions…
L’articolo si sofferma sulla evoluzione della giurisprudenza in tema di Unione economica e monetaria (UEM) e sui contrasti fra Corte di giustizia e Bundesverfassungsgericht in relazione…
Institutional adoption is threatening Bitcoin’s revolutionary mission, says Ben Hunt, founder of Second Foundation Partners…
https://cointelegraph.com/news/has-wall-street-taken-over-bitcoin
Persistent struggles with high fees and network congestion have allowed layer-one solutions like Polkadot, Solana and Cosmos to become established competitors…
