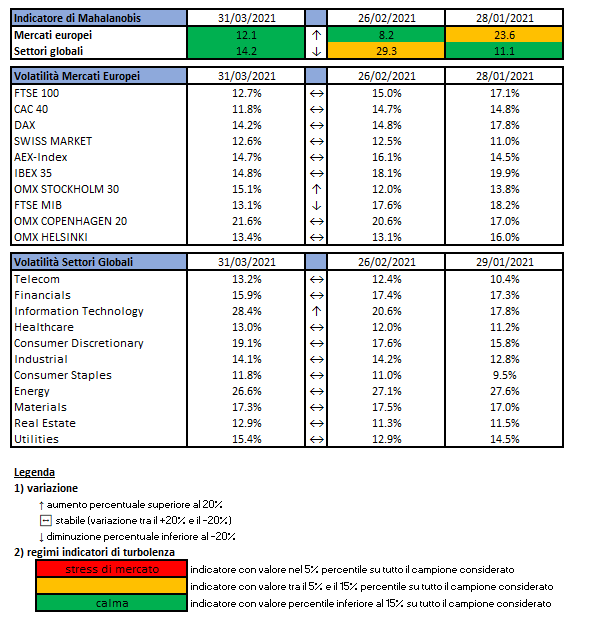
L’indicatore di Mahalanobis permette di evidenziare periodi di stress nei mercati finanziari. Si tratta di un indicatore che dipende dalle volatilità e dalle correlazioni di un particolare universo investimenti preso ad esame. Nello specifico ci siamo occupati dei mercati azionari europei e dei settori azionari globali.
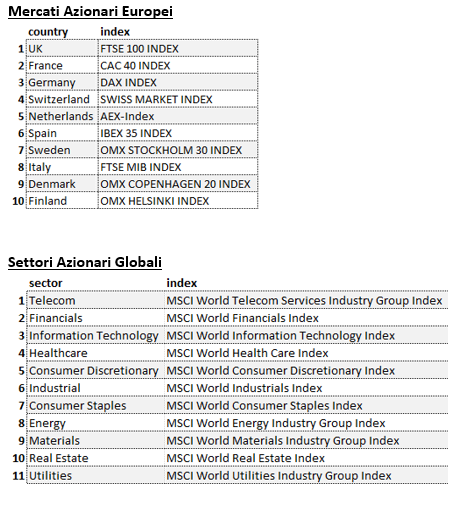
Gli indici utilizzati sono:
Le volatilità riportate sono storiche e calcolate sugli ultimi 30 trading days disponibili. Per ogni asset-class dunque sono prima calcolati i rendimenti logaritmici dei prezzi degli indici di riferimento, successivamente si procede col calcolo della deviazione standard dei rendimenti, ed infine si procede a moltiplicare la deviazione standard per il fattore di annualizzazione.
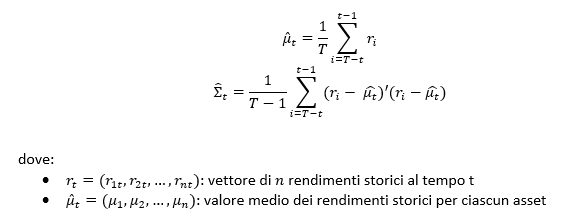
Per il calcolo della distanza di Mahalnobis si procede dapprima con la stima della matrice di covarianza tra le asset-class. Si considera l’approccio delle finestre mobili. Come con la volatilità, si procede prima con il calcolo dei rendimenti logaritmici e poi con la stima storica della matrice di covarianza, come riportato di seguito.
Supponendo una finestra mobile di T periodi, viene calcolato il valore medio e la matrice varianza covarianza al tempo t come segue:
La distanza di Mahalanobis è definita formalmente come:
Le parametrizzazioni che sono state scelte sono:
Rilevazioni mensili
Tempo T della finestra mobile pari a 5 anni (60 osservazioni mensili)
Le statistiche percentili sono state calcolate a partire dalla distribuzione dell’indicatore di Mahalanobis dal Dicembre 1997 al Dicembre 2019 su rilevazioni mensili.
Disclaimer: Le informazioni contenute in questa pagina sono esclusivamente a scopo informativo e per uso personale. Le informazioni possono essere modificate da finriskalert.it in qualsiasi momento e senza preavviso. Finriskalert.it non può fornire alcuna garanzia in merito all’affidabilità, completezza, esattezza ed attualità dei dati riportati e, pertanto, non assume alcuna responsabilità per qualsiasi danno legato all’uso, proprio o improprio delle informazioni contenute in questa pagina. I contenuti presenti in questa pagina non devono in alcun modo essere intesi come consigli finanziari, economici, giuridici, fiscali o di altra natura e nessuna decisione d’investimento o qualsiasi altra decisione deve essere presa unicamente sulla base di questi dati.
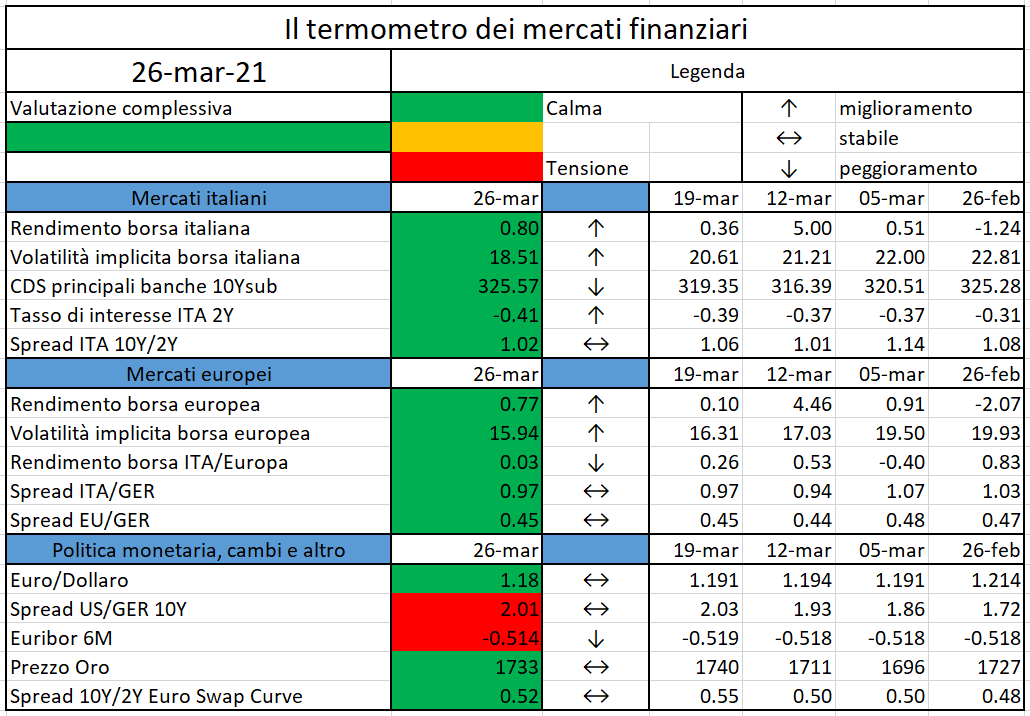
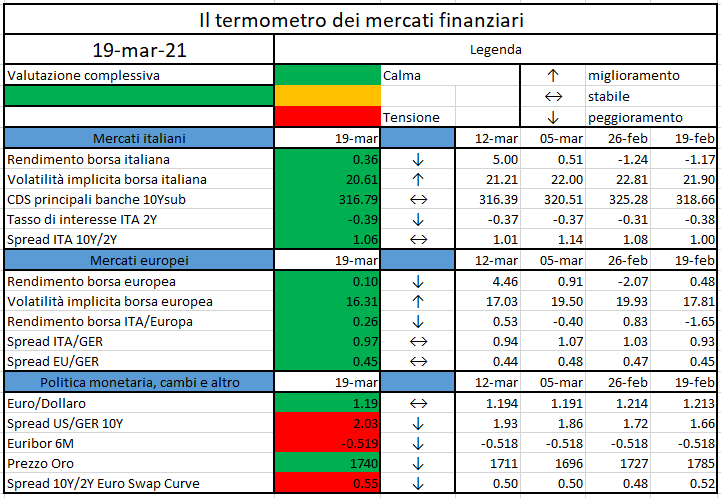
L’iniziativa di Finriskalert.it “Il termometro dei mercati finanziari” vuole presentare un indicatore settimanale sul grado di turbolenza/tensione dei mercati finanziari, con particolare attenzione all’Italia.
Significato degli indicatori
Rendimento borsa italiana: rendimento settimanale dell’indice della borsa italiana FTSEMIB;
Volatilità implicita borsa italiana: volatilità implicita calcolata considerando le opzioni at-the-money sul FTSEMIB a 3 mesi;
Future borsa italiana: valore del future sul FTSEMIB;
CDS principali banche 10Ysub: CDS medio delle obbligazioni subordinate a 10 anni delle principali banche italiane (Unicredit, Intesa San Paolo, MPS, Banco BPM);
Tasso di interesse ITA 2Y: tasso di interesse costruito sulla curva dei BTP con scadenza a due anni;
Spread ITA 10Y/2Y : differenza del tasso di interesse dei BTP a 10 anni e a 2 anni;
Rendimento borsa europea: rendimento settimanale dell’indice delle borse europee Eurostoxx;
Volatilità implicita borsa europea: volatilità implicita calcolata sulle opzioni at-the-money sull’indice Eurostoxx a scadenza 3 mesi;
Rendimento borsa ITA/Europa: differenza tra il rendimento settimanale della borsa italiana e quello delle borse europee, calcolato sugli indici FTSEMIB e Eurostoxx;
Spread ITA/GER: differenza tra i tassi di interesse italiani e tedeschi a 10 anni;
Spread EU/GER: differenza media tra i tassi di interesse dei principali paesi europei (Francia, Belgio, Spagna, Italia, Olanda) e quelli tedeschi a 10 anni;
Euro/dollaro: tasso di cambio euro/dollaro;
Spread US/GER 10Y: spread tra i tassi di interesse degli Stati Uniti e quelli tedeschi con scadenza 10 anni;
Prezzo Oro: quotazione dell’oro (in USD)
Spread 10Y/2Y Euro Swap Curve: differenza del tasso della curva EURO ZONE IRS 3M a 10Y e 2Y;
Euribor 6M: tasso euribor a 6 mesi.
I colori sono assegnati in un’ottica VaR: se il valore riportato è superiore (inferiore) al quantile al 15%, il colore utilizzato è l’arancione. Se il valore riportato è superiore (inferiore) al quantile al 5% il colore utilizzato è il rosso. La banda (verso l’alto o verso il basso) viene selezionata, a seconda dell’indicatore, nella direzione dell’instabilità del mercato. I quantili vengono ricostruiti prendendo la serie storica di un anno di osservazioni: ad esempio, un valore in una casella rossa significa che appartiene al 5% dei valori meno positivi riscontrati nell’ultimo anno. Per le prime tre voci della sezione “Politica Monetaria”, le bande per definire il colore sono simmetriche (valori in positivo e in negativo). I dati riportati provengono dal database Thomson Reuters. Infine, la tendenza mostra la dinamica in atto e viene rappresentata dalle frecce: ↑,↓, ↔ indicano rispettivamente miglioramento, peggioramento, stabilità rispetto alla rilevazione precedente.
Disclaimer: Le informazioni contenute in questa pagina sono esclusivamente a scopo informativo e per uso personale. Le informazioni possono essere modificate da finriskalert.it in qualsiasi momento e senza preavviso. Finriskalert.it non può fornire alcuna garanzia in merito all’affidabilità, completezza, esattezza ed attualità dei dati riportati e, pertanto, non assume alcuna responsabilità per qualsiasi danno legato all’uso, proprio o improprio delle informazioni contenute in questa pagina. I contenuti presenti in questa pagina non devono in alcun modo essere intesi come consigli finanziari, economici, giuridici, fiscali o di altra natura e nessuna decisione d’investimento o qualsiasi altra decisione deve essere presa unicamente sulla base di questi dati.
Esattamente un anno fa l’Italia, da lì a breve seguita da tutti gli altri Paesi europei, entrava in un lockdown per cercare di arrestare una pandemia che, oltre a causare migliaia di decessi, ha generato danni all’economia mai visti negli ultimi decenni. Interi comparti produttivi, fra cui alcuni vitali per l’Italia come il turismo, hanno visto da un giorno all’altro azzerarsi i propri introiti, pur dovendo far fronte ai costi fissi e ad altri oneri. Numerosi sono stati i provvedimenti che hanno cercato di ‘tamponare’ la situazione attraverso trasferimenti statali, moratorie dei prestiti, garanzie pubbliche, in gran parte ancora in vigore.
Il tema del credito alle PMI è chiaramente al centro dell’attenzione in questa situazione. Da una parte la possibilità per le aziende di avere sostegno finanziario è stata una richiesta dominante nei mesi passati, ma dall’altra appena nei prossimi mesi verranno pubblicati i bilanci del 2020 molti si chiederanno se i debiti contratti dalle aziende potranno essere onorati.
Una fonte di finanziamento per le PMI che negli ultimi anni si è ricavata uno spazio non trascurabile è quella dei minibond, ovvero obbligazioni e titoli di debito emessi per raccogliere denaro sul mercato mobiliare. Essi rappresentano una forma di finanziamento alternativa e complementare al credito bancario per diversificare le fonti e accedere al mercato competitivo degli investitori professionali, in preparazione (come se fosse un ‘allenamento’) a successive operazioni più complesse come possono essere il private equity o la quotazione in Borsa. Sono numerose inoltre le piccole aziende che, pur avendo accesso al credito bancario, vogliono sperimentare i minibond per acquisire competenze nuove rispetto al mercato del capitale e ottenere un effetto di ‘certificazione’ e di ‘legittimazione’. Questo mercato è studiato ormai da tempo dall’Osservatorio Minibond del Politecnico di Milano, che pochi giorni fa ha presentato il suo nuovo Report annuale.
Apparentemente l’ecosistema sembra avere retto: il numero delle emissioni è leggermente sceso (ma più che altro nel primo semestre 2020), il flusso della raccolta è il più basso degli ultimi 4 anni (ma non di molto). Grazie a progetti mirati come i ‘basket bond’ regionali, è rimasto significativo il numero delle ‘nuove’ PMI emittenti che, proprio nell’annus horribilis, si sono affacciate per la prima volta sul mercato del capitale. Ciò è avvenuto anche grazie agli interventi emergenziali attuati dallo Stato, che si sono concretizzati in un programma di garanzie pubbliche che ha interessato anche il mondo dei minibond, attraverso il Fondo di Garanzia e la Garanzia Italia di SACE. Inoltre nel 2020 è diventata operativa la possibilità per i portali autorizzati di equity crowdfunding di collocare minibond di SpA a particolari categorie di investitori, a fine 2020 attuata da 3 portali che hanno raccolto € 14,7 milioni.
Le imprese emittenti
La ricerca ha identificato 671 imprese italiane che alla data del 31 dicembre 2020 avevano collocato minibond (identificati come le emissioni di importo inferiore a € 50 milioni da società non finanziarie); di queste, 409 (il 61,0%) sono PMI in base alla definizione UE. Nel 2020 le emittenti sono state 176 (di cui ben 131 si sono affacciate sul mercato per la prima volta), in lieve calo rispetto al 2019. Le emittenti del 2020 sono per il 61,3% SpA, per il 36,4% Srl (tipologia in forte aumento) e per il 2,3% società cooperative. Il volume dei ricavi delle imprese emittenti è sempre molto variabile: ben 56 emittenti (31,8%) fatturavano meno di € 10 milioni prima del collocamento. Per quanto riguarda il settore di attività, il comparto manifatturiero è in testa (36,4% del campione 2020) ma salgono il commercio e le attività professionali (entrambi al 10,8%) e le costruzioni (9,7%).
La collocazione geografica ci regala una sorpresa; nel 2020 la Campania è in testa per numero di emittenti (43) e supera Lombardia (36) e Veneto (29). Il risultato è legato al progetto Garanzia Campania Bond, un ‘basket bond’ che ha cartolarizzato le emissioni di diverse aziende in un’unica emissione, con l’intervento della Cassa Depositi e Prestiti come ‘anchor investor’.
Rispetto alle motivazioni del collocamento, si conferma come dominante l’obiettivo di finanziare la crescita interna dell’azienda (nel 60,5% dei casi dell’intero campione). Al secondo posto troviamo l’obiettivo di rifinanziare le passività finanziarie (10,4%). Seguono il bisogno di alimentare il ciclo di cassa del capitale circolante (soprattutto per le PMI) e le strategie di crescita esterna tramite acquisizioni (soprattutto per le grandi imprese).
Le emissioni
Il database dell’Osservatorio è arrivato a collezionare 1.005 emissioni di minibond effettuate dalle imprese del campione a partire da novembre 2012 (in alcuni casi le imprese hanno condotto più emissioni).
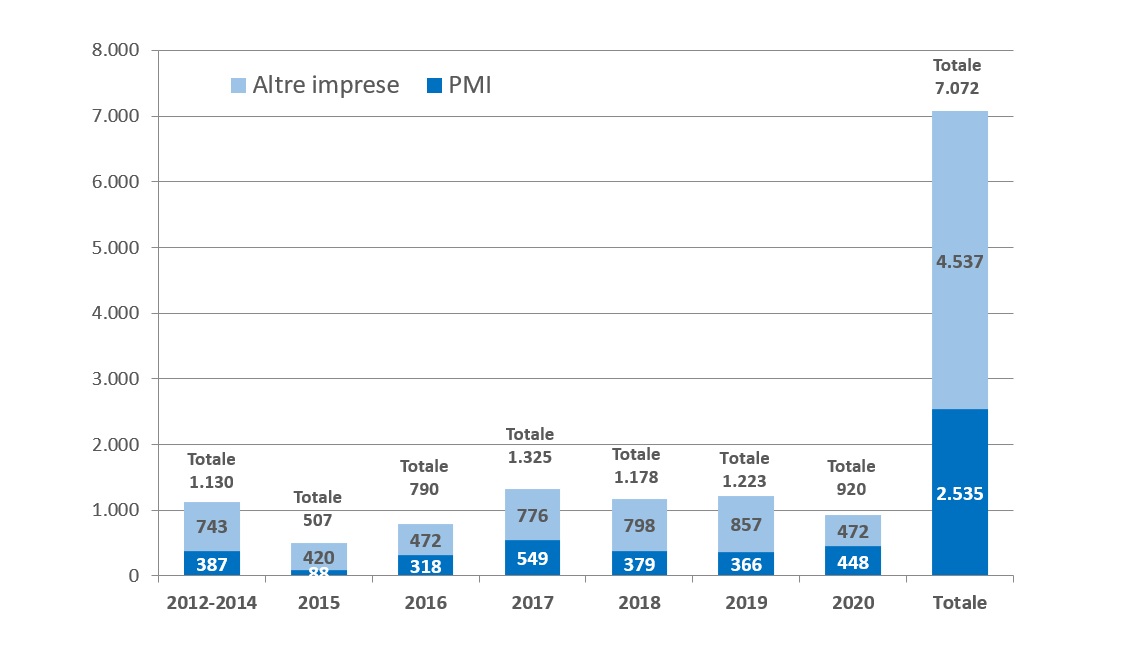
Il valore nominale totale dei minibond nel campione supera € 7,07 miliardi (€ 2,53 miliardi considerando solo le emissioni fatte da PMI). Come evidenzia la Figura 1, il 2020 ha contribuito con € 920 milioni da 194 emissioni (l’anno scorso erano state 205): il volume totale di raccolta è il più basso dal 2016 (ma non di tanto) perché si è ulteriormente ridotto il valore medio delle emissioni (nuovo minimo storico € 4,59 milioni nel secondo semestre 2020). La raccolta per le sole PMI è infatti ai massimi degli ultimi 3 anni; sono mancate soprattutto le emissioni sopra € 20 milioni.
Figura 1. Il flusso annuale della raccolta da emissioni di minibond in Italia. Valori in milioni di euro. Sono considerate le emissioni sotto € 50 milioni di società non finanziarie
Nel campione totale, il 65% delle emissioni è sotto la soglia di € 5 milioni e nel 2020 la percentuale sale quasi al 76%.
Fra tutti i minibond, meno della metà (il 41%) sono stati quotati su un mercato borsistico; nel 2020 tale percentuale è scesa al minimo storico del 16% (l’11% su ExtraMOT PRO3 e il 5% su un listino estero). Per quanto riguarda la scadenza, la distribuzione continua ad essere molto variegata, con una serie di titoli short term con maturity a pochi mesi ed emissioni a più lunga scadenza. Il valore medio del 2020 è 6,34 anni (in aumento rispetto al 2019). Il 61,0% dei titoli prevede il rimborso del titolo a rate successive (amortizing). Nelle emissioni a breve scadenza è relativamente più frequente la modalità bullet, con un rimborso integrale alla scadenza.
Per quanto riguarda la cedola, nella maggioranza dei casi è fissa ma nel 15,6% dei casi è indicizzata. Il valore medio della cedola fissa per l’intero campione è pari a 4,48%, quello mediano è il 4,40%. Nel 2020 continua a scendere la remunerazione (la media è 3,61% rispetto a 4,34% dell’anno prima) anche grazie a numerose emissioni che prevedono garanzie pubbliche.
I minibond italiani sono associati a un rating emesso da agenzie autorizzate nel 23% dei casi. Il ricorso al rating è rimasto contenuto nel 2020 (solo il 14% delle emissioni l’ha ottenuto, stessa percentuale del 2019).
La presenza di opzioni call e put rispetto al rimborso del capitale è frequente nei minibond; nel 2020 sono aumentati quelli che presentano la sola opzione call di rimborso anticipato a discrezione dell’emittente.
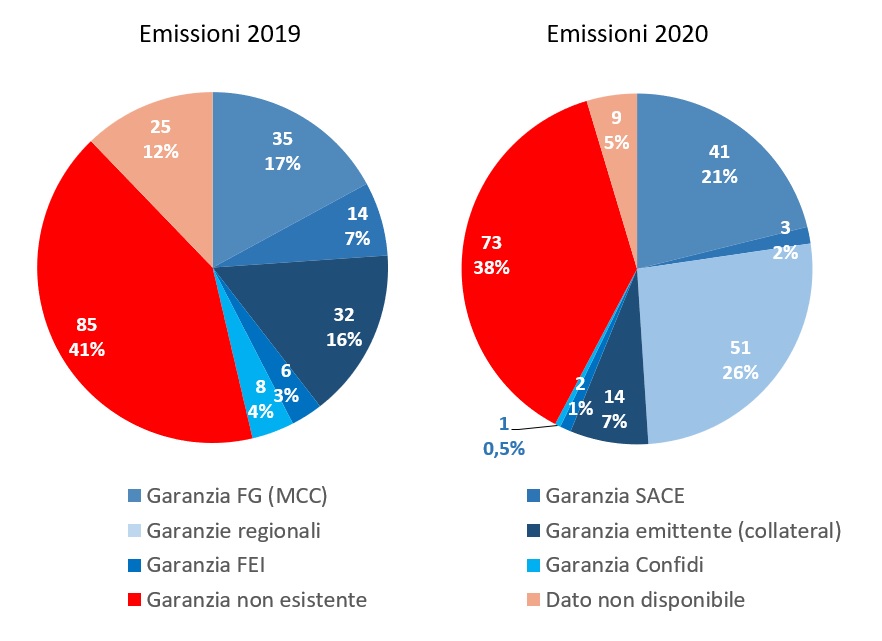
È molto interessante vedere cosa è successo rispetto alle garanzie sul rimborso del capitale, che possono dare maggiore sicurezza agli investitori. Nelle emissioni del 2020 (si veda la Figura 2) si conferma l’aumento significativo nelle adozioni della garanzia, da parte di 112 emissioni (il 58%). La più diffusa è quella rilasciata dalle Regioni (soprattutto attraverso i basket bond in Campania e Puglia) con il 26% dei casi, seguita da quella eleggibile per il Fondo di Garanzia (21%) che però è rilasciata all’investitore. Nel 7% dei casi la garanzia era offerta autonomamente dall’emittente, attraverso un pegno o fideiussione. Appare quindi che nel 2020 ci sia stata soprattutto una ‘sostituzione’ delle garanzie private con quelle pubbliche.
Figura 2. La presenza di garanzie nei minibond italiani: confronto fra le emissioni del 2019 e quelle del 2020
L’impegno a rispettare determinati covenant in funzione di ratio patrimoniali-reddituali-finanziari è pure aumentato e nel 2020 riguarda il 63% dei casi.
Per quanto riguarda gli investitori che hanno sottoscritto i minibond, il 2020 ha visto il ruolo importante delle banche italiane (hanno sottoscritto il 41% dei volumi) seguite dai fondi di private debt (20%) che in parte hanno deviato sulle operazioni di direct lending. Fondi e banche estere contribuiscono con il 15%; importante anche il ruolo della Cassa Depositi e Prestiti (12%).
Le prospettive future
In sintesi, ci sembra di poter dire che il mercato dei minibond nel 2020 abbia resistito alla pandemia; le garanzie pubbliche a nostro avviso sono state utili ma non determinanti; molto più rilevante è stato l’effetto di risorse messe a disposizione da soggetti quali la Cassa Depositi e Prestiti e il Fondo Europeo per gli Investimenti che hanno dato carburante alle sottoscrizioni.
Pure importante è stato il ruolo delle banche attraverso i minibond ‘captive’ originati e sottoscritti internamente.
I temi che nel 2021 meritano attenzione sono essenzialmente tre: (1) monitorare la qualità dei debiti su minibond sulla base dei dati di bilancio del 2020, per evitare un effetto ‘domino’ sul mercato; (2) approfittare della nuova normativa su PIR ‘alternativi’ ed ELTIF per estendere il mercato dei minibond al risparmio gestito; (3) valorizzare le emissioni orientate alle tematiche green e social, che possono tranquillamente riguardare anche le PMI e non solo le grandi imprese.
The European Securities and Markets Authority, the EU’s securities markets regulator, publishes today advice to the European Commission related to data reporting service providers (DRSP)…
On 24 March 2021 the Governing Council adopted the ECB’s Annual Report 2020, which will be presented to the Committee on Economic and Monetary Affairs of the European Parliament and made available on the ECB’s website in 22 official languages of the European Union on 14 April 2021…
MicroStrategy and its head honcho Michael Saylor have become synonymous with Bitcoin, responsible for kicking off the corporate treasury reserve trend that’s transpired ever since…
With institutions demanding protection from inflation and dollar depreciation, historical trends could see BTC/USD 8X from current prices, says Bloomberg Intelligence…
L’iniziativa di Finriskalert.it “Il termometro dei mercati finanziari” vuole presentare un indicatore settimanale sul grado di turbolenza/tensione dei mercati finanziari, con particolare attenzione all’Italia.
Significato degli indicatori
Rendimento borsa italiana: rendimento settimanale dell’indice della borsa italiana FTSEMIB;
Volatilità implicita borsa italiana: volatilità implicita calcolata considerando le opzioni at-the-money sul FTSEMIB a 3 mesi;
Future borsa italiana: valore del future sul FTSEMIB;
CDS principali banche 10Ysub: CDS medio delle obbligazioni subordinate a 10 anni delle principali banche italiane (Unicredit, Intesa San Paolo, MPS, Banco BPM);
Tasso di interesse ITA 2Y: tasso di interesse costruito sulla curva dei BTP con scadenza a due anni;
Spread ITA 10Y/2Y : differenza del tasso di interesse dei BTP a 10 anni e a 2 anni;
Rendimento borsa europea: rendimento settimanale dell’indice delle borse europee Eurostoxx;
Volatilità implicita borsa europea: volatilità implicita calcolata sulle opzioni at-the-money sull’indice Eurostoxx a scadenza 3 mesi;
Rendimento borsa ITA/Europa: differenza tra il rendimento settimanale della borsa italiana e quello delle borse europee, calcolato sugli indici FTSEMIB e Eurostoxx;
Spread ITA/GER: differenza tra i tassi di interesse italiani e tedeschi a 10 anni;
Spread EU/GER: differenza media tra i tassi di interesse dei principali paesi europei (Francia, Belgio, Spagna, Italia, Olanda) e quelli tedeschi a 10 anni;
Euro/dollaro: tasso di cambio euro/dollaro;
Spread US/GER 10Y: spread tra i tassi di interesse degli Stati Uniti e quelli tedeschi con scadenza 10 anni;
Prezzo Oro: quotazione dell’oro (in USD)
Spread 10Y/2Y Euro Swap Curve: differenza del tasso della curva EURO ZONE IRS 3M a 10Y e 2Y;
Euribor 6M: tasso euribor a 6 mesi.
I colori sono assegnati in un’ottica VaR: se il valore riportato è superiore (inferiore) al quantile al 15%, il colore utilizzato è l’arancione. Se il valore riportato è superiore (inferiore) al quantile al 5% il colore utilizzato è il rosso. La banda (verso l’alto o verso il basso) viene selezionata, a seconda dell’indicatore, nella direzione dell’instabilità del mercato. I quantili vengono ricostruiti prendendo la serie storica di un anno di osservazioni: ad esempio, un valore in una casella rossa significa che appartiene al 5% dei valori meno positivi riscontrati nell’ultimo anno. Per le prime tre voci della sezione “Politica Monetaria”, le bande per definire il colore sono simmetriche (valori in positivo e in negativo). I dati riportati provengono dal database Thomson Reuters. Infine, la tendenza mostra la dinamica in atto e viene rappresentata dalle frecce: ↑,↓, ↔ indicano rispettivamente miglioramento, peggioramento, stabilità rispetto alla rilevazione precedente.
Disclaimer: Le informazioni contenute in questa pagina sono esclusivamente a scopo informativo e per uso personale. Le informazioni possono essere modificate da finriskalert.it in qualsiasi momento e senza preavviso. Finriskalert.it non può fornire alcuna garanzia in merito all’affidabilità, completezza, esattezza ed attualità dei dati riportati e, pertanto, non assume alcuna responsabilità per qualsiasi danno legato all’uso, proprio o improprio delle informazioni contenute in questa pagina. I contenuti presenti in questa pagina non devono in alcun modo essere intesi come consigli finanziari, economici, giuridici, fiscali o di altra natura e nessuna decisione d’investimento o qualsiasi altra decisione deve essere presa unicamente sulla base di questi dati.
In 2016 Deutsche Bank published a report that highlighted the state of Cloud adoption in Financial Services[1]. The results showed how, at the time, Cloud suffered from widespread criticism in the Financial Services sector. Even amongst industry’s early adopters, only 30% were planning to move to the cloud in 2019. In comparison, at the same time, businesses like Consumer Products or Healthcare were migrating more than 85% of their applications. Therefore, J.P. Morgan Chase decision to move its application to Public Cloud in April 2017 was considered a milestone, an example that would pave the way for other players in the market, moving the Financial Services a step closer to the Cloud.
Today, almost 4 years after Morgan Chase’s decision, FSI companies seem to have overcome their skepticism over Cloud, while migration and adoption projects are everyday matter. However, the old concerns are still deeply rooted in Financial Services’ Boards and every project that involves Cloud has to undergo a long and accurate scrutiny, an analysis so cautious that might likely bring to a paralysis, slowing down the pace of innovation and technological disruption.
The following paper offers a perspective on the FSI industry, aiming to analyze the reasons that hinder Cloud adoption, as well as the motives and the benefits that should move FSI boards to consider a faster adoption of Cloud technologies and methodologies, without worrying for the safety of their assets.
The digital challenge
COVID-19 pandemic had a crucial role in accelerating digital transformation to maintain business resilience. In addition to the disruption posed by the virus, FSI organizations face aggressive competition coming from Financial Technology (fintech) companies and their new offering based on digital capabilities.
Let us take Italy as an example. In Italy circa 600 banks deal with 250 fintech companies, as well as international players such as N26 and Revolut. Even though Italians still prefer traditional payments, the tide is rapidly turning: if in 2017 86% of transactions still used cash[2], in 2020 digital payments were 33% of the total[3]. More than half of bank customers (around 18 million people) manage their operations over the internet and the trend is growing by the year: customers using Internet banking rose by 52% between 2016 and 2019, while those using Mobile Banking scored +21%. [4]
The products offered by fintechs seem to meet this new demand. The Italian banking Association estimates that 81% of “advanced” bank customers used a service provided by a non-traditional player for their payments, and 55% of them did the same for other financial products[5]. Therefore, banks need to move quickly to step up to these new competitors.
The evolution of banks towards a digital, modern environment is particularly difficult because of banks’ specific traits:
Outdated technology: compared to fintechs, banks base their core system on ageing technology. As of mid-2019 more than 70% of institutions were still reviewing their legacy mainframe-based system, originally developed in the 1970s and 1980s, and 43% of banks in the US still uses COBOL, a programming language dating to 1959. Furthermore, a survey conducted by Censuswide in 2019 in the UK showed that only 37% of banks offer the chance to open an account instantly. The data also stated that almost double the number of UK customers of traditional banks, experience disruption to their service on a yearly basis compared to challenger banking users.[6]
Lack of skills: outdated technology makes it difficult to find the right IT professional on the market, plus systems dating back to 20 or 30 years ago come with a huge deal of complexity and customization, often poorly documented, increasing the complexity of an intervention on the legacy system.
Regulation: one of the main reason why many digital transformation programs have been delayed or cancelled lays in concerns over regulatory compliance. According to Forrester, 60% of European institutions stated regulation as the main obstacle in Cloud services adoption.[7]
Cloud: the transformation enabler
Under these circumstances, Cloud can be not only a solution to achieve greater business agility and cost savings, but also a platform to innovate banking infrastructure and activate innovative services that can expand and enhance the capabilities of FSI organizations.
In their recent whitepaper Forging New Pathways. The next evolution of innovation in Financial Services, the World Economic Forum placed Cloud as the foundation of digital capabilities. Cloud creates connectivity to access other technologies as-a-service and, focusing their investment on it, organizations can more easily access emerging technologies to solve their main business problems.
In one word, Cloud is the Digital Banking enabler, the starting point to undergo the change addressing FSI main pain points:
Regulation: using Cloud models to build open and agile platforms that can easily meet regulatory requirements.
Ecosystem: building API-based architecture to foster collaboration with financial technology partners to develop new digital products.
Customer centricity: building capabilities to better identify customer needs using Artificial Intelligence and Machine Learning tools
Innovative Payments: enabling faster and cheaper payments through digitization and automation.
New sources of revenue: identifying capabilities to sell “as-a-service”.
Banks and Financial Institutions usually manage a great amount of customer data. Using Cloud, banks can build an Integrated Data Platform to integrate their traditional databases with new data sources, such as Social Media. Artificial Intelligence (AI) and Machine Learning (ML) capabilities can then be applied to unlock the real value of data, identifying customers’ needs and behavior to offer new financial products, tailored on the specific needs of each customer.
Another concrete example of Cloud possibilities is contact center transformation. Several of the main Cloud Service Providers already offer products to evolve the traditional contact center, using Cloud to cut-down costs and scale up capabilities according to the needs. Furthermore, these products can implement chatbots and AI to provide quicker responses and richer interactions based on customers’ data.
Despite Cloud possibilities, however, banks’ digital transformation programs had shown little results in the last decade, as Forrester[8] observes. Most of the projects do not reach the implementation phase and get stuck in the planning phase, following reluctance to undergo a transformational process that is often perceived as too complicated or that could raise regulatory concerns.
Analysis-Paralysis: how to overcome the most common concerns in Cloud Adoption
For most companies, especially in regulated industries such as Banking and payments, there are a number of attention points to address. That is the reason behind the failure of many Cloud transformation programs: the analysis often hampers the need for innovation, leading the organization to a paralysis. However, these matters can and should be overcome, as many organizations already did.
Security concerns are one of the main reasons that can prevent an organization from undergoing a full Cloud adoption. Customers often perceive Cloud as more exposed to cybersecurity threats and are concerned for the security of their data in a “shared” environment.
Cybersecurity on Cloud, however, is a matter of shared responsibility, in which the Cloud service provider takes care of the overall infrastructure, while the client has responsibility over the correct management of his own data and applications. Companies needs to understand this approach and pay attention to the correct implementation of its own data and application in order to ensure safety and avoid disruption.
Compliance is another significant worry in the Financial Services sector. Regulators require strict measures on data storage and the distributed nature of Cloud can create issues, especially when it’s not clear where the Cloud service provider will physically store one company’s data.
Most Global Cloud Providers have data centers in the Country or Region of interest, to address most of the compliancy requirements. AWS recently launched a new Italian Region based in Milan and other main Cloud providers (Google, Microsoft, Oracle) are planned to launch in 2022, giving Italian FSI the possibilities to store their data inside national borders and thus meet regulatory standards. Furthermore, regulators are now more open to Cloud and pushing companies in those markets to address properly their Cloud journey rather than stopping it.
The European Banking Authority (EBA) released its final guidelines on Cloud Outsourcing, which came into force on 30 September 2019, aiming to clarify regulatory expectations over documentation, risk assessment and governance around Cloud Outsourcing agreements and national regulators in UK, Luxembourg, Germany and France clarified their position on the topic.[9]
Budgeting could also raise some concerns. Shifting from Capex to Opex makes a significant impact on tax reporting and requires new accounting procedures to be managed correctly.
Cloud adoption calls for a shift in budgeting; sophisticated cost and expense control are fundamental to avoid losing cost saving and efficiency embedded in the Cloud adoption.
Apprehension over vendor lock-in is another issue that can stop a cloud adoption program. Moving licenses and application from one service provider to another can be extremely complex, expensive and can wear down the most cloud-enthusiast.
However, truth is that vendor lock-in has been an issue over the last decades, way before the advent of Cloud computing. A competent planning of Cloud adoption can avoid lock-ins using, for example, multi-cloud or hybrid cloud solutions to select the right provider for each workload. In addition to that, recent programs as Gaia-X – the initiative that aims to create a European Cloud – are trying to open the market to smaller initiatives and new competitors that could offer an alternative to global Cloud Providers.
Finally yet importantly, lack of competences and Cloud skills can prevent many organizations to go on their path to Cloud transformation. Thus, Cloud adoption should be carefully planned, designing an adequate strategy and preparation phase aligning talents and company’s operating model to function in the new Cloud environment.
Cloud requires the transformation of the overall organization, as well as the IT architecture. Creating a Cloud Center of Excellence can centralize governance, operations, standards settings and demand management. Investing in people’s competences is crucial and will help organization to better manage the move to the Cloud.
Conclusion
Adopting the Cloud can be daunting, but its benefits in terms of business agility, cost control, scalability and innovative solutions is something that can be crucial for banks and other Financial institutions. Building Cloud foundations will allow companies to cost-effectively build advanced automation and AI tools, in addition to enhanced business agility. Those who already made their move to the Cloud can state its benefits: National Australia Bank used Cloud to automate its security and compliance checks, deploying in only 45 seconds controls that used to take more than 3 weeks.[10] Companies should bear in mind that Cloud is more than a technological upgrade. It requires a broader, holistic business transformation for benefits to appear. Following this caveat, FSI organizations should carefully program their Cloud migration, merging technology, talent and processes to realize Cloud profits without need to worry about its downsides.
[6]Cloud Banking to drive business growth, five degrees blog, fivedegrees.com, 25 September 2019
[7] Jost Hoppermann, Stephen Powers, Katie Hampton, Emma Huff, Kara Hartig, Forrester Infographic: SaaS Faces Obstacles In Financial Services, forrester.com, 13 February 2020
[8] Jost Hopperman, Oliwia Berdak, Jacob Morgan, Corrado Loreto, The Evolution Of Digital Banking Platform Architecture, forrester.com, 6 April 2020
Questo sito utilizza cookie tecnici e di profilazione, propri e di terze parti, per garantire la corretta navigazione, analizzare il traffico e misurare l'efficacia delle attività di comunicazione.
Questo sito Web utilizza i cookie per migliorarne l'esperienza di navigazione. I cookie classificati come necessari, sono essenziali alle funzioni di base sito e vengono sempre memorizzati nel tuo browser. I cookie di terze parti, che ci aiutano ad analizzare e capire come utilizzi questo sito, vengono memorizzati nel tuo browser solo con il tuo consenso. Di seguito hai la possibilità di disattivare questi cookie. Tieni in conto che la disattivazione di alcuni di questi cookie potrebbe influire sulla tua esperienza di navigazione.
Necessary cookies are absolutely essential for the website to function properly. These cookies ensure basic functionalities and security features of the website, anonymously.
Cookie
Durata
Descrizione
cookielawinfo-checkbox-analytics
1 year
Cookie tecnico impostato dal plugin GDPR Cookie Consent che viene utilizzato per registrare il consenso dell'utente per i cookie nella categoria "Analitici".
cookielawinfo-checkbox-necessary
1 year
Cookie tecnico impostato dal plugin GDPR Cookie Consent che viene utilizzato per registrare il consenso dell'utente ai cookie.
CookieLawInfoConsent
1 year
Cookie tecnico impostato dal plugin GDPR Cookie Consent per salvare le scelte si/no dell'utente per ciascuna categoria.
viewed_cookie_policy
1 year
Cookie tecnico impostato dal plugin GDPR Cookie Consent che registra lo stato del pulsante predefinito della categoria corrispondente.
Analytical cookies are used to understand how visitors interact with the website. These cookies help provide information on metrics the number of visitors, bounce rate, traffic source, etc.
Cookie
Durata
Descrizione
_pk_id.gV3j99y0AE.0928
1 year 27 days
Cookie analitico impostato da Matomo e utilizzato per memorizzare alcuni dettagli sull'utente come l'ID univoco del visitatore
_pk_ses.gV3j99y0AE.0928
30 minutes
Cookie analitico impostato da Matomo di breve durata e utilizzato per memorizzare temporaneamente i dati della visita