Credit standards for loans to firms remain favourable, supported by fiscal and monetary measures…
https://www.ecb.europa.eu//press/pr/date/2020/html/ecb.pr200714~d6b166d17c.en.html
Credit standards for loans to firms remain favourable, supported by fiscal and monetary measures…
https://www.ecb.europa.eu//press/pr/date/2020/html/ecb.pr200714~d6b166d17c.en.html

L’avvento dei nuovi reference rate, fortemente voluto in seguito alla crisi di credibilità dei LIBOR, ha portato pressoché per tutte le currency alla definizione di specifici tassi Overnight come nuovi rereference (free risk) rate. Questo determina una forte innovazione in tutti i prodotti bancari e finanziari indicizzati a tali tassi. Nell’articolo aspetti tecnici e problemi aperti.
1 La riforma dei tassi IBOR
Motivazioni e linee guida della riforma dei tassi IBOR mediante la benchmark regulation (BMR) sono già bene descritti in [10], quindi non ci dilunghiamo, soffermandoci sugli aspetti significativi per le parti tecniche delle sezioni successive.
Per ogni currency, si è affermato in questi anni un nuovo reference rate, che opera come il migliore “rappresentante” dei tassi free-risk per l’area valutaria di riferimento.
Su questo punto si è definita una forte differenza tra area Euro e altre valute.
Per l’area Euro, il tasso €STR di tipo overnight ha soppiantato il vecchio tasso EONIA, ma rimane anche il tasso Euribor, con nuova metodologia per cui è definito Euribor Ibrido. In breve, la sua quotazione non dipende solo da un panel di quotazioni di un numero limitato di banche, ma anche anzi con priorità da transazioni osservate sul mercato tra banche e anche con large corporate.
Per le altre aree valutarie, in primis GBP e USD, il nuovo reference rate è costituito sempre da soli tassi di tipo Overnight, rispettivamente SONIA (sterling ovvernight index average) e SOFR (secured overnight financing rate). Tassi cioè che fanno riferimento a operazioni di lending di durata h = 1 giorno.
Inoltre, basandosi su operazioni effettive e non su quotazioni, sono pubblicati in generale in (t+1), mentre gli attuali LIBOR sono pubblicati al tempo (t) per operazioni con decorrenza (t).
Se però usciamo da mercato banche vs. banche e ci riferiamo al mercato delle operazioni tra banche e clientela, sia corporate sia retail, sono altre le durate e le periodicità tipiche. Per i mutui e finanziamenti il piano rateale è spesso mensile, per i bond la cedola è spesso semestrale, ecc.
Quindi il mercato necessita, da sempre, di tassi a termine, cosiddetti term rate, su varie scadenze.
Il fatto però che i nuovi benchmark rate siano tipicamente overnight pone su questo vari problemi, che illustriamo con maggiore dettaglio nelle sezioni successive.
2 Convenzioni sui floating rate. Tassi forward looking e fixing in advance
Come noto, con il termine fixing si intende il processo di fissazione di un valore finanziario, preso a riferimento poi da altri contratti, quali mutui, bond, derivati.
I tassi LIBOR sulle diverse divise, come Euribor per l’area EURO, erano quotati su diverse scadeze, quali 1 settimana, 1 mese, 3 mesi, 6 mesi, 12 mesi.
E fanno riferimento a operazioni con decorrenza in (t), talvolta (t+1) o (t+2).
Indicando con (h) la durata, ci si riferisce pertanto a operazioni, supponiamo di prestito, in cui alla data (t) viene erogato l’importo, in (t+h) viene restituito maggiorato degli interessi al tasso pattuito, con un calcolo proprozionale al tempo. Indicando quindi con R il tasso e con C il capitale, il valore finale è dato da
V(t+h) = C ˖ (1 + hR)
Si dice quindi che i tassi quotati sono forward looking, in quanto fanno riferimento nel mercato interbancario a operazioni che nascono nel medesimo istante.
Se pensiamo a un qualunque mutuo indicizzato a tale tasso, si usa dire che il fixing del tasso è in advance, cioè fatto a inizio del periodo di calcolo della rata.
I due aspetti sono fortemente correlati. Sul mercato degli operatori professionali, è natutale che i term rate facciano riferimento a operazioni con decorrenza sincrona alla quotazione. Sul mercato delle operazioni con clienti finanziati o investitori, conoscere il tasso applicato a inizio del periodo della rata o della cedola è la preferenza pressoché universale degli operatori, quindi fixing in advance.
Nulla vieta, ma è un caso scolastico molto raro, che un tasso forward looking sia applicato alla fine del periodo, cioè in arrears. Ma appunto è un caso di frequenza quasi nulla. Esempio: su bond con cedola semestrale luglio-dicembre 2020 si applica il tasso Euribor 6 mesi osservato in data 31 dicembre 2020 (che però fa riferimento a depositi tra banche che si verificano nel primo semestre 2021).
Da queste prime note si intuisce il problema: come possono i tassi overnight, riferiti al periodo h = 1 giorno, funzionare come indice di riferimento per operazioni con periodicità di ben diversa lunghezza, quali soluzioni? Regulators, working group, operatori, stanno convergendo verso nuove regole e preferenze, di fatto una importante evoluzione nelle abitudini, nei processi, nei sistemi informativi, con conseguenze anche a livello legale e di compliance. Nella prossima sezione gli orientamenti alla data, che non costituiscono ancora “lo standard”, ma un framework di ormai prossima applicazione.
Si tenga infatti presente che per alcune aree valutarie il regulator, come Bank of England per la sterlina, sta fortemente premendo per dismettere i tassi LIBOR nelle nuove emissioni e prodotti già dal primo trimentre 2021, quindi un anno in anticipo rispetto alla cessazione ufficiale dei LIBOR.
3 I nuovi term rate. Compounding in Arrears ?
Su quanto proposto dai vari regulator e gruppi di lavoro internazionali, con ruolo in qualche modo di guida da parte delle aree GBP e USD, si vedano i vari documenti in [3], [4], [5], [6].
La principale proposta è quella verso una metodologia di compounding in arrears, abbastanza innovativa rispetto alla convenzioni applicate in generale su prodotti bancari e finanziari nel “vecchio” mondo degli IBOR.
Vediamo i vari aspetti.
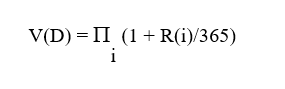
Quanto al compounding, si tratta del principio per cui un investimento overnight può essere replicato giorno per giorno, capitalizzando gli interessi, e quindi l’idea di base è che un tasso di interesse su un tenor maggiore, per esempio un mese, sia espresso in modo più fedele dal compounding rispetto a una media aritmetica. Utile qualche formalismo. Se indichiamo con R(i) il tasso al tempo (i), i = 1…D, e omettendo in quanto non essenziale il capitale iniziale, che possiamo porre C =1, il valore dell’investimento V(D) dopo D giorni è dato da
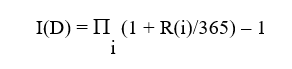
L’interesse maturato totale è pertanto dato da I(D)
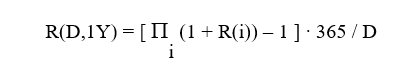
Per riportare il tutto a tasso di interesse annuo, come d’uso nelle quotazioni, basta riproporzionare e si ha
Manca ora un ultimo dettaglio. Poiché negli weekend i tassi non sono quotati, o a causa di festività del mercato di riferimento, uno specifico valore può essere utilizzato per più giornate. I regulator e gruppi di lavoro si stanno orientando verso un peso n(i) = 3 giorni associato al fixing del venerdì. Il tutto si riscrive quindi in modo completo come

Da un punto di vista tecnico e della matematica finanziaria non è questa una novità. Il tasso composto, il cui limite è costituito dal modello continuo V(t)=V(0)∙exp(rT) è ben noto. Oltretutto una famiglia di derivati molto diffusi come gli OIS, overnight indexed swaps, da sempre determina la componente floating mediante capitalizzazione dei tassi overnight di mercato.
E’ però fortemente innovativo pensare al fatto che anche prodotti molto più retail, quali i mutui con il loro calcolo rata e i bond con le cedole, applichino tale composizone geometrica dei rendimenti. Come osservato nei vari gruppi di lavoro, è questo il calcolo che più rispetta il “time value of money”.
Dopo il problema del QUANTO, cioè di calcolo del tasso su tenor diversi da overnight, partendo da tassi overnight, vediamo la questione del QUANDO o del COME.
Si tenga conto che basandosi su operazioni effettive, i nuovi tassi saranno disponibili e pubblicati in generale in (t+1), con riferimento a (t), dalle banche centrali e dai provider di mercato.
Le banche devono utilizzare questi valori per garantire calcolo e addebito/accredito di cedole, rate, in modo tempestivo rispetto al periodo contabile di riferimento. Per farlo devono però acquisire i fixing, controllarli, propagarli nei sistemi informativi. Non è pensabile di differire, magari di un paio di giorni, operazioni contabili e informativa al cliente a causa delle regole di pubblicazione.
Quindi il calcolo sarà certamente in arrears, cioè di determinazione del tasso di periodo in base ai tassi overnight del periodo appena concluso, ma con alcuni aggiustamenti legati a questa necessità di tempestività di determinazione della quota interessi.
Ci limitiamo per motivi di spazio alle due clausole attualmente più promosse in sede internazionale.
Clausola Lag/Shift
Clausola Lockout
4 Alcune riflessioni
Non tutti gli operatori sono soddisfatti e convinti di una migrazione globale dei mercati verso questa logica di tassi backward looking con applicazione in arrears.
Molti pensano che sia più corretto basarsi su tassi forward looking. In questo caso, una volta che vi sia un mercato veramente liquido di strumenti sui tassi overnight, in particolare Future, OIS e Basis Swap, dalle quotazioni di tali strumenti si potrà costruire una curva a termine robusta che si basa su questo new normal.
E’ al tempo stesso dubitabile che tali tassi forward looking, dedotti dal mercato medante un processo di bootstrapping e non legati ale quotazioni dirette come sono invece gli attuali LIBOR, possano essere base di indicizzazione di prodotti quali mutui e bond.
Quindi prodotti e contratti andranno verso queste nuove clausole. Tale evoluzione pone di certo delle problematiche anche sulla compliance relativa alla trasparenza, cioè sulla comunicazione pre contrattuale al cliente delle regole di gestione del parametro di indicizzazione, e di disclosure nelle comunicazioni periodiche ed estratti conto sulla determinazione del tasso periodico. Oltretutto, va ricordato, in presenza di una “meccanica” di trattamento dei dati di mercato non certo di facile assimulazione per tutta la clientela.
Viene da chiederesi se i principi di target market della Mifid2, cioè di matching tra le caratteristiche del cliente, in particolare le sue competenze, con le caratteristiche di complessità dei prodotti, non possa essere un utile punto di partenza anche nell’ambito dei prodotti tipicamente bancari.
Ringraziamenti
Un sentito Grazie a Paolo Cobuccio e Alessandro Santocchi, Iason Ltd, per il proficuo confronto.
Riferimenti
[1] Financial Stability Board (2014), “Reforming Major Interest Rate Benchmarks “.
[2] Financial Stability Board (2019), “Overnight Risk-Free Rates. User Guide ”
[3] Bank of England (2020),“Supporting risk Free Transition through the provision of compounded SONIA”, Discussion Paper.
[4] ARRC (2019), “Appendix to SOFR Floating Rate Notes Conventions Matrix”.
[5] The Working Group on Sterling RFRR (2020), “Use Cases of Benchmark Rates”
[6] ISDA (2020), “Adoption of Risk-Free Rates: Major Developments in 2020”, ISDA Research Notes.
[7] Schrimpf A., Sushko V. (2019), “Oltre il LIBOR: introduzione ai nuovi tassi di riferimento”, Paper BIS.
[8] Alternative Reference Rate Committee (2019), “Summary of ARRC’s LIBOR Fallback Language”.
[9] Unione Europea (2016), “Benchmark Regulation (BMR)”, Regulation 2016/1011

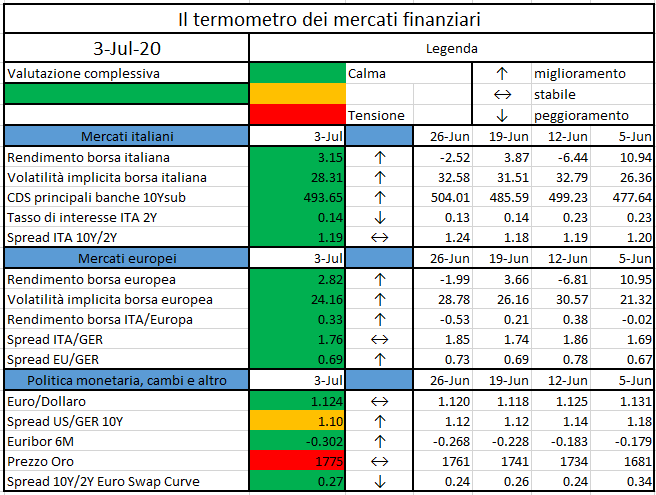
L’iniziativa di Finriskalert.it “Il termometro dei mercati finanziari” vuole presentare un indicatore settimanale sul grado di turbolenza/tensione dei mercati finanziari, con particolare attenzione all’Italia.
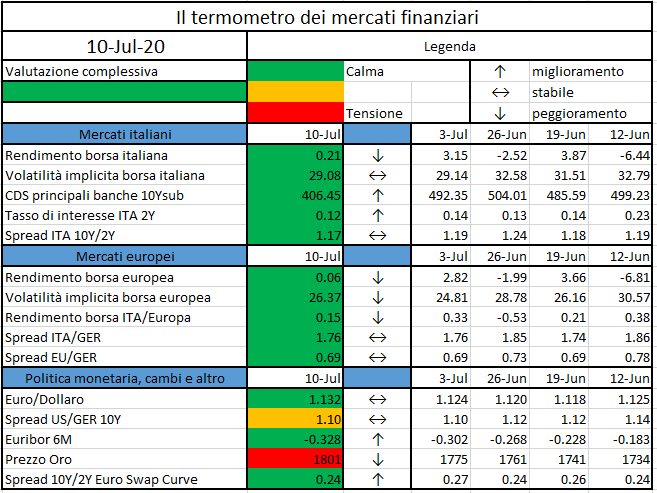
Significato degli indicatori
I colori sono assegnati in un’ottica VaR: se il valore riportato è superiore (inferiore) al quantile al 15%, il colore utilizzato è l’arancione. Se il valore riportato è superiore (inferiore) al quantile al 5% il colore utilizzato è il rosso. La banda (verso l’alto o verso il basso) viene selezionata, a seconda dell’indicatore, nella direzione dell’instabilità del mercato. I quantili vengono ricostruiti prendendo la serie storica di un anno di osservazioni: ad esempio, un valore in una casella rossa significa che appartiene al 5% dei valori meno positivi riscontrati nell’ultimo anno. Per le prime tre voci della sezione “Politica Monetaria”, le bande per definire il colore sono simmetriche (valori in positivo e in negativo). I dati riportati provengono dal database Thomson Reuters. Infine, la tendenza mostra la dinamica in atto e viene rappresentata dalle frecce: ↑,↓, ↔ indicano rispettivamente miglioramento, peggioramento, stabilità rispetto alla rilevazione precedente.
Disclaimer: Le informazioni contenute in questa pagina sono esclusivamente a scopo informativo e per uso personale. Le informazioni possono essere modificate da finriskalert.it in qualsiasi momento e senza preavviso. Finriskalert.it non può fornire alcuna garanzia in merito all’affidabilità, completezza, esattezza ed attualità dei dati riportati e, pertanto, non assume alcuna responsabilità per qualsiasi danno legato all’uso, proprio o improprio delle informazioni contenute in questa pagina. I contenuti presenti in questa pagina non devono in alcun modo essere intesi come consigli finanziari, economici, giuridici, fiscali o di altra natura e nessuna decisione d’investimento o qualsiasi altra decisione deve essere presa unicamente sulla base di questi dati.
A pandemic disease, which represents an outbreak of a disease spreading across wide geographic areas of the whole world and affecting an exceptionally high proportion of the entire population, spreading all over the world is an exceptional event not occurred in Europe since 1918-19 when the “Spanish Flu” found Europe as the ground-zero of a similar disease (and since 1968-69 in the World with the “Hong-Kong Flu”).
In these weeks, we have just moved from the “Phase 1”, a nearly complete economy and social lockdown due to over 3 billion people constrained in their houses, to the “Phase 2” also called “Exit strategy” which will consider a step-by-step re-opening. Prevention and social distancing are still the key words for this transition.
While virologists and experts are focusing on pandemic curves trend, economists try to understand what is going to happen on financial markets and real economy and specifically to predict the recovery shape (V, W, U, L in terms of GDP).
Considering each country peculiarities and reaction to the virus, as reported by Antonio Fatás (Noyes, 2020), this recession is unique and can show a completely new different shape from the past, probably with a jeopardized behaviors rather than a common path as it has been observed in 2008 crisis (except for Greece and Portugal).
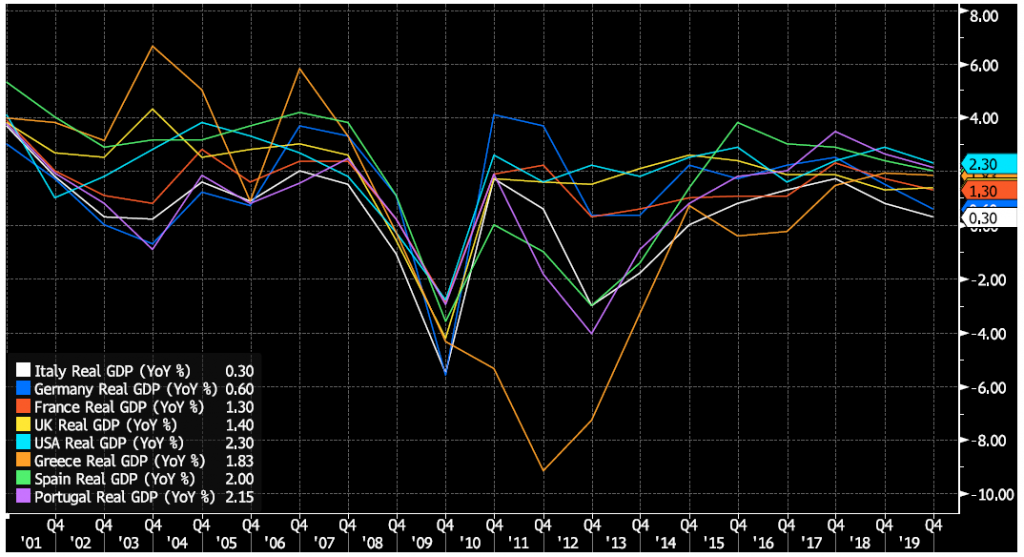
May Bank of America’s monthly global fund manager survey (Winck, 2020) shows a limited pessimistic 10% who expect a V-shape recovery and a more optimistic 75% who predict prolonged U- or W-shaped recoveries.
Within this context, a crucial role must be played by banks. They hold a primary role and must act as facilitator and enhancer of the recovery.
In this article we want to provide some insights about what it is happening on the Advisory sector, what banks will have to do in order to support their clients and what are the main challenges that they will face soon.
Advisory segment has become more and more relevant over the years representing steadily a 25% (Damyanova, 2020) of total revenues even in crisis period, but it represents even more. Advisory Service, including not only investment counselling but also IPO, ECM and DCM, are the first contact between bank and client and plays a relevant role to strengthen relationship and cross-selling. Coronavirus will strongly re-shape how this business segment is undertaken, creating new roles and ending some others, and banks need to encompass this process because, as Einstein spoke, “In the middle of difficulty lies opportunity”.
Contrary to 2008 crisis, were banks were badly perceived as the principal creator of the economy drawdown forced by their focus on revenues heedless of the control measures, nowadays they are engulfed in the situation as all stakeholders but can proactively help economy to recover.
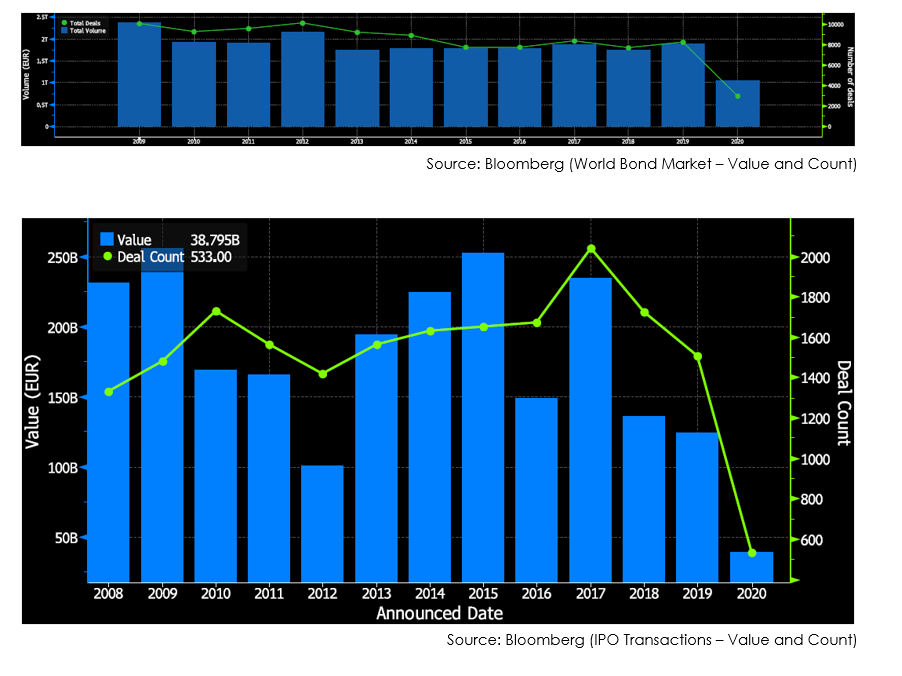
Capital Markets are under widely pressure. Due to high market volatility (e.g. roller-coaster on TVIX), companies are in trouble obtaining funding both on equity and debt solutions. Actual crisis exacerbates companies with previous already critical situations while poses threats to healthy ones which can access market only with high costs.
As reported below, European IPO and bond markets have shrunk in 2020 as companies are suspicious over them.
On the other side, private equity can be a relevant factor within this situation due to high liquid investment funds and/or High Net Worth Individuals (HNWI) who can provide liquidity and sustainment to companies but not for free. In a context where prices are falling and immediate need can tarnish judgement, risk of cannibalization are significant as well as potential one-life deals.
Banks role, in order to preserve financial fabric, is double as they must:
Being an advisory means above all to shift priorities from short-term marginality to long term relationship. Nowadays both retail and corporate institutions need a guide to understand how to operate in order to preserve revenues and have easily access to liquidity at a cost which not burden them in the future.
Moreover, another relevant point is the imposed introduction, due to Coronavirus, of a switch from face-to-face advisory to digital one, of course without losing trust and/or knowledge within the process.
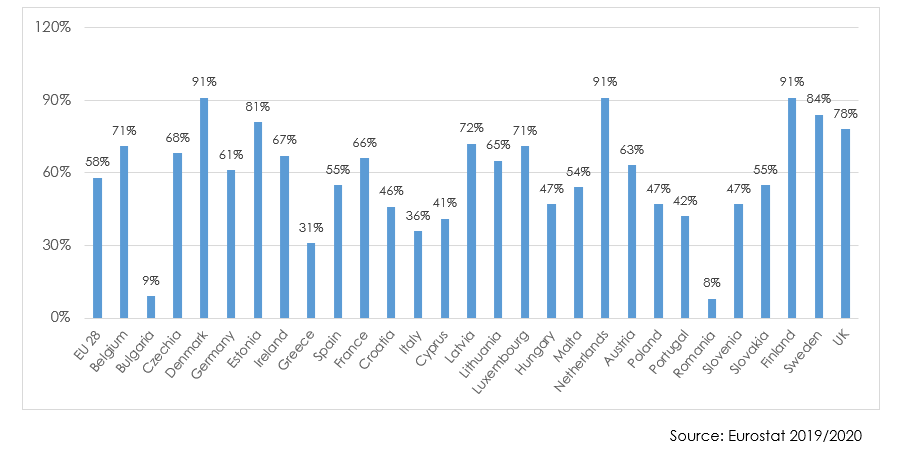
EU countries are still on the run with the digital journey for bank services as reported by the graph above. Except for some outliers, the average number of people accessing banks’ services through digital systems (PC/Smartphone) is at 58% and mainly constituted by young people (below 35/40 years). Italy (36%), specifically, is well below the average.
This process urges to speed-up not only to face actual situation but also to keep the pace with other competitors, engage new young and digital clients and enhance efficiency within processes. As of now “digital” has been perceived as a project and a complement to actual offering but never, except for small and innovative banks, as a core value to be centralized. Financial system requires to shift vision from a channel oriented where clients are divided according to the way they address to financial instruments with a clear distinction of products offering to a client based one where banks must guide and be accessible through different ways but always according to client need. Main concerns should be to simplify procedure, reduce the time-to-market and enhance to its best the cross-selling.
Aftermath of 2008 downturn is still something banks and entire financial systems are coping with and some countries, like Italy, are still in the middle of a long process of bad loans cutting. Recovery nowadays appears difficult and requires not only short-term financial measures but possibly a structural change to advisory services.
Uncertainty over financial markets makes it difficult for companies and investors to fund their needs, try to maintain their revenues at least at minimum level to cover costs which cannot be postponed and decide where to invest in order to catch correct market opportunities due to lowering prices.
However, this is an unprecedented opportunity for banks to, on one side reassess their advisory role and leverage on their experience and knowledge of the market while on the other side become real leader in the digital innovation.
In a wider consideration, this attitude can grant significant benefits for the future as backing-up clients today can increase potential clients tomorrow and becoming first-mover for digital transformation can lay foundation for relevant competitive advantage. Due to forced speed-up of digitalization, many organizations are beginning to introduce digital learning programs for employees and are investing over new digital innovation for clients’ engagement and management. This kind of processes will surely speed-up more and more in the future as, besides of attracting new clients, it can also reduce fixed costs and allow a more efficient internal procedures granting a better time-to-market.
“Dizionario di Medicina” – Treccani, su treccani.it.
Rachel Noyes, “The Shape of the COVID-19 Economic Recovery”, Economics & Finance – Blog, 2020
Ben Winck, “Only 10% of 223 fund managers surveyed by Bank of America expect a V-shaped economic recovery”, Markets Insider, 2020
Vanya Damyanova, “Global investment banks’ 2019 revenues slip to 2008 levels amid equities slump”, S&P Global, 2020
Eurostat, European Statistics, 2019-2020
“Coronavirus: Considerations for Capital Markets”, Baker Mckenzie, 2020
Peter Lee, “Private equity can be the big winner from Covid-19 sell-off?”, Euromoney, 2020
Dominic O’Neill, “Coronavirus: Italian banks try to make up for lost time”, Euromoney, 2020
It’s not quite a seal of approval, but one of Europe’s largest financial markets is giving cryptocurrencies the equivalent of the bar codes found on soup cans and jam jars.
https://www.coindesk.com/london-stock-exchange-parent-assigns-financial-bar-codes-to-169-cryptos
The Board of Supervisors of the European Insurance and Occupational Pensions Authority (EIOPA) has appointed new members to the Insurance and Reinsurance Stakeholder Group…
Report sets out the adoption status of Basel III standards in member jurisdictions as of end-May 2020…
The introduction of the euro has undoubtedly been one of the most profound changes in the international monetary system since the collapse of the Bretton Woods…
https://www.ecb.europa.eu//press/key/date/2020/html/ecb.sp200707~3eebd4e721.en.html
L’iniziativa di Finriskalert.it “Il termometro dei mercati finanziari” vuole presentare un indicatore settimanale sul grado di turbolenza/tensione dei mercati finanziari, con particolare attenzione all’Italia.
Significato degli indicatori
I colori sono assegnati in un’ottica VaR: se il valore riportato è superiore (inferiore) al quantile al 15%, il colore utilizzato è l’arancione. Se il valore riportato è superiore (inferiore) al quantile al 5% il colore utilizzato è il rosso. La banda (verso l’alto o verso il basso) viene selezionata, a seconda dell’indicatore, nella direzione dell’instabilità del mercato. I quantili vengono ricostruiti prendendo la serie storica di un anno di osservazioni: ad esempio, un valore in una casella rossa significa che appartiene al 5% dei valori meno positivi riscontrati nell’ultimo anno. Per le prime tre voci della sezione “Politica Monetaria”, le bande per definire il colore sono simmetriche (valori in positivo e in negativo). I dati riportati provengono dal database Thomson Reuters. Infine, la tendenza mostra la dinamica in atto e viene rappresentata dalle frecce: ↑,↓, ↔ indicano rispettivamente miglioramento, peggioramento, stabilità rispetto alla rilevazione precedente.
Disclaimer: Le informazioni contenute in questa pagina sono esclusivamente a scopo informativo e per uso personale. Le informazioni possono essere modificate da finriskalert.it in qualsiasi momento e senza preavviso. Finriskalert.it non può fornire alcuna garanzia in merito all’affidabilità, completezza, esattezza ed attualità dei dati riportati e, pertanto, non assume alcuna responsabilità per qualsiasi danno legato all’uso, proprio o improprio delle informazioni contenute in questa pagina. I contenuti presenti in questa pagina non devono in alcun modo essere intesi come consigli finanziari, economici, giuridici, fiscali o di altra natura e nessuna decisione d’investimento o qualsiasi altra decisione deve essere presa unicamente sulla base di questi dati.

Lo scopo di questo contributo è valutare il rendimento dei BTP Futura che è stato lanciato dallo Stato Italiano ed è in sottoscrizione presso i risparmiatori retail.
I BTP Futura saranno emessi alla pari, cioè a 100 Euro, e hanno due caratteristiche principali:
I tassi cedolari definitivi saranno annunciati alla chiusura del collocamento, non potranno comunque essere inferiori ai tassi cedolari minimi garantiti appena annunciati. Inoltre, il tasso cedolare dei primi 4 anni resterà invariato, mentre in base alle condizioni di mercato potranno essere rivisti a rialzo i tassi successivi.
Per comprendere meglio il valore del premio fedeltà, consideriamo la serie storica del PIL ai prezzi di mercato (Figura 1, i valori riportati sono in milioni di Euro (106)), e calcoliamo la variazione media annua percentuale del PIL nei dieci anni precedenti – da qui in avanti indicata semplicemente come variazione media (Figura 2; a titolo esemplificativo, per l’anno 2020 consideriamo la media della variazione percentuale del PIL dal 2010 al 2019).
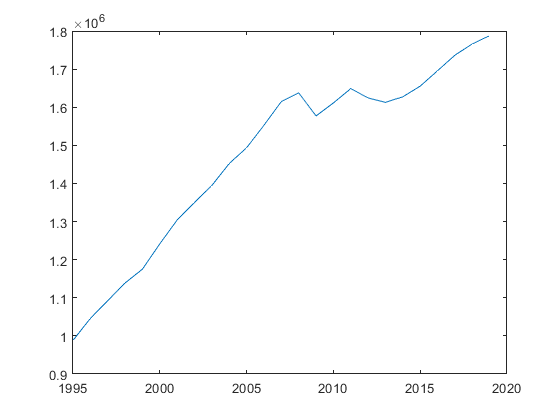
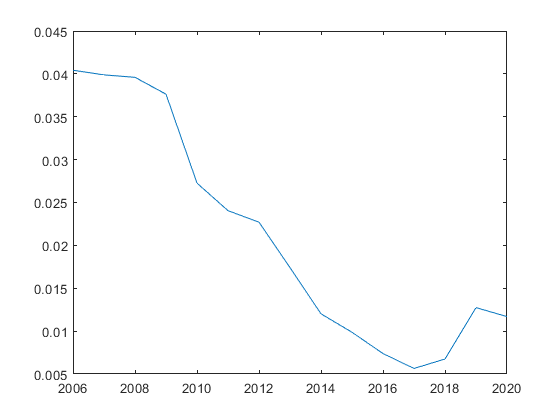
La variazione media del PIL italiano ha un trend decrescente negli anni, con un rimbalzo nell’ultimo periodo, principalmente dovuto all’uscita dalla finestra di calcolo del periodo della crisi finanziaria del 2007-2009. Negli ultimi 5 anni la variazione media nell’arco del PIL è stata inferiore all’1% in tre casi e 1.27% è stato il suo valore massimo.
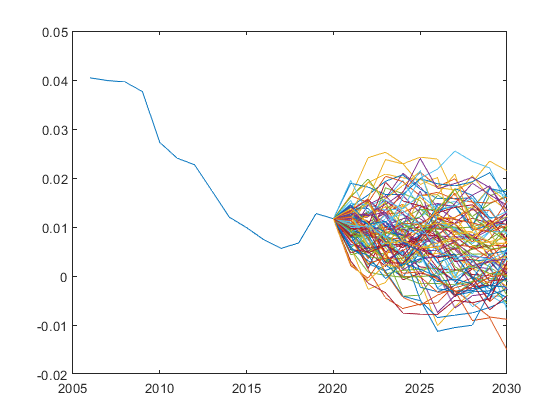
Abbiamo effettuato 1.000.000 simulazioni dell’andamento della curva della variazione media su un orizzonte temporale di 10 anni, ipotizzando un modello di Vasicek per il saggio di crescita media del PIL. il modello di Vasicek è un modello matematico solitamente utilizzato per l’evoluzione dei tassi di interesse a breve ed è descritto dall’equazione differenziale stocastica
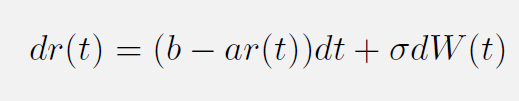
dove W(t) è un processo di Wiener. Si tratta di un modello di tipo mean-reverting, cioè tiene conto della tendenza dei valori descritti del modello ad essere “attratti” verso un valore medio di lungo periodo. Questa caratteristica rende il modello interessante per descrivere l’evoluzione del PIL nella sua componente ciclica. Le traiettorie delle simulazioni sono riportate nella Figura 3.
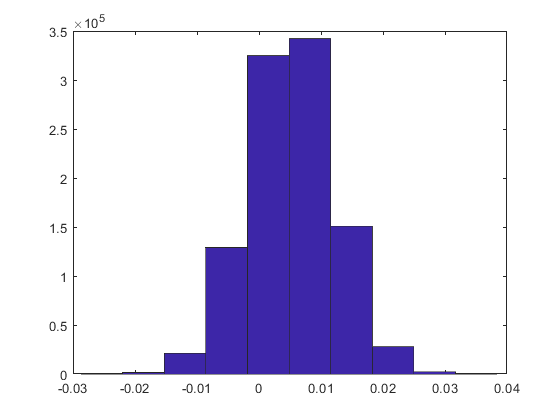
La distribuzione di probabilità del valore medio del saggio di crescita del PIL dal 2020 al 2029, cioè il valore che verrà usato per il calcolo del premio di fedeltà, è riportata nella Figura 4: la probabilità che la variazione media sia
Pertanto, secondo le nostre simulazioni, il premio fedeltà sarà pari a 1% con una probabilità del 75%. Sottolineiamo che l’ultimo dato disponibile utilizzato è stato il PIL del 2019, quindi questi dati non tengono in considerazione l’effetto COVID.
Ipotizzando le cedole pari al valore minimo annunciato Venerdì 3 Luglio
consideriamo quattro scenari:
Nel primo caso, valutando il titolo ai dati di mercato del 2 Luglio 2020 (curva dei tassi di interesse dei titoli di Stato italiani), il prezzo di mercato del titolo risulta essere pari a 100.17, quindi in linea con il prezzo di emissione. Il tasso interno di rendimento del titolo (rendimento) è 1.28% che coincide il rendimento decennale italiano.
Nel secondo scenario il prezzo di mercato del titolo è pari a 101.05: l’investitore che compra questi titoli con la certezza di detenerli fino a scadenza li compra a sconto rispetto al loro valore effettivo. In questo caso il rendimento del titolo è pari a 1.38%, 10 punti base sopra al rendimento di mercato dei titoli a 10 anni emessi dallo Stato italiano. Il rendimento del titolo passa all’1.47% ipotizzando una variazione media del Pil pari al 2%, e all’1.56% se la variazione sarà pari o superiore al 3%.
Possiamo quindi concludere che, se verranno confermate le cedole annunciate, i BTP Futura hanno rendimenti in linea con il mercato nel caso di assenza di premio di fedeltà. Il premio fedeltà corrisponde ad un aumento del rendimento di 10 punti base nel caso più probabile (premio fedeltà pari a 1%).
