After a first phasing out of the ECB’s net asset purchases at end-2018, the question of how a future tightening of the ECB’s monetary policy…
https://www.ecb.europa.eu//pub/pdf/scpwps/ecb.wp2416~908859ad17.en.pdf
After a first phasing out of the ECB’s net asset purchases at end-2018, the question of how a future tightening of the ECB’s monetary policy…
https://www.ecb.europa.eu//pub/pdf/scpwps/ecb.wp2416~908859ad17.en.pdf
We investigate how central counterparties (CCPs) manage counterparty credit risks. CCPs play a key role in clearing derivative trades…

The previously slow-moving journey of banks towards digitization has recently undergone a sharp acceleration, mainly boosted by the need to comply with security requirements raised to cope with COVID-19 emergency. As Italian retail banks begin to understand their social impact, they need to undertake an evolutionary path towards an offer of services covering customer needs at 360° and during their whole life cycle through an increasingly adoption of an open banking model.
This challenge requires banks to gradually embrace the digital and “open” transformation, by following steps that will shape their future role (see figure below).
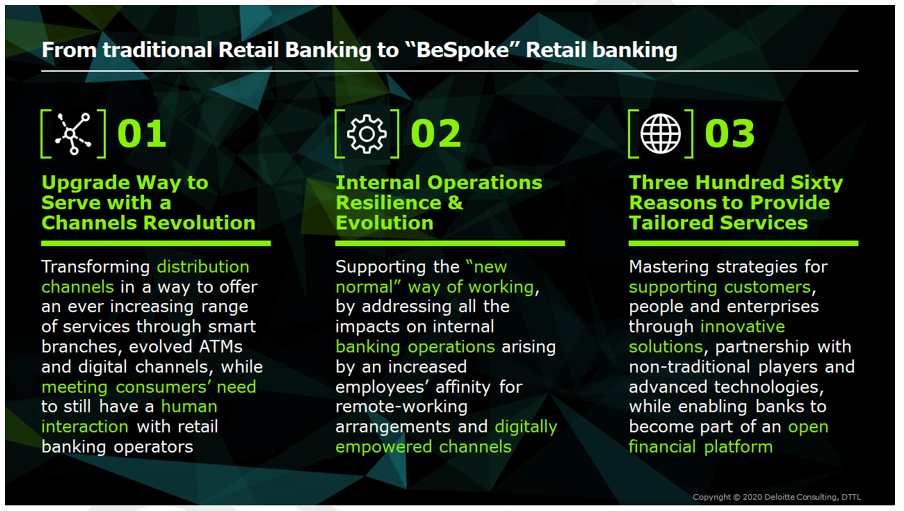
1. Upgrade Way to Serve with a Channels Revolution
The new normal will change the interactions between people that will be more inclined to use digital channels and work remotely. However, there is still a customer segment (seniors, boomers) who prefers traditional banking channels, especially for handling complex or advisory services (see figure below[i]).
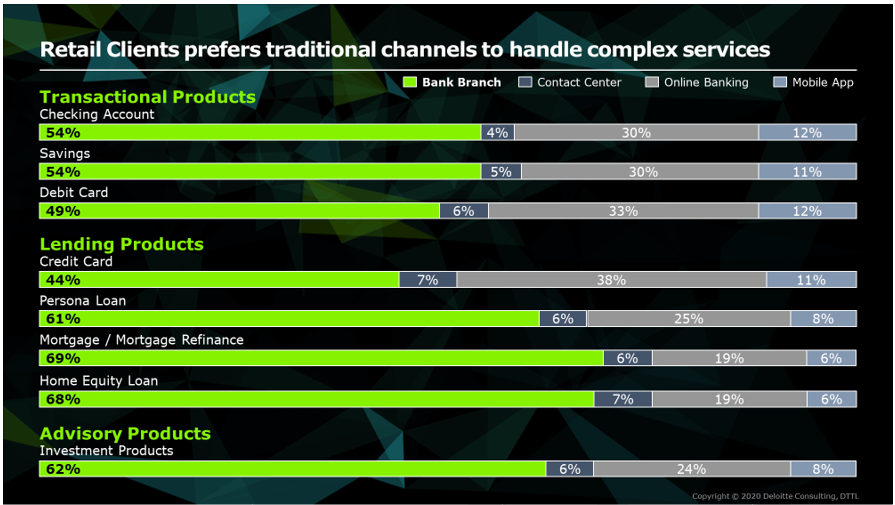
Meeting the needs of those reluctant to use remote channels while riding the recent digitalization boost means rethink distribution channels with the goal of an ever-increasing number of digital services and products.
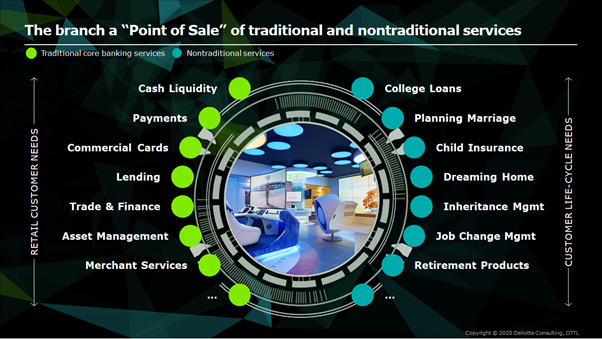
Retail banks will not get rid of the physical branch, despite having to deal with the revolution of branch’s concept. Future branches will embed both technological advancements and human touch, enabling a high level customer experience (see figure below). Moreover, the hybrid combination of non-banking services with core banking advisory will turn some strategically selected branches into “personal services shops”. Besides being downsized, key branches’ internal space will be redesigned, allowing them to be points of sale, addressed to offer also a non-banking experience based on networking and people caring (cross-product advisory, coffee houses, non-banking events, and interactive walls).
In order to optimize footprint, some branches will be dismissed or substituted with “ATM 2.0”, equipped with video-based technology providing 24/7 real time value added operations. Moreover, different banks will be able to share the same ATM 2.0 to reduce operational costs.
The “How to serve” revolution cannot be complete without strengthening digital channels at an even higher rate than physical ones. Trends show how consumers are increasingly inclined to handle banking operations through smart devices, especially smartphones. In a mobile-dominant world, the challenge is to expand the virtual offering by adding self-management features (eased onboarding procedures, automated spending analysis, goal based savings tools, instant notifications) and turning mobile channels into differentiator to build sticky experiences.
Digital channels will be even more appealing with solutions able to replicate human touch and tailored advisory services experienced in branches. Both the direct interaction with experts and an augmented experience through assisted tools will be possible through person-to-person solutions such as Videobanking and Contact Centre evolution.
2. Internal Operations Resilience & Evolution
The complete remotization of channels entails significant impacts on every aspect of bank operating models, specifically looking at employee’s way of working, back office processes and the overall adoption of digital-enabling technology.
From “work from home” to “Smart Working 2.0”
Due to the COVID-19 emergency, nearly 2 million Italians have started working from home. However, the results of the sudden transformation of almost 9% of people in employment into a small army of remote workers are homes turned into sketchy offices, with uncomfortable chairs, poor internet connections (or smartphones’ hot-spot connection), and inadequate tools to manage calls and videoconferences (personal laptops, trial versions of collaboration tools).
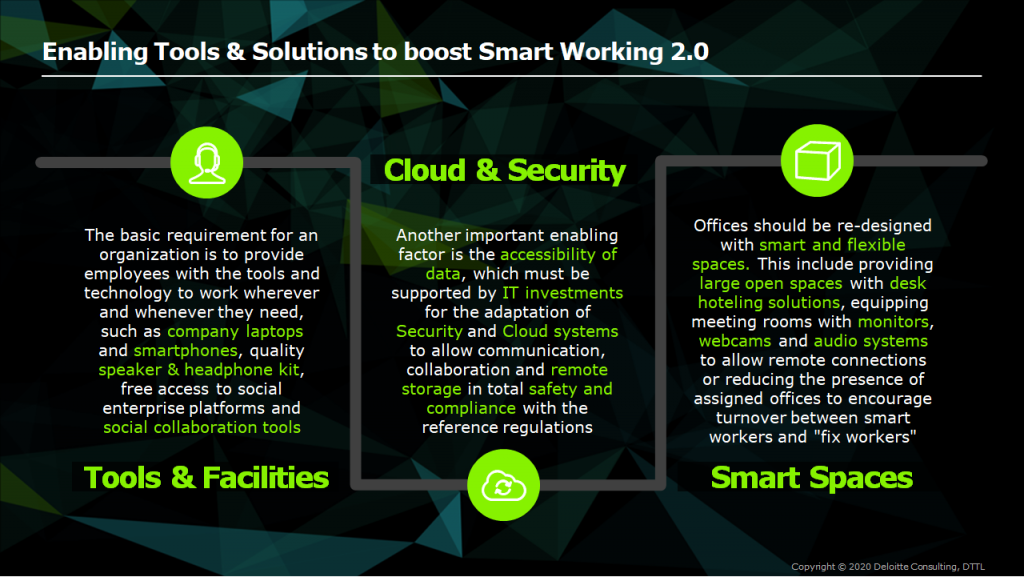
This is everything but smart. Smart working means investing in innovative tools (facilities, IT technologies, Cloud Solutions) and, especially when it will be possible to return safely to the office, physical offices re-design and spaces re-organization (see figure below).
Before launching an effective “Smart Working 2.0” program, banks need to leverage on digital analytics solutions to identify organization’s jobs and tasks that can be remotely executed, and those with a low-likelihood of non-proximity.
Boost digitization of Core Banking Process
While much of the focus of digital transformation to date has addressed front office and digital customer channels, the gradual remotization of banking products and services requires a redesign of underlying core banking processes. Efforts to transform customer-facing systems and solutions are limited without equally effective and integrated back office operations.
Banks can deploy E2E targeted technology solutions, to identify back office bottlenecks, streamline processes, detect opportunities to introduce technology and automation solution and improve the customer experience, while reducing operational costs.
To maximize operational efficiency while maintaining a high level of customer satisfaction, banks should appropriately balance their automation degree, introducing technologies and machines supposed not to replace employees but augmenting their capability, allowing them to enlarge the range of tasks that could be remotely executed and be more customer-focused. This means spending less time “pushing paper” as automation frees up time for them to serve as trusted advisors, giving the chance to expand person-to-person remotely contacts.
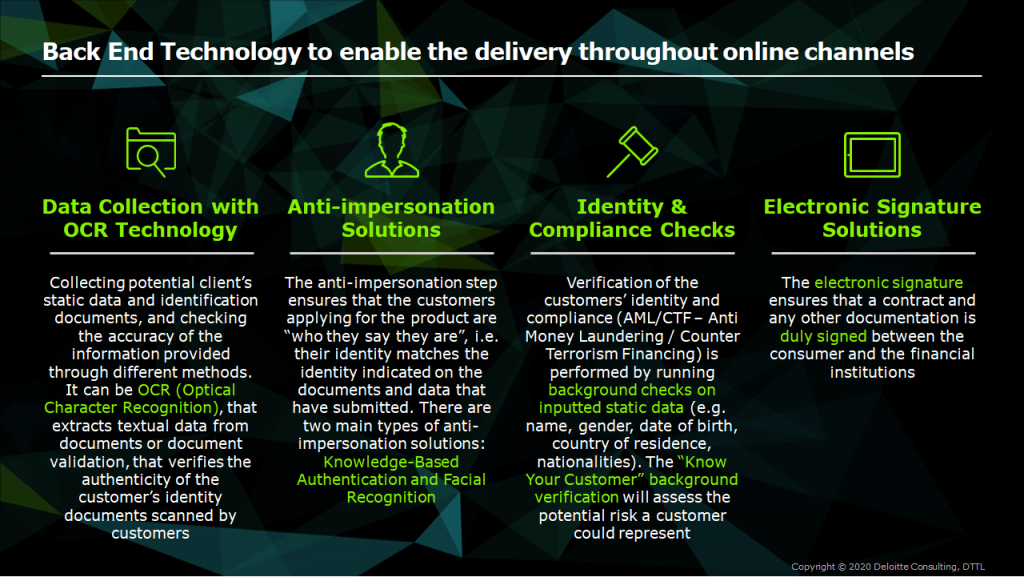
Moreover, the path to digitized core banking processes, require dedicated technologies and capabilities (see figure below)[1] that enable the delivery of banking products and service throughout online channels, with high level of security and low level of risk.
Upskilling & Reskilling Revolution
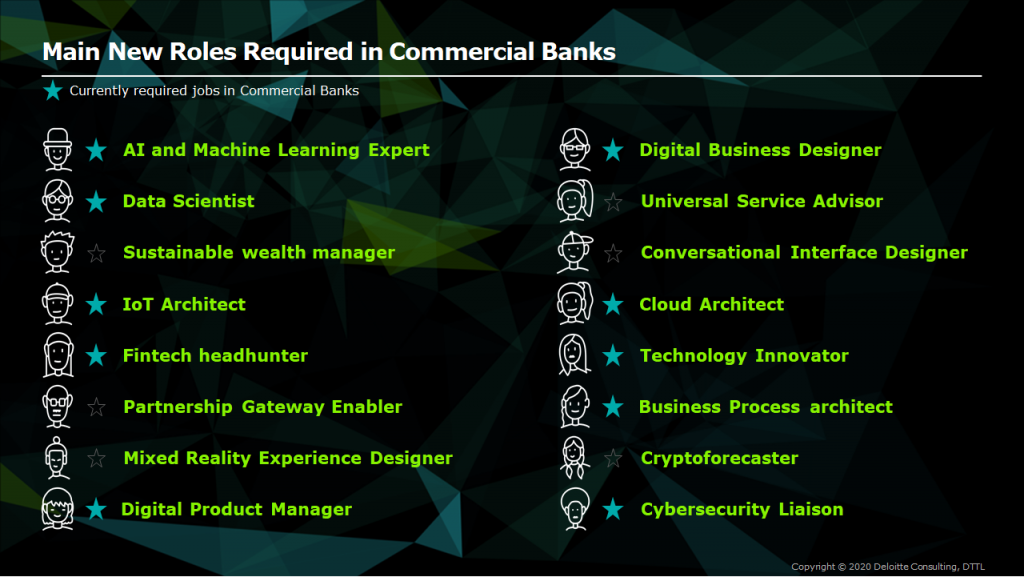
Banks should consider also impacts of process digitization and automation on human resources and new skills and capabilities required. Digital transformation decreases demand for classic jobs and raises demand for new skillsets.
Financial institutions need to activate their “Digital DNA”, launching structured reskilling and upskilling programs for employees with designing methods and tools to map and evaluate knowledge and customize employees’ learning experience to aid the evolution of jobs and roles toward a digital workplace (see figure below)[2][3].
Path to Technological Resilience[4]
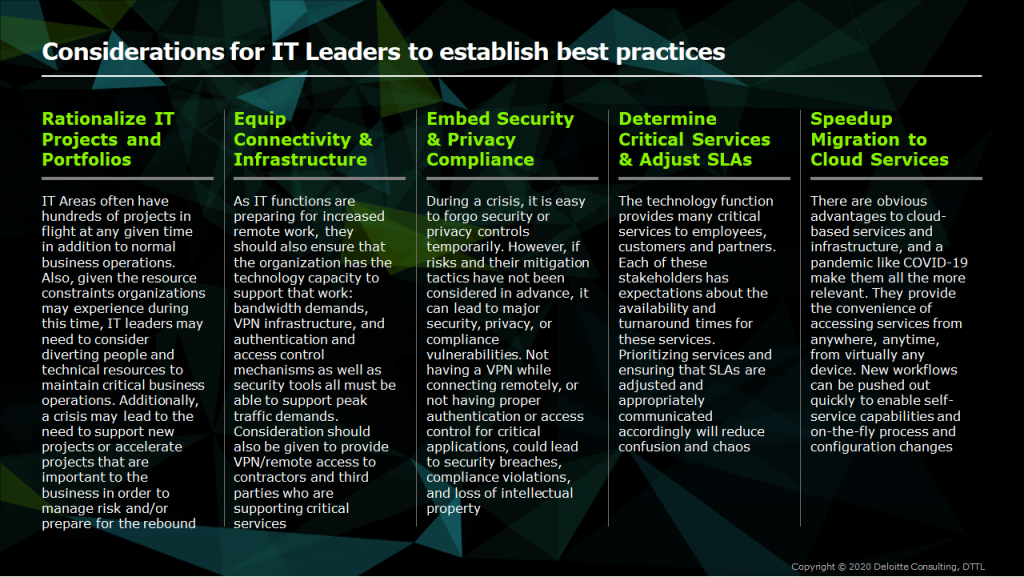
Besides leading their function through this crisis, as technology is increasingly embedded into business processes, technology leaders have also the critical responsibility to drive the entire enterprise through this transformation.
Since digital leaders are both required to ensure core banking process operation throughout this crisis and support the identified key-business areas, to respond to the immediate challenge ahead, they need to devise their strategies and execute them across five key dimensions[5] (see Figure below).
3. Three Hundred Sixty Reasons to Provide Tailored Services
Driven by the limitations adopted to mitigate COVID-19 effects, retail banks already started to offer complementary services (information, healthcare, education …) far from traditional ones. Banks can now take advantage of this push towards non-banking services to implement a market repositioning strategy, and start to provide offers increasingly addressed to satisfying at 360° all consumers’ needs along their whole lifecycle.
New credit channels for SMEs
In Italy, the legislative framework has already evolved in response to the crisis, requiring loosened constraints for credit to SMEs[6] and leading retail banks to simplify internal bureaucratic processes to request a subsidized loan.
Beyond legal requirements, to deal with the increase in operational activities resulting from credit requests, retail banks should reshape internal processes and policies linked to loan products. By consolidating the pre-existing trend of approaching technological players and internalizing analytical and forecasting skills, future banks will be empowered with an optimized demand/capacity planning management[7]. Strategic partnership with Peer-to-peer lending, Crowdfunding or Invoice Trading platforms would also free up the creation of SME-dedicated credit distribution channels, while reducing costs thanks to economies of scale.
Customized financial assessments based on SMEs’ actual needs will be possible by combining traditional banking analysis with AML, risk monitoring tools and big data. The same technologies will be useful in anticipating businesses’ financial difficulties[8] and in mitigating banks’ risks, allowing contracts’ renegotiation if certain clauses are real-time intercepted and verified.
Boost towards Digital Payments Solutions
According to Pierluigi Lopalco, epidemiologist head of the anti-coronavirus task force in Puglia, COVID-19 would be an opportunity to abolish cash and to limit the use of ATMs and cards that contributes to the contagion spread. Since nowadays any payment can be made through smartphone, digital payments boost due to COVID-19 emergency is only an acceleration of an ongoing trend[9] (see figure below).
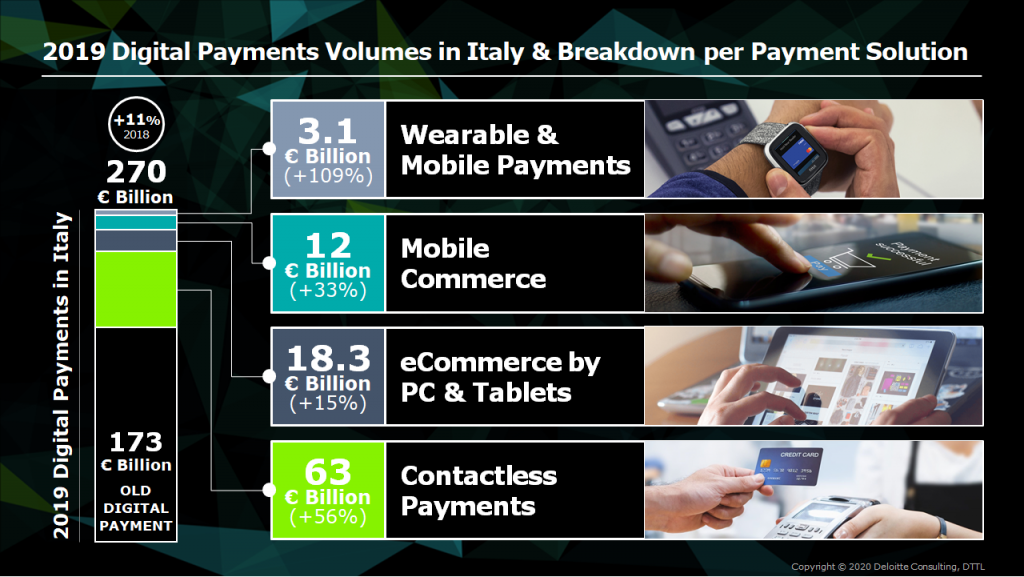
To ride the digital payments wave, banks’ are challenged to drive the large slice of old digital payment tools users (around 173 billion €) towards innovative and more efficient payment instruments.
Raising the limits set for contactless payments to further reduce physical contact with the POS and the average time at the checkout (e.g. in the UK the limit has already been raised from £30 to £45[10]) depends on banks’ ability to push and coordinate institutions and Italian Payment circuit players (MasterCard, Visa, Amex). A further acceleration can be gained with a contactless migration process for all issued cards not equipped with NFC chips for contactless payment.
Since the increased use of wearable devices (In Italy + 64 Million € vs ly[11]) also contribute in facilitating contactless payments, banks should move into wearable payment technology by increasing investments in strategic partnerships and services such as Apple Pay, Google Pay and Android Pay.
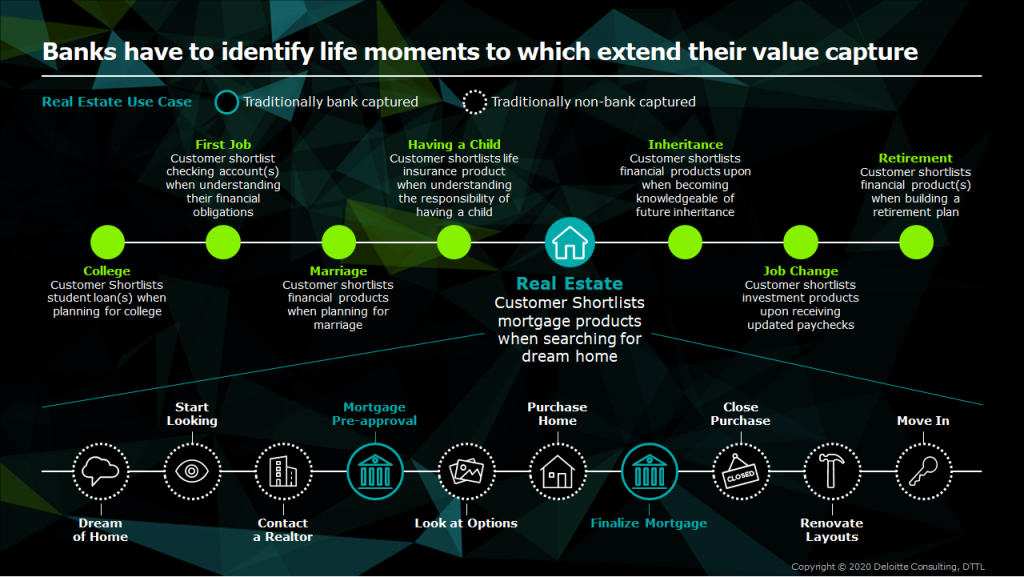
Extend value to fulfill all customers’ needs
The traditional banking system can certainly count on pre-technological advantages (customer base, investment capacity, ability to activate or acquire skills)[12]; however, for each product/service, customers can nowadays count on emerging players providing digital and streamlined offers[13].
To be truly competitive, banks should abandon usual business patterns and fit into customers’ journeys covering all lifecycle phases (see figure below[14]).
Conclusion
Retail banks’ distribution channels, balanced with a synergistic combination of human touch and digital innovation, will also become aggregating poles of disruptive ideas to create new service lines, through branches and digital channels[15]. Meanwhile, technology leaders’ proficiency in addressing the digitalization of core banking processes, while driving banks’ employees towards a revolutionary way of working, will enrich bank’s ability to be an intermediary in meeting customers’ need with a forward looking perspective.
Beyond consolidating partnership with third economic players to support businesses recovery and people security, retail banks will be increasingly part of a broader interconnected ecosystem, embedding also non-financial services. The adoption of an Open Finance model, strengthened with data analytics, will allow information available through open APIs to be externally exposed and processed, continuously freeing up insights for customized services[16].
Retail banks will therefore become multi-offer platforms, distributing value-added products[17] not only along their customers’ lifecycle but also along that of community and businesses, with the chance to actively play a social role starting from recovery phase.
Authors:
– Paolo Gianturco, Senior Partner Deloitte Consulting
– Alessandro Vidussi, Senior Partner Deloitte Consulting
– Mariangela Zingaropoli, Director Deloitte Consulting
– Riccardo Cascinu | Senior Consultant Deloitte Consulting
– Elisa Matarrese | Consultant Deloitte Consulting
– Gianluca Sapio | Consultant Deloitte Consulting
– Federica Crozzolin | Consultant Deloitte Consulting
[1] Deloitte – Paper “Digital Onboarding for Financial Services”
[2] Deloitte – Paper “Digital era Technology Operating Models”
[3] HSBC, Report “Banking in the Future”
[4] Deloitte – Paper “COVID-19, People, technology, and the path to organizational resilience”
[5] Deloitte – Online Post by Alessandro Mercuri “Smart working vuol dire anche Cloud e sicurezza”
[6] ABI – Comunicazione – Decreto-legge 8 aprile 2020 n. 23 – Finanziamenti bancari per la liquidità fino a 25.000 euro garantiti dal Fondo di garanzia per le PMI – Articolo 13, comma 1, lettera m)
[7] Deloitte – Paper – Commercial Banking: COVID-19 Support Services
[8] Deloitte – Paper – Commercial Banking: COVID-19 Support Services
[9] Osservatori Digital Innovation, Politecnico di Milano – Report “Osservatori Innovative Payment 2020”
[10] Uk Finance – Online Post “Contactless limit in UK to be increased to £45”
[11] Osservatori Digital Innovation, Politecnico di Milano – Report “Osservatori Innovative Payment 2020”
[12] Prospettive – “The Bank as a Platform – Financial Services Industry is going through a period of rapid change, as global forces are redefining the entire concept of “the bank,” and in turn, banking – C. Murolo
[13] Aziendabanca – “Per l’open banking serve una vision imprenditoriale” – A.G. (March, 2020)
[14] Deloitte – Presentation – Exploring Open Banking
[15] Il sole 24 ore – Online Post “Nasce il nuovo polo della finanza innovativa: Plug and Play con Nexi e UniCredit”
[16] Deloitte – Online Post by C. Murolo “The Bank as a Platform”
[17] Wall Street Italia – Online Post “Per le banche retail la sfida è iniziata”
[i] Deloitte – Paper “Accelerating digital transformation in banking”
Siamo lieti di informarvi che a Novembre 2020 ripartirà il Percorso Executive in Finanza Quantitativa (XI edizione) del MIP.
Il Percorso executive in Finanza Quantitativa si propone di fornire competenze complete ed approfondite per operare in diversi ambiti: Gestione dei portafogli, Valutazione di prodotti finanziari, Trading di prodotti finanziari, Gestione del rischio.
Il percorso è rivolto a PROFILI JUNIOR: laureati (di I e II livello) in economia, ingegneria, fisica, matematica ed altre discipline scientifiche, che intendono acquisire una formazione completa nell’ambito della finanza quantitativa in vista dell’inserimento nel mondo del lavoro. E anche a PROFILI EXECUTIVE: professionisti e operatori con esperienza lavorativa nel settore finanziario che desiderano completare la loro formazione o che intendono riqualificarsi al fine di cercare nuove opportunità lavorative attraverso la frequenza dell’intero percorso o dei singoli moduli.
Vi informiamo inoltre che le selezioni consisteranno in un colloquio motivazionale che si svolgerà via video in modalità asincrona; tramite questo colloquio verranno comprese le motivazioni che portano i candidati a proporsi per il percorso. Inoltre verranno poste alcune domande aperte per comprendere le competenze tecniche di base del candidato in forma scritta.
Il team di Recruitment sarà a vostra completa disposizione per maggiori dettagli in merito al calendario didattico, al processo di application e per valutare insieme il Percorso Executive ed è raggiungibile all’indirizzo fq@mip.polimi.it . La brochure del percorso è scaricabile al seguente link.
Laszlo Hanyecz has the honor of conducting the first commercial Bitcoin transaction: trading 10,000 bitcoin for about $30 worth of pizza…
On 5 May 2020 the ECB issued a press release indicating that the Governing Council had taken note of the judgement issued by the German Federal Constitutional Court…
https://www.ecb.europa.eu//press/govcdec/otherdec/2020/html/ecb.gc200522~fe18ad121a.en.html
Governments have put forward swift and significant emergency lifelines to protect people in response to the pandemic…
The Public Statement provides recommendations on areas of focus identified by ESMA and highlights…

L’iniziativa di Finriskalert.it “Il termometro dei mercati finanziari” vuole presentare un indicatore settimanale sul grado di turbolenza/tensione dei mercati finanziari, con particolare attenzione all’Italia.
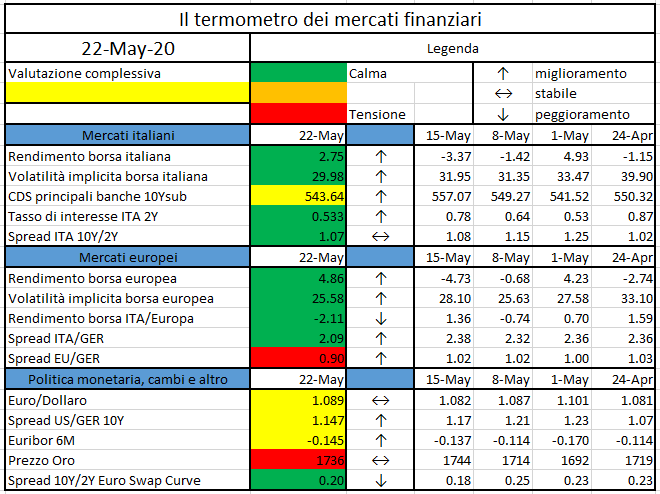
Significato degli indicatori
I colori sono assegnati in un’ottica VaR: se il valore riportato è superiore (inferiore) al quantile al 15%, il colore utilizzato è l’arancione. Se il valore riportato è superiore (inferiore) al quantile al 5% il colore utilizzato è il rosso. La banda (verso l’alto o verso il basso) viene selezionata, a seconda dell’indicatore, nella direzione dell’instabilità del mercato. I quantili vengono ricostruiti prendendo la serie storica di un anno di osservazioni: ad esempio, un valore in una casella rossa significa che appartiene al 5% dei valori meno positivi riscontrati nell’ultimo anno. Per le prime tre voci della sezione “Politica Monetaria”, le bande per definire il colore sono simmetriche (valori in positivo e in negativo). I dati riportati provengono dal database Thomson Reuters. Infine, la tendenza mostra la dinamica in atto e viene rappresentata dalle frecce: ↑,↓, ↔ indicano rispettivamente miglioramento, peggioramento, stabilità rispetto alla rilevazione precedente.
Disclaimer: Le informazioni contenute in questa pagina sono esclusivamente a scopo informativo e per uso personale. Le informazioni possono essere modificate da finriskalert.it in qualsiasi momento e senza preavviso. Finriskalert.it non può fornire alcuna garanzia in merito all’affidabilità, completezza, esattezza ed attualità dei dati riportati e, pertanto, non assume alcuna responsabilità per qualsiasi danno legato all’uso, proprio o improprio delle informazioni contenute in questa pagina. I contenuti presenti in questa pagina non devono in alcun modo essere intesi come consigli finanziari, economici, giuridici, fiscali o di altra natura e nessuna decisione d’investimento o qualsiasi altra decisione deve essere presa unicamente sulla base di questi dati.
L’iniziativa di Finriskalert.it “Il termometro dei mercati finanziari” vuole presentare un indicatore settimanale sul grado di turbolenza/tensione dei mercati finanziari, con particolare attenzione all’Italia.
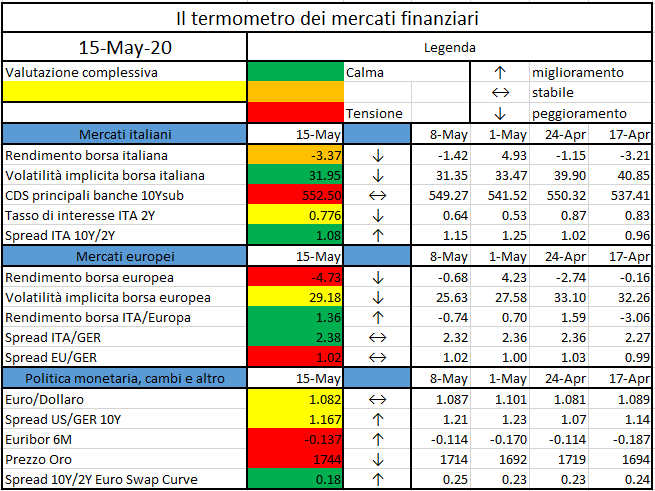
Significato degli indicatori
I colori sono assegnati in un’ottica VaR: se il valore riportato è superiore (inferiore) al quantile al 15%, il colore utilizzato è l’arancione. Se il valore riportato è superiore (inferiore) al quantile al 5% il colore utilizzato è il rosso. La banda (verso l’alto o verso il basso) viene selezionata, a seconda dell’indicatore, nella direzione dell’instabilità del mercato. I quantili vengono ricostruiti prendendo la serie storica di un anno di osservazioni: ad esempio, un valore in una casella rossa significa che appartiene al 5% dei valori meno positivi riscontrati nell’ultimo anno. Per le prime tre voci della sezione “Politica Monetaria”, le bande per definire il colore sono simmetriche (valori in positivo e in negativo). I dati riportati provengono dal database Thomson Reuters. Infine, la tendenza mostra la dinamica in atto e viene rappresentata dalle frecce: ↑,↓, ↔ indicano rispettivamente miglioramento, peggioramento, stabilità rispetto alla rilevazione precedente.
Disclaimer: Le informazioni contenute in questa pagina sono esclusivamente a scopo informativo e per uso personale. Le informazioni possono essere modificate da finriskalert.it in qualsiasi momento e senza preavviso. Finriskalert.it non può fornire alcuna garanzia in merito all’affidabilità, completezza, esattezza ed attualità dei dati riportati e, pertanto, non assume alcuna responsabilità per qualsiasi danno legato all’uso, proprio o improprio delle informazioni contenute in questa pagina. I contenuti presenti in questa pagina non devono in alcun modo essere intesi come consigli finanziari, economici, giuridici, fiscali o di altra natura e nessuna decisione d’investimento o qualsiasi altra decisione deve essere presa unicamente sulla base di questi dati.
