The theme of the conference ‘European Economic and Monetary Union: the first and the next 20 years’ gives us wide scope to share some of our thoughts. We have much to learn from the last twenty years…
The cost of secondhand cryptocurrency mining equipment in China has nearly doubled in recent weeks as a result of bitcoin’s price jump over the same period…

Introduzione
L’innovazione tecnologica sta oggi radicalmente modificando le modalità di approccio delle società all’evoluzione del business. Se nel recente passato era possibile ottenere vantaggi competitivi sul mercato in modo reattivo, ora tale approccio non può più funzionare. È necessario riuscire ad individuare i trend maggiormente in grado di rispondere alle esigenze in costante mutamento degli attori nel mercato e intervenire proattivamente, per riuscire a ottenere un vantaggio competitivo.
La blockchain attualmente è uno degli hot topic nel mondo dell’innovazione. Il crescente trend di interesse relativo a questa nuova tecnologia che avrà impatti in tutte le principali industry, aumentando efficienza, trasparenza e sicurezza
è dimostrato dai dati.
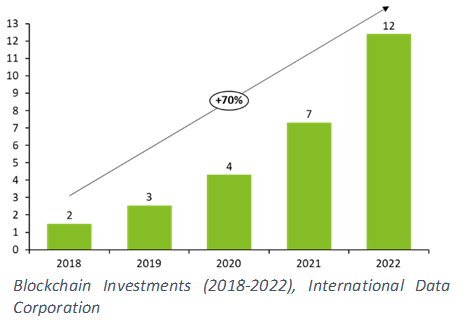
Secondo uno studio effettuato dall’International Data Corporation, le spese annuali per progetti blockchain raggiungeranno a livello globale $12.4 mld entro il 2022, primariamente nell’industria dei servizi finanziari.
La crescente attenzione verso le opportunità connesse a tale tecnologia è certamente notevole se si considera che fino a pochissimi anni fa la parola “blockchain” era conosciuta solamente per la sua connessione con le criptovalute. Oggi invece si parla sempre più di certificazione, tracciabilità e token economy.
Deloitte’s 2018 global blockchain survey
Nella Global Blockchain Survey 2018 di Deloitte emerge come, nonostante la blockchain non sia ancora una tecnologia pienamente matura con impatti pervasivi nel business, il processo di affermazione e diffusione della stessa stia aumentando esponenzialmente. Le ipotesi accademiche sviluppate nel corso degli ultimi 5 anni stanno cominciando a trovare un riscontro nella realtà e l’attenzione principale della ricerca si sta spostando dall’apprendimento delle caratteristiche intrinseche della tecnologia verso l’esplorazione di potenzialità e realizzazione di prototipi che abbiano una applicazione di business.
L’indagine, svolta su un campione di 1.053 società con fatturato pari ad almeno a $500 milioni dislocate in 7 paesi (Canada, Cina, Francia, Germania, Messico, Regno Unito e Stati Uniti), ha permesso di raccogliere le opinioni e percezioni su blockchain e il suo potenziale impatto nel futuro.
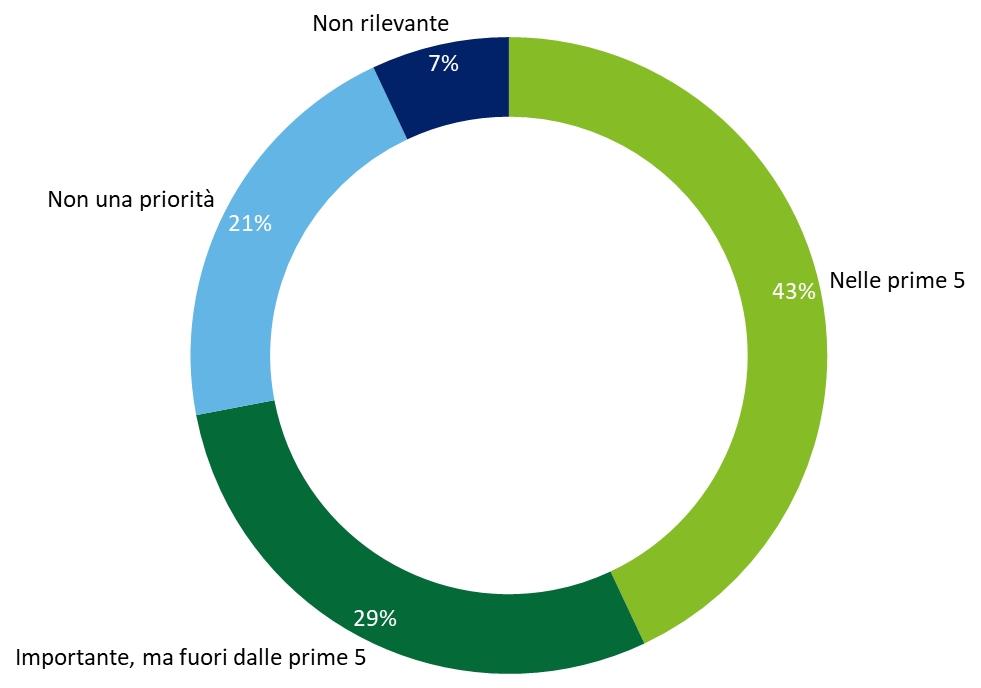
A livello strategico, emerge come l’adozione della blockchain rientri tra le top priorities per il 43% dei rispondenti, mentre solo il 7% non ne percepisce la rilevanza per il proprio business [tab 1]. A conferma di ciò, il 39% delle società intervistate nel corso del 2019 effettuerà investimenti per più di $5 mln al fine di comprendere come integrare tale tecnologia nei propri processi di business [tab 2]. I principali vantaggi competitivi ravvisati dagli intervistati sono relativi alla prospettiva di velocizzare maggiormente le operazioni di trasmissione delle informazioni al fine di arrivare ad una condivisione in tempo reale, ottenendo così una maggiore efficienza operativa. Altro aspetto cruciale è la volontà di esplorare le opportunità di questa tecnologia con l’obiettivo di creare nuovi modelli e standard di processo nelle industry di riferimento garantendo una maggiore sicurezza rispetto ai tradizionali sistemi informativi [tab 3]. Gli ambiti sui quali le compagnie stanno ponendo maggiormente attenzione sono indirizzati verso soluzioni relative a supply chain, Internet of Things, digital identity e digital records [tab 4].


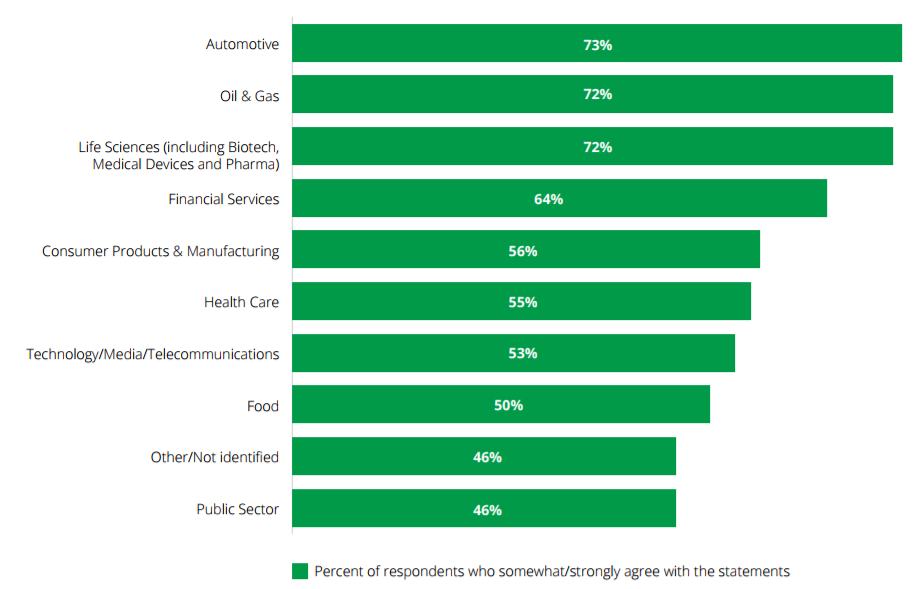
I numeri mettono in evidenza come la blockchain avrà impatti in diversi settori. I financial services (64%) sono una industry che potrà beneficiare dall’adozione della tecnologia, tuttavia altri settori come Automotive (73%), Oil & Gas (72%) e Life Sciences (72%) potranno avere impatti considerevoli.
Blockchain nei servizi finanziari: alcuni esempi di casi d’uso
A livello pratico, i registri distribuiti e decentralizzati hanno il potenziale di ridisegnare il modo in cui le istituzioni finanziarie interagiscono tra loro e con i relativi stakeholders (regolatori e clienti in primis). Questa tecnologia per sua natura ha una valenza consortile per cui gli ambiti di applicazione in molti casi vanno letti e interpretati immaginando un contesto di collaborazione tra diversi soggetti per ottenere benefici tangibili. Secondo Deloitte i principali casi d’uso nell’industria finanziaria sono i seguenti:
- Scambio di Valore: Blockchain (Bitcoin)è nata per gestire transazioni economiche peer to peer tra soggetti diversi. Attorno alle criptovalute sono nate negli ultimi anni molti servizi innovativi che vanno dal credito come nel caso di Nexo.io (Instant Crypto Credit line) ai pagamenti; il recente JP Morgan Coin mira a diventare uno strumento di pagamento interbancario, per ora in fase di test con un gruppo selezionato di clienti istituzionali. Sono inoltre moltissimi i servizi nati esclusivamente “Crypto” (wallet, exchange, trading platforms, …) che con l’avvento di Lightning Network (layer tecnologico di secondo livello che aumenta tramite i suoi payment channels la scalabilità del protocollo Bitcoin) porteranno una vera e propria disruption nel settore dei pagamenti.
- Immutabilità: Il timestamping è il primo e vero caso d’uso che sfrutta la potenzialità della tecnologia; un registro distribuito tamper-proof e censorship-resistant che garantisce l’immutabilità e la marca temporale di una transazione o di una informazione. Il Timestamping ha l’obiettivo di assicurare l’integrità dei dati delle transazioni finanziarie su modelli blockchain-based, al fine di garantire la loro immutabilità verso le autorità di vigilanza mediante la generazione di un hash value (codice non-reversibile), firma digitale della transazione, salvato in modo immutabile all’interno di un blocco della catena insieme all’indicazione relativa a data e ora. Ciò consente a potenziali verificatori di comprovare l’effettiva transazione avente riferimenti temporali ben definiti. Il timestamping, unito all’Internet of Things sta ampliando i campi di sperimentazione creando soluzioni di tracciabilità anche in altri settori come il lusso (LVMH è un esempio recente) o la tracciabilità della filiera produttiva nel mondo del food.
- Identity management: Il tema della gestione dell’identità online è comunemente noto come un processo lungo e costoso. Nel caso di servizi finanziari quali prestiti mutui o assicurazioni, è necessario infatti attivare un processo di acquisizione delle informazioni che richieda un livello di sicurezza elevato e conforme alle normative di Know Your Customer (KYC), di cui le banche e assicurazioni sono direttamente responsabili, relativamente alla profilazione dell’utente in termini di situazione finanziaria ed esperienze pregresse nel mercato finanziario. L’adozione della tecnologia blockchain a supporto dei financial services non implica necessariamente rendere pubblici i dati sensibili, ma al contrario dare la possibilità all’utente di gestire in autonomia la propria identità (Le soluzioni di self sovereign identity della Sovrin foundation ne sono un’esempio), condividendo solo le informazioni strettamente necessarie, avendo l’opportunità di rendere disponibili i medesimi claim con più soggetti ridisegnando completamente le fasi del KYC.
- Smart contract/token: protocolli che consentono di eseguire autonomamente accordi e transazioni commerciali, senza la necessità dell’intervento di intermediari ed il cui funzionamento è garantito da un algoritmo. Sono contratti scritti in linguaggio informatico intellegibile da appositi software che vengono attivamente interrogati al verificarsi di determinate condizioni al fine di far rispettare specifiche clausole contrattuali. We.trade, piattaforma tecnologica nata da un consorzio di 8 anche per sviluppare il caso d’uso di trade finance su open account ne è un’esempio. Nel mondo Insurance questa cosa è stata sfruttata da AXA con il caso Fizzy che ha lanciato la prima assicurazione viaggio su blockchain. L’utilizzo degli smart contract si collega a un altro aspetto chiave connesso alla tecnologia blockchain: la Tokenization.
Tokenization
Deloitte crede che la tokenizzazione possa essere tra gli aspetti più rivoluzionari della blockchain. La tokenizzazione degli asset consiste nel processo di emissione di un token blockchain (in base alla tipologia di token si può parlare di security, utility o hybrid token offering) rappresentante digitalmente un bene negoziabile “reale”. Da qui sono nate nel corso del tempo le Initial Coin Offering (ICO) e oggi le Security Token Offering (STO). Queste ultime sono caratterizzate dall’emissione di token che hanno come sottostante un bene fisico e/o strumenti finanziari. Tale token può quindi essere utilizzato per creare una rappresentazione digitale di un asset, che sia esso un’azione, un fondo, un bond o addirittura la proprietà di un bene immobiliare o una frazione di esso: i token, infatti, danno la possibilità ad ogni investitore di acquistare o vendere percentuali molto piccole dell’asset sottostante. È importante sottolineare come il possesso di un security token comprenda gli stessi diritti e responsabilità legali di uno strumento finanziario comune, oltre ad un immutabile registro dei passaggi di proprietà.
Questa nuova frontiera permette di creare “Token Economies”, ovvero un mondo finanziario nuovo nel quale cambia il ruolo degli intermediari e lo scambio di beni si realizza in modalità peer to peer. In alcuni casi, asset o mercati tradizionalmente illiquidi possono assumere, grazie alla tecnologia caratteristiche più liquide sostituendo le classiche partecipazioni tramite equity.
Grazie agli smart contract, la transazione dei token avviene in modo automatico, riducendo le complessità amministrative presenti oggi nei processi di acquisizione/vendita e riducendo il numero di intermediari e dei costi legati alla transazione.
Ma quali sono i principali ostacoli di questo processo? In primis, va sottolineato sicuramente l’aspetto regolamentare: preso atto che un security token è composto dalle medesime caratteristiche di uno strumento finanziario, esso ricade in complesse normative che variano in base alla giurisdizione e che regolano non solo l’offerta iniziale al pubblico di investitori, ma anche gli scambi sul mercato secondario (MiFID, AML, KYC).
Inoltre, sono in corso in diversi paesi (Malta, Francia, UK) alcune consultazioni finalizzate a delineare delle chiare linee guida e regolamentazioni su come i security token debbano essere considerati a livello normativo/legale. In Italia la Consob ha emesso il 19 marzo un documento che si pone l’obiettivo di avviare un dibattito a livello nazionale sul tema delle offerte iniziali e degli scambi di cripto-attività in attesa della definizione in ambito europeo di un condiviso orientamento circa la qualificazione giuridica dei crypto-asset.
Nonostante la presenza di ostacoli, che potrà essere superata solo grazie al supporto dei diversi attori coinvolti lungo tutta la catena del valore, la nascita di una token economy rappresenta sicuramente una possibilità che le istituzioni finanziare necessitano di esplorare in profondità. Esse dovranno definire a quale ruolo ambiscono all’interno di quella che sarà una nuova catena del valore. Potrebbero concentrarsi sull’offerta di servizi di consulenza sulla strutturazione dei token, fungere da custodian bank per le chiavi private ed i wallet, offrire servizi di mantenimento account o agire come piattaforme di distribuzione.
Saranno le istituzioni che investono approcciando la tecnologia in modo metodico e continuativo, a guidare il futuro dei mercati finanziari.
Quali rischi?
Le opportunità di business connesse a questa tecnologia sono numerose e, in alcuni casi, molto promettenti: il crescente entusiasmo connesso all’utilizzo della blockchain sta favorendo l’aumento delle sperimentazioni e i tentativi di implementazione.
A queste nuove possibilità si affiancano, però, nuovi rischi: per cogliere realmente le opportunità emergenti di cui la blockchain e le distributed ledger technology sono fautrici è necessario costruire negli attori interessati una maggiore consapevolezza dei rischi connessi all’adozione di questa nuova tecnologia. Emerge sempre più l’importanza di chiedersi se i modelli blockchain-based possano effettivamente apportare una riduzione dei rischi o se, invece, non siano a loro volta portatori di nuove criticità non ancora pienamente percepite ed esperite. Una mancata corretta mitigazione dei rischi potrebbe, infatti, comportare il fallimento di progetti potenzialmente virtuosi e innovativi.
Prima di tutto, le istituzioni e le società sono tenute a valutare se posizionarsi come early adopters di questa tecnologia o se sia più corretto posticiparne l’adozione, in attesa di una sua maggiore maturazione. In entrambi i casi, i possibili scenari che ne scaturiscono sono molto vari e possono manifestare impatti non indifferenti sullo sviluppo del business stesso.
Sebbene i modelli blockchain-based siano contraddistinti dalla sicurezza delle transazioni, non è possibile affermare lo stesso circa la sicurezza dei wallet e degli account: i database distribuiti e la crittografia consentono di prevenire la corruzione dei dati internamente storati, ma gli account risultano, invece, suscettibili al rischio di account takeover o di perdita delle chiavi di accesso.
Conclusioni
La blockchain costituisce una delle innovazioni più discusse e maggiormente sotto i riflettori negli ultimi anni: è, infatti, riscontrabile sul mercato una crescente attenzione circa le possibilità di applicazione di questa tecnologia.
Il settore finanziario rientra tra quelli che maggiormente potranno essere impattati da questa tecnologia e, infatti, si registrano ad oggi diverse sperimentazioni e casi d’uso. Un processo che merita particolare attenzione è sicuramente quello della Tokenization, ovvero la tramutazione di beni fisici e strumenti finanziari in forma digitale in una logica di scambio peer-to-peer.
Oggi la tecnologia blockchain è ancora nelle sue prime fasi di sviluppo anche se sta già dimostrando benefici tangibili in alcuni casi d’uso molto specifici. Dal punto di vista tecnologico due aspetti fondamentali come adozione e infrastruttura sono ancora in piena evoluzione e risulta al momento difficile fare previsioni sulla sua evoluzione futura.
Per arrivare a una sua comune adozione la strada è ancora lunga: sarà necessaria un’attenta valutazione dei rischi connessi al suo utilizzo e la definizione di una normativa regolamentare che possa essere globalmente condivisa.
Autori
Paolo Gianturco – Senior Partner Deloitte, Head of FinTech & FS Tech – EMEA Blockchain Lab co-leader
Gabriele Tamburini – Manager, Deloitte Blockchain Lab
Marco Mione – Senior FinTech Specialist Deloitte
Ilaria Calò – Consultant Deloitte
Marco Corti – FinTech Analyst Deloitte
Matteo De Stefani – FinTech Analyst Deloitte ng 2 Accent 5

Il Rapporto è curato da Nadia Linciano, Angela Ciavarella, Rossella Signoretti, CONSOB, ed è disponibile al link:www.consob.it/web/area-pubblica/rcg2018. Le opinioni espresse sono personali e non impegnano in alcun modo l’Istituzione di appartenenza.
L’ultimo Rapporto Consob sulla corporate governance delle società quotate italiane conferma alcune caratteristiche degli assetti proprietari delle imprese domestiche, a fronte di cambiamenti innescati da evoluzioni regolamentari e di mercato. A fronte della perdurante bassa contedibilità delle società quotate italiane …
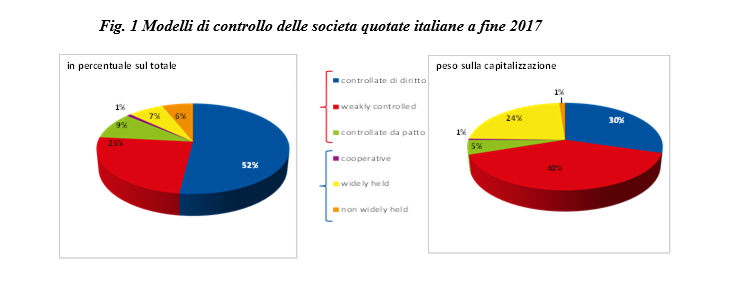
Alla fine del 2017 la maggior parte delle 231 società quotate sull’MTA è controllata o da un singolo azionista (177 emittenti a fronte di 181 nel 2010), con una prevalenza del modello di controllo familiare e pubblico (rispettivamente, 145 e 23 imprese rappresentanti il 34% della capitalizzazione di mercato; Fig. 1). La quota media detenuta dal principale azionista è pari al 47,7%, superiore al valore del 2010, pari al 46,2%, mentre il mercato detiene in media una quota di capitale del 40%.
… continua a ridursi l’incidenza dei patti e delle strutture piramidali…
Le imprese controllate da più azionisti aderenti a un patto parasociale sono, a fine 2017, 22 (51 nel 2010), mentre quelle appartenenti a strutture piramidali o miste sono il 19% circa del listino (Fig. 2).
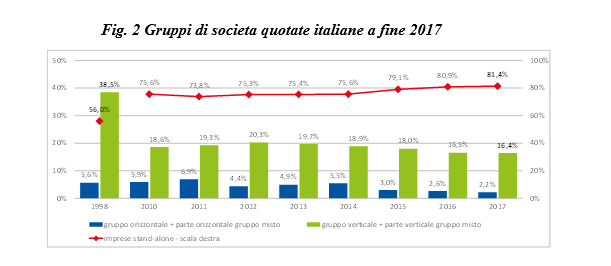
… mentre la separazione tra proprietà e controllo realizzata attraverso loyalty shares e azioni a voto multiplo interessa soprattutto le società di minori dimensioni.
Per quanto riguarda le deviazioni dalla regola ‘one-share-one-vote’, a giugno 2018 le società i cui statuti prevedono azioni a voto multiplo e loyalty shares sono, rispettivamente, 3 e 41. Alla fine dell’anno precedente, le società i cui azionisti hanno maturato la maggiorazione del diritto di voto sono 14, con una divergenza tra diritti di voto e diritti ai flussi di cassa di circa il 14%. Si conferma, infine, l’incidenza marginale delle azioni di risparmio, emesse da 17 imprese.
Le caratteristiche dei boards continuano a cambiare, anche per effetto dell’applicazione della legge sulle quote di genere.
A giugno 2018 la presenza femminile raggiunge il 36% del totale degli incarichi di amministrazione e il 38% degli incarichi di componente degli organi di controllo, in entrambi i casi registrando i massimi storici per effetto dell’applicazione della Legge Golfo-Mosca – legge 120/2011 (Fig. 3). La maggioranza degli emittenti ha già riservato al genere meno rappresentato la quota di un terzo dei componenti del board, sia nel caso delle società giunte al secondo e al terzo rinnovo del board successivo alla legge (rispettivamente 156 e 24 con una presenza femminile pari al 36%) sia nel caso degli emittenti al primo rinnovo, a cui è applicabile la quota di genere di un quinto (31 casi, 35% di donne in CdA); il dato si riscontra anche nelle società non soggette alla legge 120/2011 in quanto neoquotate e nelle imprese che hanno già completato i tre rinnovi previsti dalla legge (complessivamente 17 casi, 33% di donne in CdA).
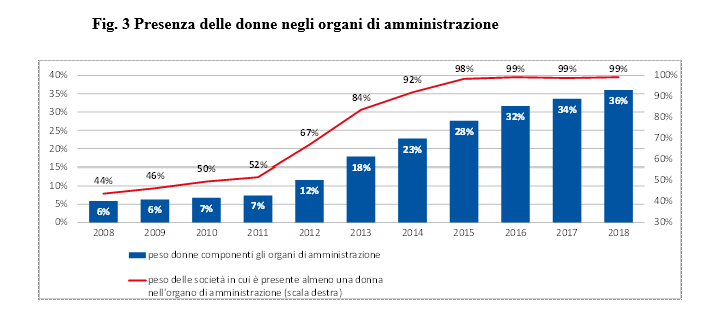
Per effetto dell’ingresso delle donne, sono aumentate le percentuali di amministratori laureati o con un titolo post-lauream, è cresciuta la diversificazione del profilo professionale (meno manager e più professionisti e accademici), mentre sono diminuite l’età e la presenza di amministratrici legate all’azionista di riferimento da una relazione familiare (quest’ultima ha raggiunto il minimo storico dell’11% circa).
Con riferimento ai ruoli ricoperti, mentre aumenta rispetto al passato la quota di donne qualificate come indipendenti (72% a metà 2018 a fronte del 69% nel biennio precedente), si riduce lievemente il numero di casi in cui una donna ricopre la carica di amministratore delegato (14 dai 17 rilevati a giugno 2011). È infine in crescita l’interlocking femminile, la cui incidenza si attesta, a giugno 2018, al 38% (era circa il 19% nel 2013).
In prospettiva, un impulso alla board diversity potrà venire anche dagli obblighi di rendicontazione non finanziaria.
Il d.lgs. 254/2016, e il relativo regolamento attuativo della Consob, recepisce nel nostro ordinamento la direttiva 2014/95/EU, introducendo l’obbligo di pubblicare una dichiarazione non finanziaria (DNF) e richiedendo alle società di fornire informazioni sulle politiche eventualmente adottate in materia di board diversity. Nel 2018, 151 società quotate hanno pubblicato una DNF, mentre 45 società (61,3% in termini di capitalizzazione di mercato) hanno istituito un comitato di sostenibilità. In 38 casi, le funzioni del comitato di sostenibilità sono abbinate con quelle di altri comitati (29 casi con comitato di controllo interno, presente nel 90% delle imprese).
Nel 2018, nelle 100 società quotate a più elevata capitalizzazione la stagione assembleare ha registrato i valori massimi di partecipazione degli investitori istituzionali …
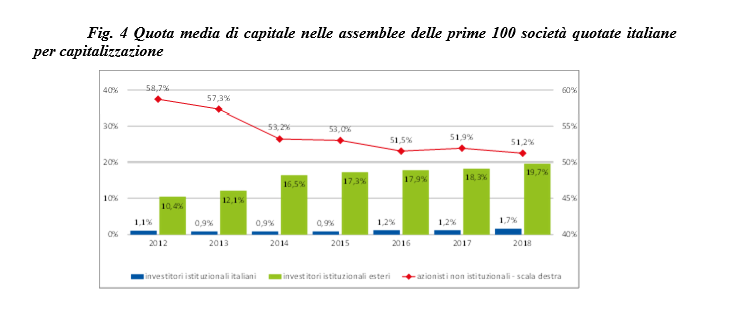
A fronte di una partecipazione alle assemblee mediamente pari al 72,6% del capitale sociale, gli investitori istituzionali hanno rappresentato oltre il 21% del capitale (in aumento del 2% rispetto all’anno precedente; Fig. 4). Fondi d’investimento, banche e assicurazioni italiane hanno preso parte al maggior numero di adunanze dal 2012 (81 assemblee, il doppio rispetto al 2012-2013) e con un maggior numero di azioni (3% dell’assemblea). Gli investitori istituzionali esteri, presenti dal 2015 a tutte le assemblee delle maggiori 100 società, hanno esercitato in media voti per il 29% del capitale presente in assemblea.
… il cui dissenso sulle politiche di remunerazione ha raggiunto il massimo dalla prima introduzione del say-on-pay.
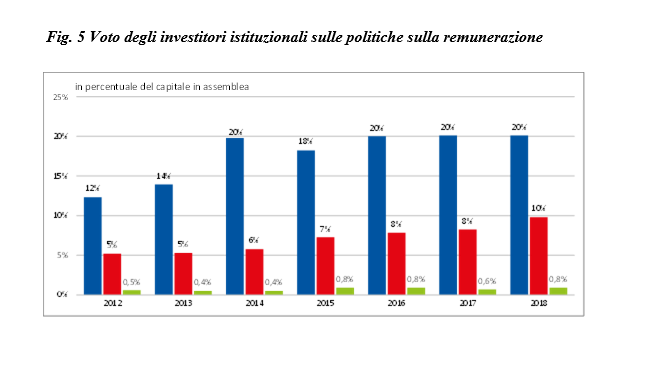
Con riguardo al voto sulle politiche di remunerazione (say-on-pay), gli investitori istituzionali hanno espresso voto favorevole con il 57% delle azioni complessivamente detenute, mentre i voti contrari e le astensioni dalla votazione hanno raggiunto, rispettivamente, il 38,7% e il 2,3% delle azioni. Il dissenso, classificato nel Rapporto come somma di voti contrari e astensioni, ha raggiunto il valore più elevato dalla prima introduzione del say-on-pay (Fig. 5).

L’iniziativa di Finriskalert.it “Il termometro dei mercati finanziari” vuole presentare un indicatore settimanale sul grado di turbolenza/tensione dei mercati finanziari, con particolare attenzione all’Italia.
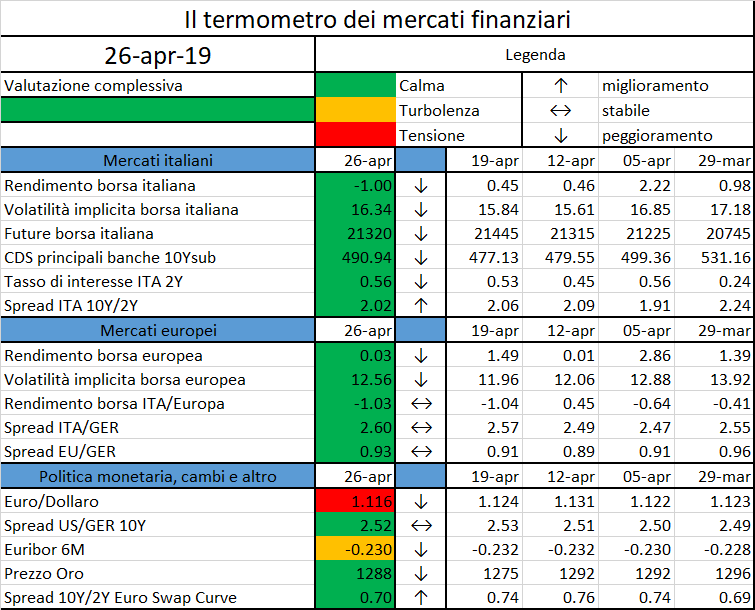
Significato degli indicatori
- Rendimento borsa italiana: rendimento settimanale dell’indice della borsa italiana FTSEMIB;
- Volatilità implicita borsa italiana: volatilità implicita calcolata considerando le opzioni at-the-money sul FTSEMIB a 3 mesi;
- Future borsa italiana: valore del future sul FTSEMIB;
- CDS principali banche 10Ysub: CDS medio delle obbligazioni subordinate a 10 anni delle principali banche italiane (Unicredit, Intesa San Paolo, MPS, Banco BPM);
- Tasso di interesse ITA 2Y: tasso di interesse costruito sulla curva dei BTP con scadenza a due anni;
- Spread ITA 10Y/2Y : differenza del tasso di interesse dei BTP a 10 anni e a 2 anni;
- Rendimento borsa europea: rendimento settimanale dell’indice delle borse europee Eurostoxx;
- Volatilità implicita borsa europea: volatilità implicita calcolata sulle opzioni at-the-money sull’indice Eurostoxx a scadenza 3 mesi;
- Rendimento borsa ITA/Europa: differenza tra il rendimento settimanale della borsa italiana e quello delle borse europee, calcolato sugli indici FTSEMIB e Eurostoxx;
- Spread ITA/GER: differenza tra i tassi di interesse italiani e tedeschi a 10 anni;
- Spread EU/GER: differenza media tra i tassi di interesse dei principali paesi europei (Francia, Belgio, Spagna, Italia, Olanda) e quelli tedeschi a 10 anni;
- Euro/dollaro: tasso di cambio euro/dollaro;
- Spread US/GER 10Y: spread tra i tassi di interesse degli Stati Uniti e quelli tedeschi con scadenza 10 anni;
- Prezzo Oro: quotazione dell’oro (in USD)
- Spread 10Y/2Y Euro Swap Curve: differenza del tasso della curva EURO ZONE IRS 3M a 10Y e 2Y;
- Euribor 6M: tasso euribor a 6 mesi.
I colori sono assegnati in un’ottica VaR: se il valore riportato è superiore (inferiore) al quantile al 15%, il colore utilizzato è l’arancione. Se il valore riportato è superiore (inferiore) al quantile al 5% il colore utilizzato è il rosso. La banda (verso l’alto o verso il basso) viene selezionata, a seconda dell’indicatore, nella direzione dell’instabilità del mercato. I quantili vengono ricostruiti prendendo la serie storica di un anno di osservazioni: ad esempio, un valore in una casella rossa significa che appartiene al 5% dei valori meno positivi riscontrati nell’ultimo anno. Per le prime tre voci della sezione “Politica Monetaria”, le bande per definire il colore sono simmetriche (valori in positivo e in negativo). I dati riportati provengono dal database Thomson Reuters. Infine, la tendenza mostra la dinamica in atto e viene rappresentata dalle frecce: ↑,↓, ↔ indicano rispettivamente miglioramento, peggioramento, stabilità rispetto alla rilevazione precedente.
Disclaimer: Le informazioni contenute in questa pagina sono esclusivamente a scopo informativo e per uso personale. Le informazioni possono essere modificate da finriskalert.it in qualsiasi momento e senza preavviso. Finriskalert.it non può fornire alcuna garanzia in merito all’affidabilità, completezza, esattezza ed attualità dei dati riportati e, pertanto, non assume alcuna responsabilità per qualsiasi danno legato all’uso, proprio o improprio delle informazioni contenute in questa pagina. I contenuti presenti in questa pagina non devono in alcun modo essere intesi come consigli finanziari, economici, giuridici, fiscali o di altra natura e nessuna decisione d’investimento o qualsiasi altra decisione deve essere presa unicamente sulla base di questi dati.
The crypto markets endured a loss of as much as $10 billion around 21:00 UTC on Thursday, following the NYAG’s allegations on Bitfinex and Tether…
https://www.coindesk.com/how-crypto-markets-are-reacting-to-the-tether-bitfinex-allegations
They study the effects of monetary shocks in a model of state-dependent price and wage adjustment based on “control costs”…
https://www.ecb.europa.eu//pub/pdf/scpwps/ecb.wp2272~38362298bc.en.pdf
The European Banking Authority (EBA) has updated its online Interactive Single Rulebook and Q&A tool with the inclusion of the Mortgage Credit Directive (MCD)…
https://eba.europa.eu/regulation-and-policy/single-rulebook/interactive-single-rulebook
The Bank of Korea and the Bank for International Settlements (BIS) co-hosted a conference on “Asia-Pacific fixed income markets: evolving structure, participation and pricing“…
Bitcoin’s price extended its recent gains today by spiking above $5,500 for the first time in over five months…


