The EBA has closed its formal investigation into a possible breach of Union law by the Estonian Financial Services Authority (Finantsinspektsioon) and the Danish Financial Services Authority (Finanstilsynet)…
Apr
23
2019
The EBA has closed its formal investigation into a possible breach of Union law by the Estonian Financial Services Authority (Finantsinspektsioon) and the Danish Financial Services Authority (Finanstilsynet)…
On 11 April 2019, the European Insurance and Occupational Pensions Authority (EIOPA) hosted its Fourth InsurTech Roundtable on “the use of cloud computing by (re)insurance undertakings”…
Global cross-border bank claims continued to expand at an annual pace of 1%. They rose by $134 billion during Q4 2018, to stand at $29 trillion at end-2018…

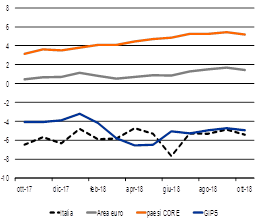
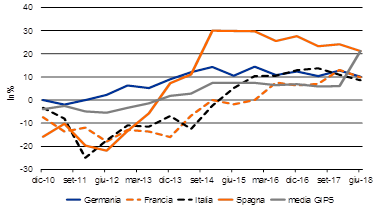
Il sistema bancario italiano sembra esser tornato a vivere un momento difficile. Come emerge dall’ultimo Rapporto Banche CER 2/2018, nel corso degli ultimi 12 mesi rilevati dalle statistiche, cioè tra ottobre 2017 e ottobre 2018, gli impieghi totali erogati dal sistema bancario italiano sono diminuiti del 3,2%, contro un aumento del 10,4% in Francia, dell’1,9% in Germania. L’Italia in questo quadro sembra essere il paese con più difficoltà sul fronte bancario. Guardando al dettaglio dei finanziamenti erogati alle imprese non finanziarie la situazione italiana ad una prima analisi appare ancora peggiore. Lo stock degli impieghi alle imprese ha segnato una variazione pari a circa il -5,4% ad ottobre 2018 (-6,5% ad ottobre 2017). Nei paesi core, che comprendono Germania, Francia e le altre nazioni dell’Europa centrale, la variazione è stata invece nell’ordine del +5,2% (grafico 1).
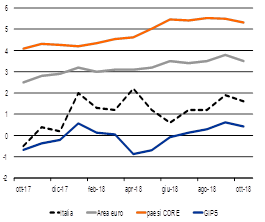
Queste dinamiche risentono però dei processi di cartolarizzazione. La cessione dei prestiti, che negli ultimi mesi ha riguardato in particolare i crediti dubbi, fa infatti diminuire dai bilanci la consistenza dei crediti erogati. Correggendo per effetto delle cartolarizzazioni si rileva che il credito alle imprese operanti in Italia da inizio anno è tornato ad aumentare (+1,6% ad ottobre 2018 – grafico 2).
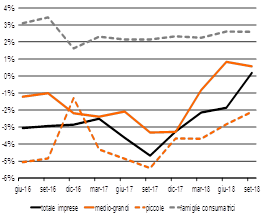
L’analisi in base alla dimensione delle imprese ci dice però che il miglioramento nell’erogazione del credito si è verificato soprattutto tra le imprese medio-grandi (grafico 3). Nel dettaglio, per le medio-grandi la variazione è stata lievemente positiva nel corso dei mesi centrali del 2018, mentre per le imprese di minor dimensione si continua a registrare una contrazione del credito (-2,1%) a settembre 2018.
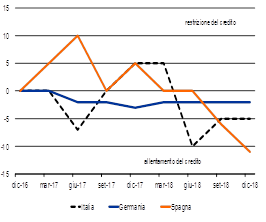
Per determinare quanto queste dinamiche siano influenzate da fattori di offerta e/o di domanda si possono in primo luogo osservare le indicazioni offerte dalla Bank Lending Survey (BLS), un’indagine che viene effettuata dal 2003, condotta dalle banche centrali nazionali insieme alla BCE, che viene rivolta alle principali banche dell’area euro. Nel questionario somministrato vi è una specifica domanda in cui gli intermediari possono esprimere le loro valutazioni sull’andamento della congiunturale del sistema creditizio. Con specifico riferimento alle PMI, si osserva che la le condizioni di offerta del credito alle PMI confermano un allentamento anche a fine 2018 in Italia, ma si nota un peggioramento rispetto ai trimestri precedenti (grafico 4).
Inoltre, le più recenti informazioni sul fronte del livello della domanda di credito, relative alla fine del 2017 e tratte dall’Indagine sull’accesso al credito delle PMI condotta dalla Bce e dalla Commissione Europea, non segnalano difficoltà di accesso al credito da parte delle PMI italiane. Il saldo tra le risposte di chi ha registrato un incremento del credito bancario rispetto a chi ha osservato una sua diminuzione è rimasto positivo per tutte le aree considerate. Tuttavia, nel grafico si osserva un peggioramento nelle ultime rilevazioni e l’Italia ora mostra il saldo peggiore (grafico 5).
In conclusione, rispetto alla precedente nota, si evince un rallentamento dell’attività creditizia in un contesto in cui gli istituti (sia quelli italiani che quelli europei) stanno attraversando pressioni cicliche e strutturali non indifferenti, che causano una diminuzione costante dei margini per via dei bassi tassi d’interesse a fronte di richieste di requisiti patrimoniali più elevati e di significativi investimenti imposti dalla sfida tecnologica.
Bibliografia
– CER, Rapporto Banche CER 2/2018

Nel pacchetto delle innovazioni introdotte da Mifid2 un posto in prima fila spetta alla product intervention. Prevista dagli artt. 40-42 del reg. 600/2014 (Mifir2), essa si condensa in una manciata di regole che, secondo le competenze, attribuiscono all’Esma (per i prodotti finanziari), all’Eba (per i depositi strutturati) e alle singole autorità nazionali (per entrambe le tipologie) il potere di inibire o restringere la commercializzazione o la distribuzione di determinati prodotti ovvero di vietare determinate tipologie d’attività o pratiche finanziarie.
Ben prima dell’entrata in vigore dell’impianto Mifid2, le autorità di sorveglianza disponevano, come tuttora dispongono, di analoghi poteri interdittivi, esperibili però soltanto in via cautelativa o sanzionatoria e nei confronti di singoli operatori. La product intervention segna un pesante cambio di passo. Le restrizioni non si adottano ad personam ma per la generalità degli operatori. Possono assumersi purché non compromettano l’efficienza dei mercati o non provochino effetti negativi sproporzionati ai benefici e non creino rischi di arbitraggio normativo (tradotto: adozione generalizzata per scongiurare il dirottamento delle operazioni in Stati non soggetti alla misura). La cifra dei presupposti che permettono all’autorità l’atto d’imperio è decisamente lata: “timore significativo” per la tutela degli investitori o per il funzionamento o l’integrità dei mercati, assenza o insufficienza di interventi delle autorità per sventare la minaccia o inadeguatezza delle norme.
Il sistema attuale rintraccia le sue più recenti origini nel 2011, annus horribilis della crisi finanziaria dell’eurozona: di fronte allo sfacelo creato dalle spregiudicate scorrerie di mercati molto probabilmente manipolati (ma i cui colpevoli resteranno impuniti), si pervenne al temporaneo divieto di vendite allo scoperto e di stipulazione di naked o multiple Cds, credit default swap sottoscritti anche in assenza della detenzione di un’esposizione creditoria da assicurare ovvero sottoscritti più volte a carico di una stessa reference entity ([1]). Non esisteva all’epoca una precisa norma che consentisse l’esercizio di un simile potere di blocco ma nessuno osò sollevare obiezioni: il momento era troppo drammatico per la tenuta economico-finanziaria dell’eurozona e chi aveva macinato utili attraverso l’uso improprio e irresponsabile di quegli strumenti nutriva ogni interesse a tacere. Il seme della product intervention, però, cominciò a germinare proprio in quel momento.
Il primo atto ufficiale si registra il 27 marzo 2018, quando l’Esma introduce un divieto di vendita al dettaglio di opzioni binarie e pone rigidi limiti alla stipulazione dei contracts for differences (Cfd).
L’opzione binaria e il Cfd sono derivati (anche se sulla prima potrebbe sollevarsi qualche legittimo dubbio) ad alto rischio intrinseco: l’opzione binaria consente di acquisire (o perdere) un dato valore fisso al formarsi di un differenziale sul fondamentale, il Cfd è invece un tipico derivato dotato di un forte effetto leva, naturale moltiplicatore di profitti e perdite rispetto al margine investito. Dal 2015 l’Esma e altre autorità centrali avevano appurato esagerate perdite causate da tali strumenti venduti alla clientela al dettaglio. Da qui la scelta di vietare le binarie e sottoporre a specifici limiti e protezioni i Cfd (livelli massimi di leva, chiusura automatica della posizione se il margine complessivo cala oltre il 50% di quello iniziale e, se ciò non bastasse causa repentini scostamenti di prezzo, blocco della perdita al livello del margine stesso). La misura entra in vigore il 22 maggio 2018, ma è temporanea, dura per tre mesi rinnovabili (e difatti rinnovati) e il 7 gennaio scorso la Consob mette in consultazione una proposta regolamentare volta a rendere permanenti le disposizioni Esma. La disciplina rispecchia i dettami Esma: la commercializzazione al dettaglio di opzioni binarie sarà radicalmente vietata, mentre quella dei Cfd sarà soggetta a forti restrizioni: limiti alla leva in relazione alla volatilità del sottostante (tra 30:1 per le valute e 2:1 per le cripto valute), chiusura obbligata di posizioni che registrino perdite superiori al 50% del margine, protezioni dal saldo negativo del conto cliente, divieto d’incentivare l’operatività, avviso standard sui rischi dello strumento con indicazione della percentuale di perdite subite dai clienti dell’offerente. L’autorità italiana non sta agendo di sua iniziativa. Il meccano tecnico-legale non è arduo da scoprire e la stessa Commissione lo rivela nel documento di consultazione: “l’Esma si aspetta che le autorità nazionali competenti adottino misure simili in via permanente sulla base dell’art. 42 Mifir affinché entrino in vigore dopo la scadenza delle sue decisioni e sta portando avanti azioni di coordinamento a tal fine”. È molto semplice: mentre le misure imposte dalle autorità sovranazionali hanno una durata temporanea, quelle adottate dalle autorità nazionali sono tendenzialmente perpetue, cioè revocabili solo se e quando vengano meno i presupposti della loro adozione. Il coordinamento di Esma è quindi finalizzato a tradurre l’intervento emergenziale in una regola omogenea e senza limiti di tempo su tutti i mercati Ue.
L’istinto porterebbe a salutare la product intervention come un prezioso anticorpo addizionale contro le degenerazioni del sistema. Una più meditata riflessione suggerisce l’opposto: la malcelata confessione della perdurante inefficienza della normativa, che non a caso – si è detto – integra uno dei presupposti alternativi per l’adozione dei provvedimenti. La nuova, sesquipedale e quasi barocca architettura disciplinare (due direttive, un regolamento attuativo e oltre trenta regolamenti delegati, senza contare le norme di attuazione interna) nasce dunque affetta da un morbo non debellabile: non c’è cura se non invocare un potere interdittivo e casuistico alle autorità.
Il caso di Cfd e opzioni binarie tiene a battesimo un azzardato stravolgimento del modello di regolamentazione e di controllo dei mercati finanziari. Indubbiamente quegli strumenti non superano il vaglio di adeguatezza per la maggior parte dei clienti retail ([2]) quindi la loro distribuzione al dettaglio poteva impedirsi proprio nel rispetto delle norme su informazione, appropriatezza e adeguatezza preesistenti a Mifid2 e su cui quest’ultima non è intervenuta. L’interdizione è la parimenti indubbia risposta all’elusione di quella disciplina. Ma ha un senso, invece di dare esecuzione alle norme esistenti, penalizzare ex abrupto un’intera fetta di mercato?
Sul piano formale, può dirsi istituzionalmente (e fors’anche costituzionalmente) corretto investire le autorità di controllo di un sostanziale ruolo di supplenza e correzione normativa? La potestà regolamentare di secondo livello può, entro i confini della norma primaria, specificare e attuare i precetti di quest’ultima ma non può sostituirvisi. Senza trascurare che l’intervento, apparentemente cautelare ma nei fatti modificativo della normativa primaria, genera il rischio di un’alterazione repentina degli equilibri del mercato e dello stesso interesse degli investitori, che dall’oggi al domani possono trovarsi spiazzati da una proibizione non calcolata.
Sul piano
sostanziale, la product intervention
si inscrive perfettamente nel solco di quella tendenza alla compartimentazione
soggettiva dei mercati in atto già da tempo. Dall’alta soglia di entrata per i
Fia riservati alla comunicazione Consob n. 0097996/2014 sulla distribuzione di
prodotti finanziari complessi ai clienti retail,
dal targeting di clientela
all’obbligo del monitoraggio costante del prodotto imposti dalla product governance, vincoli che possono
e debbono condurre anche alla soppressione della distribuzione di un dato
strumento su dati mercati, emerge nitida la scelta di risolvere il problema via sbarramento.
Tuttavia, mentre le disposizioni poc’anzi richiamate chiariscono sin dall’inizio
i perimetri distributivi, dunque rendono prevedibili e controllabili i processi
di selezione della clientela, la creazione di comparti inaccessibili al retail
per via amministrativa amplia imprevedibilmente questo sentiero azzardato.
Stimolare la consulenza indipendente e
rendere obbligatoria la condivisione fra intermediari e clienti dei
metodi di valutazione dei prodotti (sulla scia di quanto peraltro già la
disciplina Emir impone in tema di derivati): queste sarebbero scelte di market governance veramente efficienti. Affidare
alle mani del Principe il vasto potere di collocare improvvise barriere di
mercato non è una soluzione ma la confessione un fallimento normativo.
Significa ammettere che le norme non funzionano, nel senso che il sistema non
riesce a garantirne l’effettiva applicazione.
[1] Quest’ultima restrizione verrà poi riversata nel Reg. Ue 236/2012 14.3.2012 (integrato dai Regolamenti Delegati della Commissione UE nn. 826/2012 e 827/2012 del 29 giugno 2012, nn. 918/2012 e 919/2012 del 5 luglio 2012) che parimenti tornerà a consegnare le limitazioni operative all’intervento delle autorità.
[2] Un comunicato Consob del 7 febbraio 2017 già metteva in guardia il mercato contro i rischi connessi alla struttura e alla scarsa trasparenza sui prodotti in parola.

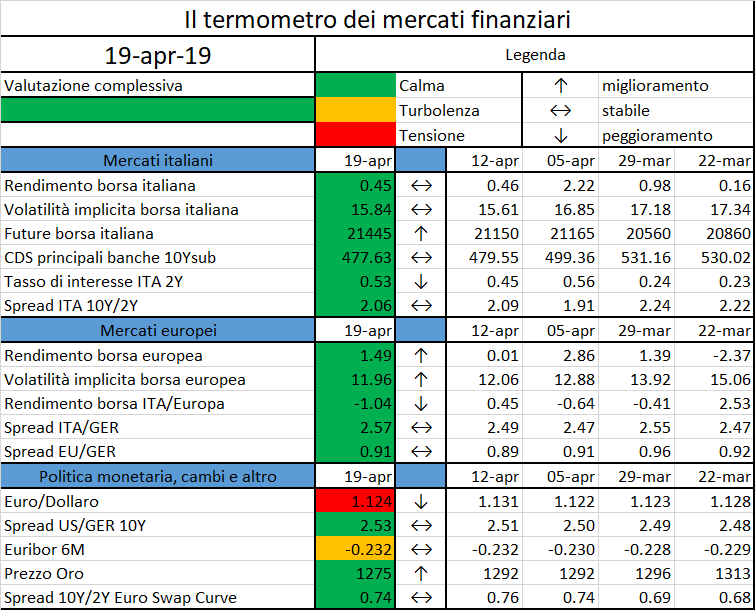
L’iniziativa di Finriskalert.it “Il termometro dei mercati finanziari” vuole presentare un indicatore settimanale sul grado di turbolenza/tensione dei mercati finanziari, con particolare attenzione all’Italia.
Significato degli indicatori
I colori sono assegnati in un’ottica VaR: se il valore riportato è superiore (inferiore) al quantile al 15%, il colore utilizzato è l’arancione. Se il valore riportato è superiore (inferiore) al quantile al 5% il colore utilizzato è il rosso. La banda (verso l’alto o verso il basso) viene selezionata, a seconda dell’indicatore, nella direzione dell’instabilità del mercato. I quantili vengono ricostruiti prendendo la serie storica di un anno di osservazioni: ad esempio, un valore in una casella rossa significa che appartiene al 5% dei valori meno positivi riscontrati nell’ultimo anno. Per le prime tre voci della sezione “Politica Monetaria”, le bande per definire il colore sono simmetriche (valori in positivo e in negativo). I dati riportati provengono dal database Thomson Reuters. Infine, la tendenza mostra la dinamica in atto e viene rappresentata dalle frecce: ↑,↓, ↔ indicano rispettivamente miglioramento, peggioramento, stabilità rispetto alla rilevazione precedente.
Disclaimer: Le informazioni contenute in questa pagina sono esclusivamente a scopo informativo e per uso personale. Le informazioni possono essere modificate da finriskalert.it in qualsiasi momento e senza preavviso. Finriskalert.it non può fornire alcuna garanzia in merito all’affidabilità, completezza, esattezza ed attualità dei dati riportati e, pertanto, non assume alcuna responsabilità per qualsiasi danno legato all’uso, proprio o improprio delle informazioni contenute in questa pagina. I contenuti presenti in questa pagina non devono in alcun modo essere intesi come consigli finanziari, economici, giuridici, fiscali o di altra natura e nessuna decisione d’investimento o qualsiasi altra decisione deve essere presa unicamente sulla base di questi dati.
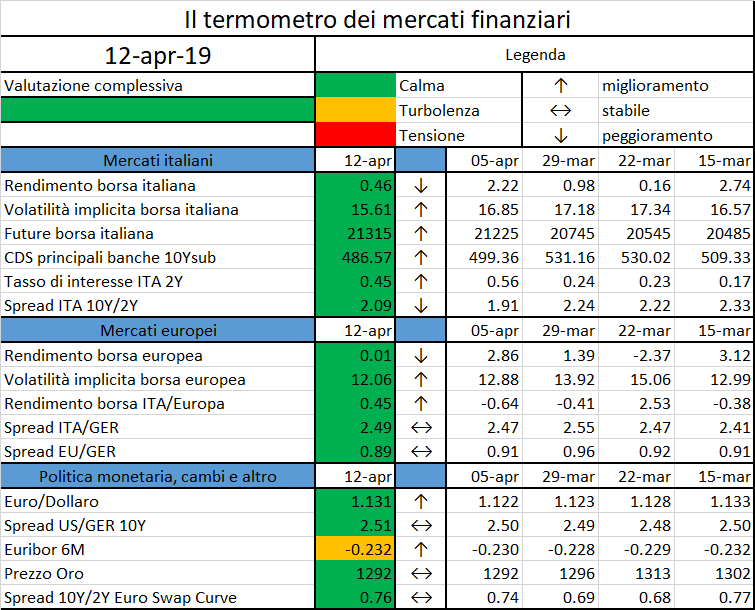

L’adeguamento ai requisiti MREL (Minimum Requirement for own funds and Eligible Liabilities), è una delle sfide più importanti che il sistema bancario Europeo dovrà affrontare. Sui possibili effetti del MREL per le banche italiane, una risposta è stata fornita dal Centro Europa Ricerche, nel Rapporto Banche CER 2/2018.
Uno studio della Banca d’Italia, basato sulla proposta di revisione della BRRD presentata dalla Commissione Europea alla fine del 2016, stima che al termine di un periodo di transizione ipotizzato di tre anni, le banche italiane potrebbero registrare una carenza aggregata di passività idonee tra i 30 e i 60 miliardi di euro, a seconda del grado di subordinazione del requisito tuttora in fase discussione. Le stime confermano la conclusione del rapporto dell’EBA riguardo l’ampia variabilità tra banche circa gli effetti sul costo della raccolta in relazione alla loro rischiosità e capacità di accesso al mercato.
Per approfondire gli effetti del MREL sul sistema bancario italiano, il CER ha analizzato i bilanci delle prime 9 banche in termini di totale attivo. La banca che nel 2017 deteneva più asset era Unicredit (826 miliardi di euro), seguita da Intesa-Sanpaolo (784 miliardi), Banco BPM (157 miliardi), MPS (139 miliardi) e UBI (125 miliardi).
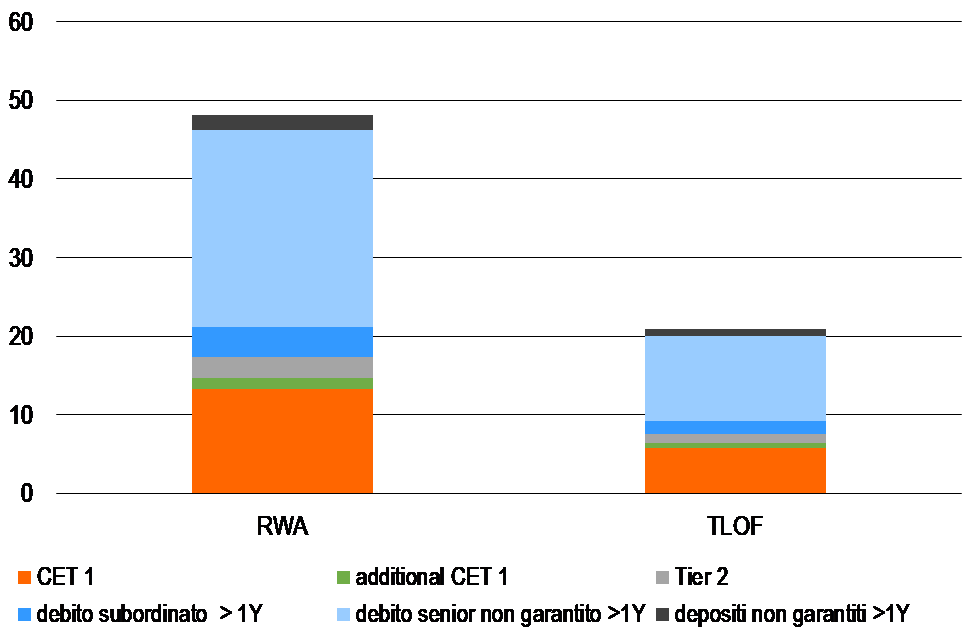
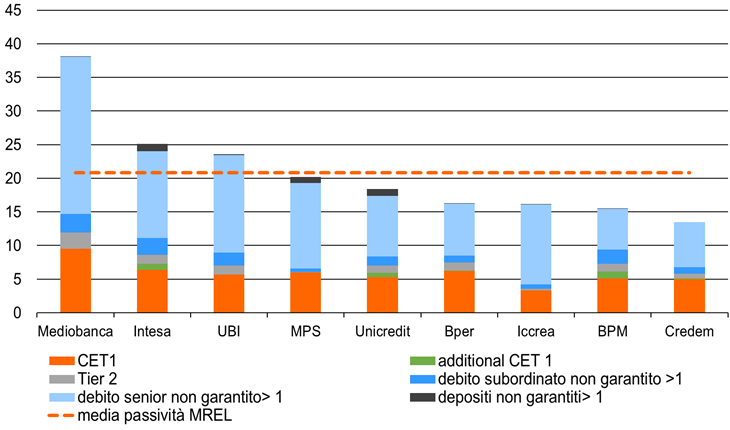
Nell’analizzare la composizione delle passività MREL è utile distinguere la loro incidenza rispetto ai due diversi denominatori adottati, il TLOF e le RWA (grafico 1).
Il totale delle passività MREL in rapporto al TLOF è stimabile pari al 21%, un valore ben più alto rispetto al dato medio per le banche europee individuato dall’EBA per il 2016 (14,4%). Guardando alle singole passività MREL si nota come il debito senior non garantito con durata residua superiore ad un anno rappresenti la quota più ampia in percentuale del TLOF (11%), seguito dal CET 1 capital (6%).
Quote più basse si riscontrano per il debito subordinato con durata residua maggiore di un anno (2%) e per additional CET 1 capital, Tier 2 capital e depositi non garantiti con scadenza superiore ad un anno (1% per ciascuna tipologia).
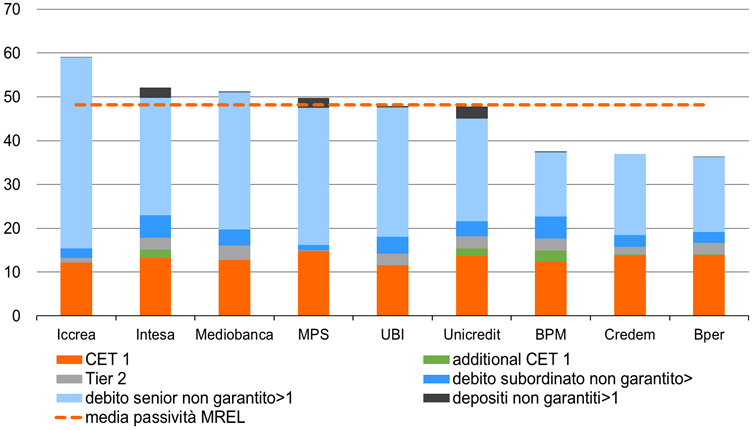
Il totale delle passività MREL rispetto alle RWA è stimabile al 48%, contro un livello medio per le banche europee individuato dall’EBA per il 2016 pari al 37,8%. La percentuale di CET 1 capital in rapporto alle RWA è del 13%, mentre è pari al 25% per il debito senior non garantito, al 4% per il debito subordinato, al 3% per i depositi, 2% per il Tier 2 capital e 1% per l’additional CET 1 capital.
In definitiva, le banche italiane sembrano avere una dotazione di passività MREL ben più elevata rispetto alle altre banche europee.
Analizzando i singoli dati delle principali banche italiane si riscontra però una certa variabilità nelle passività MREL in percentuale del TLOF (grafico 2). Il valore più elevato è quello di Mediobanca (MREL pari al 38% del TLOF), seguono Intesa (25%), UBI (24%), MPS (20%) e Unicredit (18%). Valori inferiori sono stati calcolati per Bper, BPM e Iccrea (tutti intorno al 16%) e per Credem (14%)
Facendo variare il denominatore, e considerando quindi le passività MREL rispetto al RWA (grafico 3), si nota che l’incidenza più alta si riscontra per Iccrea (59%), seguono Intesa (52%), Mediobanca (51%), MPS (50%), UBI e Unicredit (48%). Percentuali inferiori sono ottenute analizzando i bilanci di BPM (38%), Credem (37%) e Bper (36%).
Dal confronto tra le passività MREL espresse in termini di TLOF e di RWA emerge quindi un diverso ranking tra i principali gruppi bancari italiani e una diversa dispersione dei risultati. Rapportare il MREL al TLOF, come è previsto allo stato attuale, invece che alle RWA, utilizzate per il calcolo del TLAC, determina vantaggi/svantaggi a livello di singolo istituto.
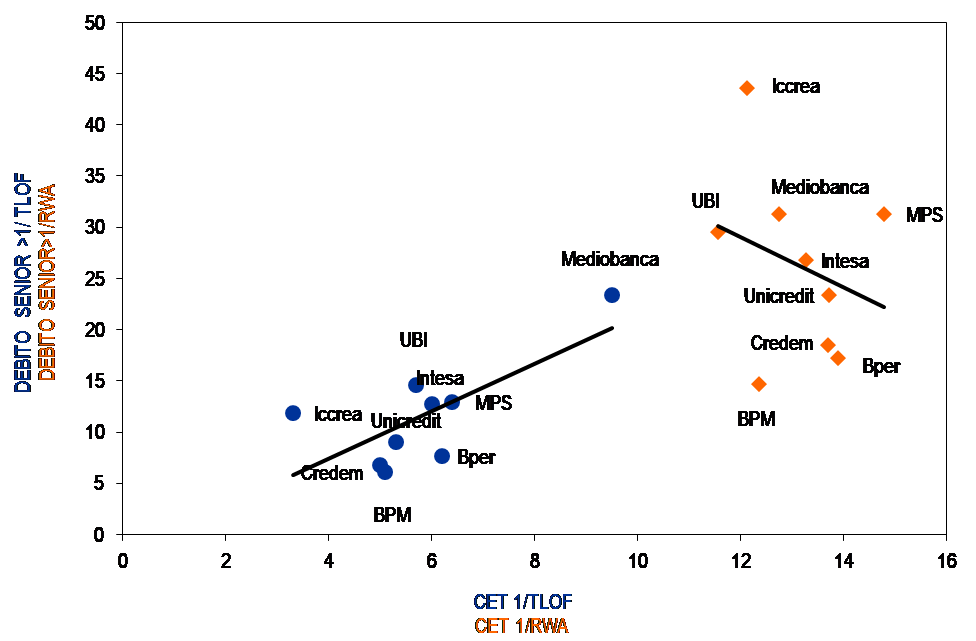
Un’ulteriore distorsione potrebbe verificarsi nella ricomposizione delle passività. Osservando la relazione tra CET 1 e debito senior si rileva un diverso andamento a seconda del denominatore considerato (TLOF vs RWA). La relazione rispetto al TLOF è crescente, in altri termini all’aumentare dell’incidenza del capitale di alta qualità aumenta anche quella delle obbligazioni senior (grafico 4). Viceversa, guadando alla relazione che considera come denominatore l’RWA, la relazione cambia di segno, diventando negativa. Ciò implica che all’aumentare di una passività tende a ridursi l’altra.
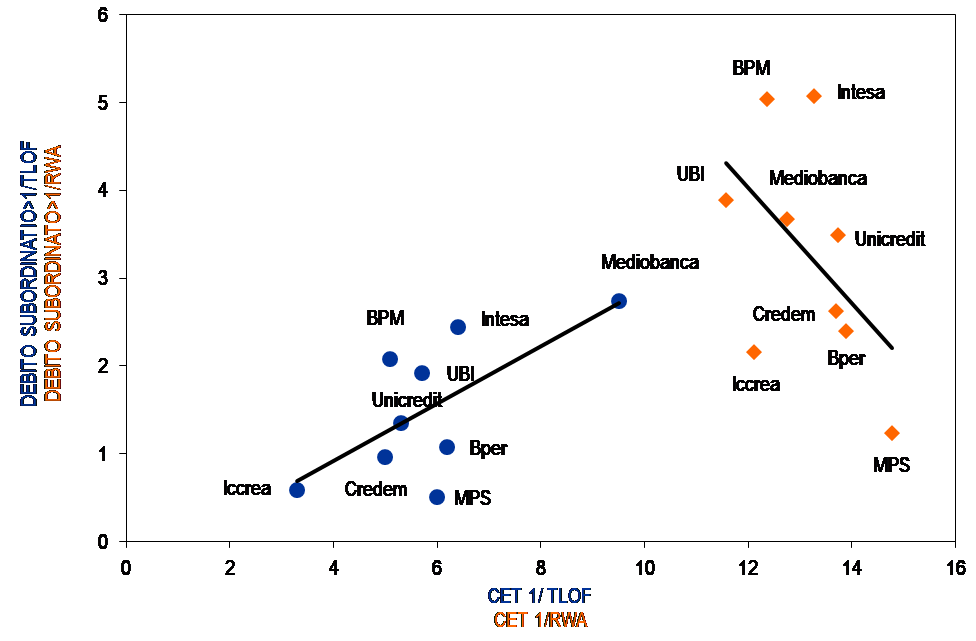
Analogo risultato si ottiene guardando alla relazione tra CET 1 capital e debito subordinato (grafico 5).
Concludendo, nonostante il percorso legislativo sul MREL sia in fase di rifinitura e completamento, restano dei punti di domanda sulla capacità del mercato di assorbire gli strumenti che le banche dovranno emettere per rispettare il requisito. La quantità di emissioni dipenderà anche dai contenuti del testo finale, in riferimento soprattutto alle modalità di calcolo delle passività.
Come osservato dall’analisi sulle principali banche italiane, il MREL potrebbe indurre anche ulteriori effetti distorsivi a seconda del denominatore considerato per il calcolo del requisito. I diversi risultati ottenuti utilizzando TLOF e RWA, queste ultime a loro volta funzione del modello di business assunto dalla banca, determinano infatti effetti sostituzione tra le passività bancarie. La conseguenza può essere quella di ottenere risultati contrari rispetto agli obiettivi fissati da MREL e TLAC. Ad esempio, alcuni istituti potrebbero scegliere di ridurre la dotazione di capitale di primaria qualità, nei limiti stabiliti dalle regole di Basilea, per incrementare il debito senior o quello junior.
Un ultimo effetto indesiderato della normativa potrebbe consistere nell’indurre gli intermediari a far fronte ad eventuali crisi con relativa facilità, grazie ad un adeguato livello di patrimonializzazione, e che l’intervento pubblico per evitare effetti sistemici non sia più necessario.
Bibliografia
In November 2018, the International Association of Insurance Supervisors (IAIS) published for consultation a holistic framework for the mitigation of systemic risk in the insurance sector…
Regarding the need for legislative improvements, in developing the Joint Advice the ESAs’ objective was that every relevant entity should be subject to clear general requirements on governance of ICT, including cybersecurity, to ensure the safe provision of regulated services…
