The European Banking Authority (EBA) issued today a revised list of validation rules in its Implementing Technical Standards (ITS) on supervisory reporting, highlighting those which have been deactivated either for incorrectness or for triggering IT problems. Competent Authorities throughout the EU are informed that data submitted in accordance with these ITS should not be formally validated against the set of deactivated rules.
Konstantin Ignatov, one of the heads of the infamous OneCoin pyramid scheme, has been arrested on wire fraud charges.
U.S. prosecutors in New York have arrested a “top leader” of the OneCoin project, saying it stole “billions” from investors through an alleged pyramid scheme.
The U.S. Attorney for the Southern District of New York (SDNY) has indicted Ruja Ignatova and Konstantin Ignatov on charges of wire fraud, securities fraud and money laundering, claiming the two defrauded investors out of “billions of dollars” using a fraudulent cryptocurrency. Konstantin Ignatov was arrested on wire fraud charges at Los Angeles International Airport earlier this week as part of the investigation.
The European Supervisory Authorities (ESAs) submitted to the European Commission, draft regulatory technical standards to amend the Delegated Regulation covering the rules for the Key Information Document (KID) for Packaged Retail and Insurance-based Investment Products (PRIIPs).
Il tempo del FINTECH è adesso : la Digital Transformation ha rivoluzionando in modo radicale tutti i livelli degli attuali modelli di business nel settore finanziario; per poter rispondere in modo proattivo alla Fintech Revolution , il MIP Politecnico di Milano ha sviluppato il nuovo Master internazionale in FINTECH – Finance and Digital Innovation .
In occasione del lancio del nuovo master, siamo lieti di invitarvi alla Roundtable che si terrà giovedì 14 marzo alle ore 18.00presso il Campus MIP.
Durante l’evento, il Direttore del Master,Prof. Emilio Barucci, le aziende sponsor e un Head Hunter di Aegis Human Consulting Group, presenteranno le nuove frontiere del Fintech e le opportunità di carriera, le opportunità e lesfide per giovani professionisti e per le imprese di questo settore.
Agenda
• 18.00: Roundtable
Modera Prof. Emilio Barucci, Direttore Master FINTECH con la partecipazione di Andrea Marchesini, Partner & Director, Aegis UK
– Roberto Villa, Manager of Research ecosystem, IBM Italy
– Savino Damico, Head of Fintech Ecosystem Management and Monitoring Innovation Dept., Intesa Sanpaolo
– Paolo Gianturco, Head of Fintech&FS Tech-EMEA Blockchain Lab co-leader, Deloitte
– Vittorio Giusti, Chief Operating Officer, Aviva Italia
– Andrea Prampolini, Head of Financial markets technology, Banca IMI
– Marco Scappa, Head of Fabrick Corporate Fintech, Fabrick S.p.A
• 19.15: Q&A
• 20.00: Aperitivo
La partecipazione all’evento è gratuita previa registrazione. Al termine dell’evento è previsto un aperitivo di networking.
The Basel Committee on Banking Supervision met in Basel on 27-28 February to discuss a range of policy and supervisory issues, and to take stock of its members’ implementation of post-crisis reforms.
The Committee also discussed its work programme for evaluating the impact of its post-crisis reforms. The programme includes planned evaluations related to cross-cutting policy issues, the countercyclical capital buffer framework and the global systemically important banks framework. Committee members also discussed issues related to sovereign risk.
The next meeting of the Basel Committee is tentatively scheduled for 19-20 June 2019.
The European Securities and Markets Authority (ESMA) has today made available the results of the annual transparency calculations for equity and equity-like instruments.
The transparency requirements based on the results of the annual transparency calculations published from 1 March for equity and equity-like instruments will apply from 1 April 2019 until 31 March 2020. From 1 April 2020, the next annual transparency calculations for equity and equity-like instruments to be published by 1 March 2020, will become applicable.
L’indagine di
Banca d’Italia sul costo dei conti correnti del 2018 (dati del 2017) offre
alcuni dati interessanti:
In media, la spesa per la gestione di un conto
corrente bancario nel 2017 è stata pari a 79,4 euro, con un incremento di 1,8
euro rispetto al 2016 (il secondo anno di incremento). Il minimo è stato toccato
nel 2015 (76 euro) rispetto al massimo pari a 91 euro raggiunto nel 2010.
Le spese fisse rappresentano i 2/3 del totale,
in particolare il canone base è aumentato di tre euro (pesa per 31 euro) mentre
le spese variabili sono rimaste perlopiù invariate. Le voci variabili di spesa
più rilevanti sono quelle relative alla carta di credito e ai prelievi al
bancomat.
Banca d’Italia individua sei profili di clienti:
giovani, famiglie con bassa/media/alta operatività, pensionati con bassa/media
operatività. Il costo per queste tipologie di conto corrente dipende dal numero
e dalla tipologia di operazioni ipotizzate per ciascun profilo. La spesa è
elevata nel caso di famiglie a media o alta operatività e pensionati a bassa
operatività.
I costi fissi pesano in misura significativa, la
differenza tra i diversi profili è data dalla componente variabile che è legata
alle operazioni effettuate dal cliente tipo. L’eccezione è rappresentata dal
profilo giovani con spese fisse che sono
pari alla metà dei conti standard.
Occhio ai contratti a consumo (conti per
specifiche esigenze) che in media risultano essere molto onerosi.
La spesa per il conto corrente dipende dalla
tipologia di banca: le prime cinque banche hanno un costo medio pari a 76,6 euro
per anno, le banche di credito cooperativo 80,7, le altre banche 83,8. Le
banche di grandi dimensioni sono dunque più convenienti.
Non c’è una grande differenza nella spesa per il
conto corrente a seconda della localizzazione geografica nel paese.
Occhio a quando è stato aperto il conto: quelli
aperti oltre dieci anni fa costano in media 96 euro, quelli che sono stati
aperti da appena un anno arrivano a 54 euro. Quindi, il suggerimento è di
guardarsi attorno e di cambiare banca.
I conto on-line sono molto più convenienti,
appena 15 euro in media con un rincaro molto limitato negli ultimi anni.
Anche i conti correnti postali costano di meno,
in media 50 euro anche se sono aumentati nell’ultimo anno in linea con quanto è
successo per i conti correnti bancari.
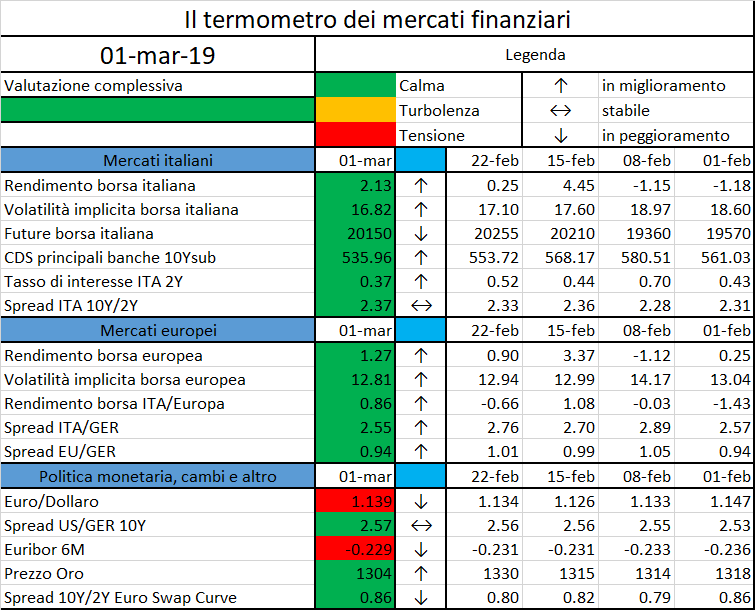
L’iniziativa di Finriskalert.it “Il termometro dei mercati finanziari” vuole presentare un indicatore settimanale sul grado di turbolenza/tensione dei mercati finanziari, con particolare attenzione all’Italia.
Significato degli indicatori
Rendimento borsa italiana: rendimento settimanale dell’indice della borsa italiana FTSEMIB;
Volatilità implicita borsa italiana: volatilità implicita calcolata considerando le opzioni at-the-money sul FTSEMIB a 3 mesi;
Future borsa italiana: valore del future sul FTSEMIB;
CDS principali banche 10Ysub: CDS medio delle obbligazioni subordinate a 10 anni delle principali banche italiane (Unicredit, Intesa San Paolo, MPS, Banco BPM);
Tasso di interesse ITA 2Y: tasso di interesse costruito sulla curva dei BTP con scadenza a due anni;
Spread ITA 10Y/2Y : differenza del tasso di interesse dei BTP a 10 anni e a 2 anni;
Rendimento borsa europea: rendimento settimanale dell’indice delle borse europee Eurostoxx;
Volatilità implicita borsa europea: volatilità implicita calcolata sulle opzioni at-the-money sull’indice Eurostoxx a scadenza 3 mesi;
Rendimento borsa ITA/Europa: differenza tra il rendimento settimanale della borsa italiana e quello delle borse europee, calcolato sugli indici FTSEMIB e Eurostoxx;
Spread ITA/GER: differenza tra i tassi di interesse italiani e tedeschi a 10 anni;
Spread EU/GER: differenza media tra i tassi di interesse dei principali paesi europei (Francia, Belgio, Spagna, Italia, Olanda) e quelli tedeschi a 10 anni;
Euro/dollaro: tasso di cambio euro/dollaro;
Spread US/GER 10Y: spread tra i tassi di interesse degli Stati Uniti e quelli tedeschi con scadenza 10 anni;
Prezzo Oro: quotazione dell’oro (in USD)
Spread 10Y/2Y Euro Swap Curve: differenza del tasso della curva EURO ZONE IRS 3M a 10Y e 2Y;
Euribor 6M: tasso euribor a 6 mesi.
I colori sono assegnati in un’ottica VaR: se il valore riportato è superiore (inferiore) al quantile al 15%, il colore utilizzato è l’arancione. Se il valore riportato è superiore (inferiore) al quantile al 5% il colore utilizzato è il rosso. La banda (verso l’alto o verso il basso) viene selezionata, a seconda dell’indicatore, nella direzione dell’instabilità del mercato. I quantili vengono ricostruiti prendendo la serie storica di un anno di osservazioni: ad esempio, un valore in una casella rossa significa che appartiene al 5% dei valori meno positivi riscontrati nell’ultimo anno. Per le prime tre voci della sezione “Politica Monetaria”, le bande per definire il colore sono simmetriche (valori in positivo e in negativo). I dati riportati provengono dal database Thomson Reuters. Infine, la tendenza mostra la dinamica in atto e viene rappresentata dalle frecce: ↑,↓, ↔ indicano rispettivamente miglioramento, peggioramento, stabilità rispetto alla rilevazione precedente.
Disclaimer: Le informazioni contenute in questa pagina sono esclusivamente a scopo informativo e per uso personale. Le informazioni possono essere modificate da finriskalert.it in qualsiasi momento e senza preavviso. Finriskalert.it non può fornire alcuna garanzia in merito all’affidabilità, completezza, esattezza ed attualità dei dati riportati e, pertanto, non assume alcuna responsabilità per qualsiasi danno legato all’uso, proprio o improprio delle informazioni contenute in questa pagina. I contenuti presenti in questa pagina non devono in alcun modo essere intesi come consigli finanziari, economici, giuridici, fiscali o di altra natura e nessuna decisione d’investimento o qualsiasi altra decisione deve essere presa unicamente sulla base di questi dati.
Questo sito utilizza cookie tecnici e di profilazione, propri e di terze parti, per garantire la corretta navigazione, analizzare il traffico e misurare l'efficacia delle attività di comunicazione.
Questo sito Web utilizza i cookie per migliorarne l'esperienza di navigazione. I cookie classificati come necessari, sono essenziali alle funzioni di base sito e vengono sempre memorizzati nel tuo browser. I cookie di terze parti, che ci aiutano ad analizzare e capire come utilizzi questo sito, vengono memorizzati nel tuo browser solo con il tuo consenso. Di seguito hai la possibilità di disattivare questi cookie. Tieni in conto che la disattivazione di alcuni di questi cookie potrebbe influire sulla tua esperienza di navigazione.
Necessary cookies are absolutely essential for the website to function properly. These cookies ensure basic functionalities and security features of the website, anonymously.
Cookie
Durata
Descrizione
cookielawinfo-checkbox-analytics
1 year
Cookie tecnico impostato dal plugin GDPR Cookie Consent che viene utilizzato per registrare il consenso dell'utente per i cookie nella categoria "Analitici".
cookielawinfo-checkbox-necessary
1 year
Cookie tecnico impostato dal plugin GDPR Cookie Consent che viene utilizzato per registrare il consenso dell'utente ai cookie.
CookieLawInfoConsent
1 year
Cookie tecnico impostato dal plugin GDPR Cookie Consent per salvare le scelte si/no dell'utente per ciascuna categoria.
viewed_cookie_policy
1 year
Cookie tecnico impostato dal plugin GDPR Cookie Consent che registra lo stato del pulsante predefinito della categoria corrispondente.
Analytical cookies are used to understand how visitors interact with the website. These cookies help provide information on metrics the number of visitors, bounce rate, traffic source, etc.
Cookie
Durata
Descrizione
_pk_id.gV3j99y0AE.0928
1 year 27 days
Cookie analitico impostato da Matomo e utilizzato per memorizzare alcuni dettagli sull'utente come l'ID univoco del visitatore
_pk_ses.gV3j99y0AE.0928
30 minutes
Cookie analitico impostato da Matomo di breve durata e utilizzato per memorizzare temporaneamente i dati della visita